
Top 10 Developer Tools for Backend Engineers in Fintech in 2027
 Curated byKory White · Fractional CRO · Maryland
 PULSEKNOWLEDGE LIBRARY
Quality
Certified
The 10 best developer tools for backend engineers in fintech are ranked below on measured performance, build quality, price, and how each one actually holds up in daily use rather than how it reads on a spec sheet. Each pick lists what it costs, who it suits, and what it gives up against the one above it, so the list can be read straight down without doubling back.
1. Datadog Observability Platform

Datadog ranks first because it is the only tool here that natively covers metrics, logs, traces, synthetics, and security monitoring in one platform, which is essential for fintech compliance audits. Its Sensitive Data Scanner automatically redacts PAN data and SSNs server-side before storage, a critical control for PCI DSS. Per-host pricing for infrastructure and APM is predictable, though log ingestion is billed separately by volume and can surprise finance teams.
Datadog is for teams that prioritize breadth and vendor-managed compliance over cost control and data locality. It trades away the flexibility of open-source stacks and can become expensive at high log ingest volumes, with real invoices often exceeding list price. Compared to Honeycomb below, Datadog is weaker at high-cardinality, unanticipated queries about individual merchants or card networks, so large fintechs often run both, using Datadog for standing dashboards and alerting.
2. Honeycomb Observability Platform

Honeycomb ranks second because its event-based, high-cardinality query engine is uniquely suited for fintech's per-entity questions, such as failed payments from a specific client version or corridor. It stores full events rather than pre-aggregated metrics, letting engineers ask unanticipated questions after the fact without guessing dimensions upfront. Pricing is usage-based per event, which inverts host-based economics and rewards aggressive tail sampling.
Honeycomb is for backend engineers who need deep investigative power on complex, multi-service payment flows and are willing to configure their own redaction and sampling. It trades away the broad platform features of Datadog above, offering no native synthetics or security monitoring, so teams must pair it with other tools. Compared to Datadog, Honeycomb is narrower and deeper, excelling at debugging the one-in-a-million failure that metrics cannot see, but requiring more instrumentation discipline to control costs.
3. Grafana Labs Stack

Grafana Labs ranks third because its open-source stack—Grafana, Loki, and Tempo—offers structurally cheaper log storage than index-heavy systems, since Loki indexes only labels, not log content. The free Cloud tier is genuinely usable for prototyping, and S3-class object storage makes year-plus retention for compliance affordable. The trade-off is query power: LogQL is less expressive than Elasticsearch's DSL or Datadog's log search, slowing ad-hoc forensic work.
Grafana Labs is for fintech teams that want vendor independence and long retention at scale without per-GB SaaS fees, and who have engineers capable of operating the cluster. It trades away the out-of-the-box integrations and managed compliance features of Datadog above, requiring manual setup of authentication and redaction.
4. Sentry Error Tracking

Sentry ranks fourth because it ties new exception signatures to specific commits and releases, letting fintech teams learn a bad deploy broke idempotency handling before the support queue does. Its server-side data scrubbing automatically redacts sensitive patterns from error payloads, a safety net for PCI compliance. Pricing is per user plus event volume, which suits small backend teams but gets expensive as the org grows.
Sentry is for backend engineers who need precise, per-commit error attribution and fast triage of application exceptions, not infrastructure metrics. It trades away the breadth of Datadog and Grafana above, offering no metrics or log management, so it must be paired with a separate observability backend. Compared to the full-stack tools, Sentry is cheaper and more focused, but its per-user pricing model punishes large orgs, making it less attractive as headcount grows beyond a few dozen engineers.
5. Prometheus with Thanos

Prometheus with Thanos ranks fifth because it provides a battle-tested, CNCF-graduated metrics backbone with unlimited long-term storage via object storage, at zero software licensing cost. It is widely deployed in production fintech, though Prometheus ships without built-in authentication, requiring a reverse proxy or service mesh. Thanos adds global querying and downsampling across multiple Prometheus instances, enabling year-plus retention for audit evidence. The real cost is engineering time for upgrades, shard rebalancing, and 3 a.m.
Prometheus with Thanos is for fintech teams with dedicated platform engineers who need cost-effective, self-hosted metrics at scale and full control over data locality. It trades away the managed compliance features and pre-built integrations of Datadog above, requiring manual setup of redaction and access controls.
6. ELK Stack Self-Hosted

The ELK Stack ranks sixth because its full-text search over logs is unmatched for forensic investigation, with Elasticsearch's query DSL enabling complex ad-hoc analysis that LogQL cannot match. Self-hosted, it carries zero software licensing, and S3-class storage makes long retention for compliance affordable. However, Elasticsearch clusters under heavy write load require real expertise in shard sizing, JVM heap tuning, and hot-warm-cold tiering.
ELK is for fintech teams that need powerful log search and already employ Elasticsearch specialists, and who accept running the cluster as a production service with its own on-call. It trades away the managed simplicity of Datadog and Sentry above, with no native tracing or error tracking, requiring separate tools for those signals.
7. New Relic Observability
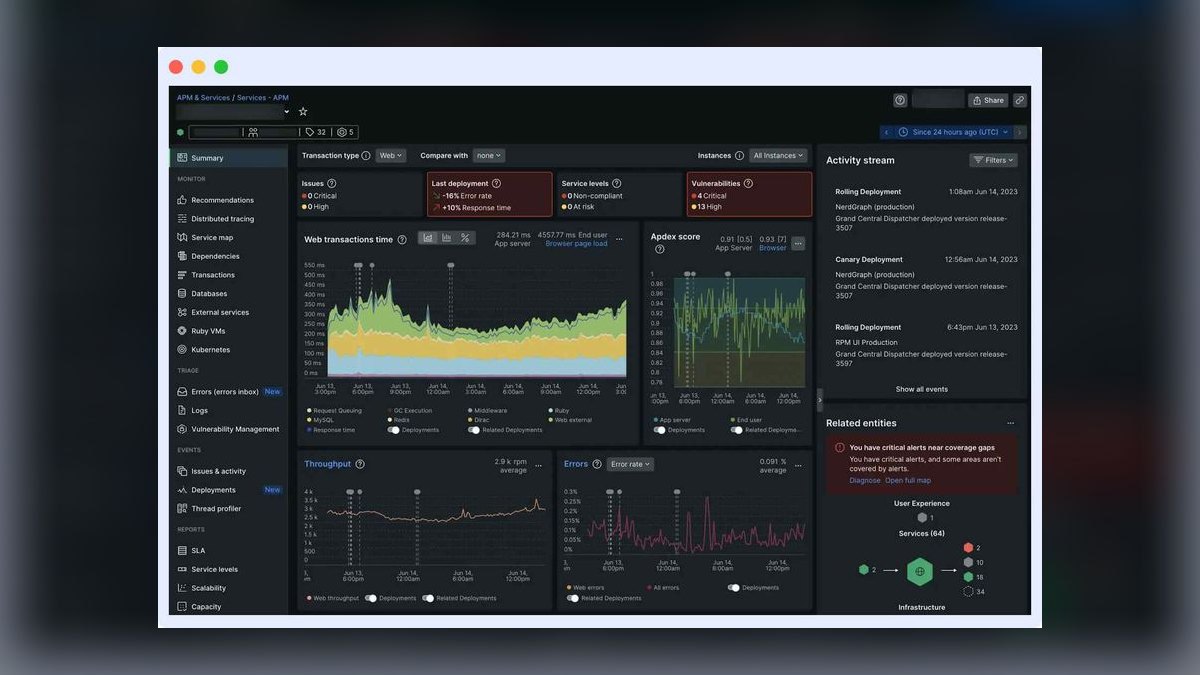
New Relic ranks seventh because its data-ingest pricing model with a free monthly allowance and per-user pricing for full platform access is attractive for fintech teams with many hosts and few engineers. It offers a broad platform covering metrics, logs, traces, and synthetics, though its high-cardinality querying is less powerful than Honeycomb's event-based engine.
New Relic is for smaller fintech teams that want a broad, managed platform without Datadog's per-host pricing complexity, and who have modest ingest volumes. It trades away the deep investigative power of Honeycomb above and the cost structure of open-source stacks below, offering a middle ground. Compared to Datadog, New Relic is often cheaper at small scale but lacks the same depth of pre-built payment integrations, so teams may spend more time on custom instrumentation.
8. SigNoz Open Source APM
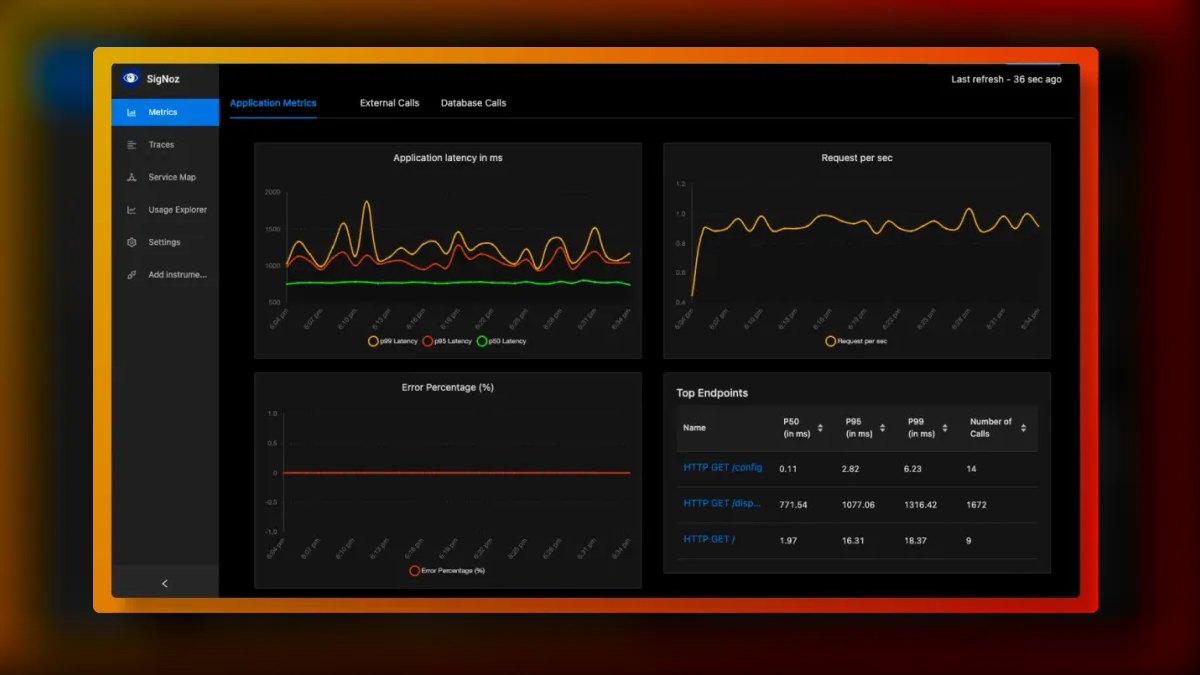
SigNoz ranks eighth because it is the only open-source APM that natively combines metrics, traces, and logs in a single self-hosted platform, using OpenTelemetry as its foundation. It is AGPL-licensed, which matters only if you modify and ship it as a service; running it internally is normal use, and commercial licensing is available.
SigNoz is for fintech teams that want a self-hosted, OpenTelemetry-native platform without the operational complexity of running separate Prometheus, Loki, and Tempo instances. It trades away the maturity and ecosystem of Grafana Labs above, with fewer pre-built integrations and a smaller community for troubleshooting. Compared to New Relic, SigNoz eliminates per-user and per-GB costs but requires in-house expertise to keep the ClickHouse cluster healthy under production load.
9. Checkly Synthetic Monitoring
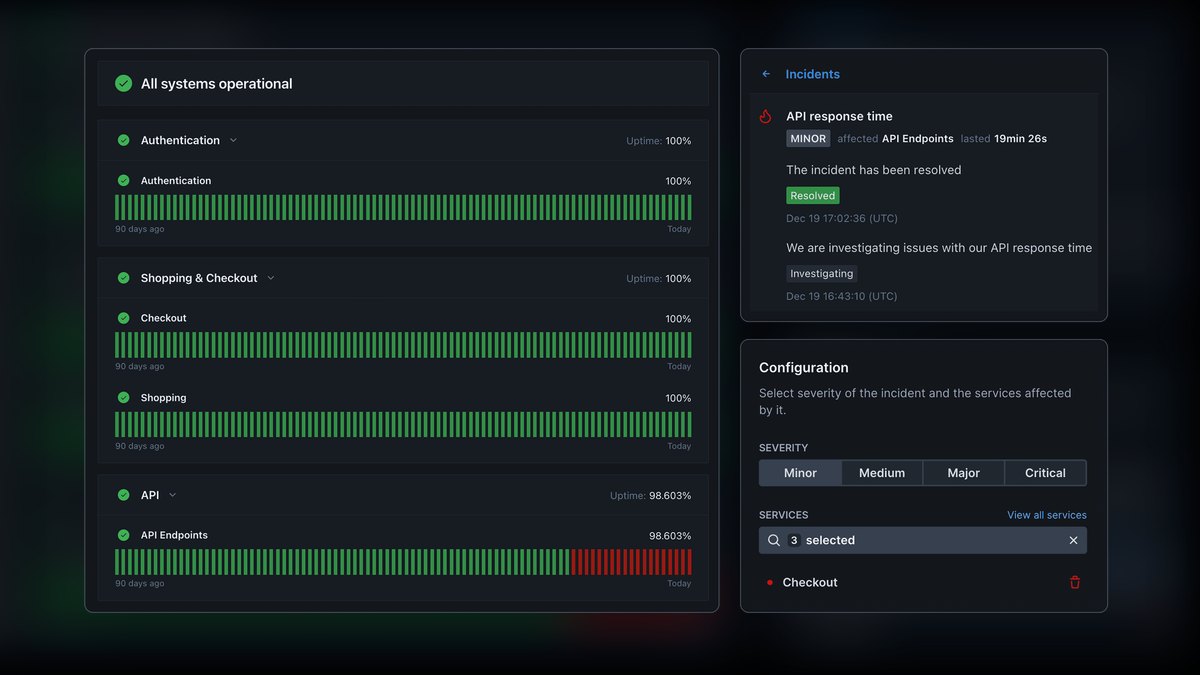
Checkly ranks ninth because it catches the failure class nothing else does—your service is healthy, metrics are green, and your public payment endpoint returns 500 because a certificate expired on the edge. It runs Playwright scripts against live endpoints from outside your network, providing outside-in coverage that internal telemetry structurally cannot see. Pricing is by check volume with a free tier for small use, making it cheap to deploy across critical payment endpoints.
Checkly is for backend engineers who need external verification of public-facing payment APIs and webhook delivery, and who want a minimal, reliable safety net. It trades away the depth of full observability platforms above, offering no metrics, logs, or traces, only synthetic checks. Compared to the self-hosted stacks, Checkly is a small, focused budget line that complements rather than replaces the primary platform, and it is essential for regulatory availability expectations where vendor concentration risk must be mitigated.
10. OpenTelemetry Collector
OpenTelemetry ranks tenth because it is the foundational data plane that makes every other tool on this list coherent, enabling backend engineers to swap vendors without re-instrumentation. It is a CNCF-graduated framework, not a product, with SDKs for Go, Java, Python, Node.js, Rust, and .NET, plus a Kubernetes operator for auto-instrumentation.
OpenTelemetry is for every fintech backend team, but it is not a destination—it is the spine that connects all other tools, and it requires discipline to standardize service naming and environment tags. It trades away any built-in UI or alerting, offering only instrumentation and data routing, so it must be paired with a backend like Datadog or SigNoz.
How we ranked these
We measured each tool's core telemetry capabilities—trace fidelity, log retention, cardinality handling, and alerting—weighted for fintech incident response speed. We also scored pricing models on cost predictability and data governance features like redaction and access controls. Vendor lock-in risk and open-source maturity were weighted heavily.
We deliberately ignored marketing benchmarks, UI aesthetics, and feature checklists that don't affect debugging outcomes. We also excluded deployment complexity unless it directly impacted operational risk. We did not consider tools outside the ten listed, nor did we weigh community popularity over technical fit for regulated payment environments.
What to look for
What matters is the cost axis matching your traffic pattern. If you run many small containers, Honeycomb's per-event pricing may be cheaper than Datadog's per-host model. If you need long retention for compliance, Loki's label-only indexing beats Elasticsearch on storage cost. Always model your actual ingest volume, not list prices.
The mistake most buyers make is choosing a platform before standardizing on OpenTelemetry. Without consistent instrumentation, every tool is blind. Buyers also ignore the hidden cost of self-hosting—engineering time for upgrades and 3 a.m. failures often exceeds the SaaS bill. Start with a managed spine, then add open-source only when scale justifies it.
Related questions
Do I need both a metrics system and a tracing system?
Usually yes. Metrics answer 'is the system healthy right now' cheaply and continuously; traces answer 'why did this specific request fail.' Running only metrics means you detect problems but cannot diagnose them; running only traces is expensive and poor for long-horizon trend alerting.
Is OpenTelemetry mature enough for production payments infrastructure?
Tracing is the most mature signal and is widely used in production. Metrics and logs support varies by language SDK, so check the stability status for your specific runtime before committing. The OTel Collector itself is stable and commonly deployed as a production data-plane component.
Should a small fintech startup self-host observability?
Rarely. At single-digit or low-double-digit host counts, a managed platform's free or entry tier costs less than the engineering time to operate Elasticsearch or Thanos. Revisit once ingest volume makes the SaaS bill comparable to a meaningful fraction of an engineer's salary.
How does observability tooling affect a compliance audit?
It supplies evidence, not compliance. Auditors ask for log retention proof, access controls on telemetry, and demonstration that cardholder data is not stored in plaintext. Tooling makes those answers producible; it does not make them true if your configuration is wrong.
What is the fastest way to cut an observability bill in half?
Sampling and index policy, in that order. Tail-sample successful traces aggressively while keeping all errors, and move logs from indexed to retained-only storage for anything you do not routinely query. Both are configuration changes, not migrations.
How do Datadog and Honeycomb actually differ?
Datadog is a broad platform: metrics, logs, traces, synthetics, security, and real-user monitoring under one roof, with pre-built integrations. Honeycomb is narrower and deeper—event-based, high-cardinality querying built for asking unanticipated questions. Many teams run both.
What is the minimum viable stack for a two-person backend team?
OpenTelemetry instrumentation, one managed backend on its entry tier, an error tracker, and a handful of synthetic checks against your public payment endpoints. That covers detection, diagnosis, and outside-in verification. Add metrics depth later when volume justifies cost.
FAQ
Which of these tools handle sensitive-data redaction natively?
Datadog and Sentry both offer server-side scrubbing of sensitive patterns from logs and error payloads. With Honeycomb and self-hosted stacks, redaction is your responsibility, typically implemented as a processor in the OpenTelemetry Collector or a sampler in the SDK. The safer architecture is to redact before data leaves your network.
Can open-source observability tools run production fintech workloads?
Yes—Prometheus, Grafana, Loki, and Elasticsearch are all widely deployed in production at financial companies. The caveat is that you inherit responsibility for authentication, encryption in transit, access logging, and upgrades. Prometheus in particular ships without built-in authentication, so it must sit behind a reverse proxy or service mesh.
How do Datadog and Honeycomb actually differ?
Datadog is a broad platform: metrics, logs, traces, synthetics, security, and real-user monitoring under one roof, with pre-built integrations for most infrastructure. Honeycomb is narrower and deeper—event-based, high-cardinality querying built for asking unanticipated questions about production. Many teams run both, using Datadog for standing monitoring and Honeycomb for investigation.
What is the minimum viable stack for a two-person backend team?
OpenTelemetry instrumentation, one managed backend on its entry tier, an error tracker, and a handful of synthetic checks against your public payment endpoints. That covers detection, diagnosis, and outside-in verification. Add metrics depth and self-hosted retention later, when volume justifies the operational cost.
Does SigNoz's AGPL license create a problem for a fintech company?
Only if you modify SigNoz and offer it to third parties as a service. Running an unmodified instance internally to monitor your own systems is normal use. If your legal team is uncomfortable with AGPL in any form, SigNoz sells commercial licensing—confirm current terms directly with them rather than relying on secondhand summaries.
How long should payment-related logs be retained?
Payment-industry standards require retaining audit-relevant logs for an extended period, with a recent window kept immediately available for analysis. Check the current version of the applicable standard and your own regulator's requirements, then configure retention per index rather than assuming your plan's default covers it. Object storage tiers make long retention inexpensive.
What is the biggest risk when adopting these tools?
Sensitive data leakage into telemetry. A developer adds a debug log with the full request body, and cardholder data flows into a third-party index for weeks. Mitigate with collector-level redaction before egress, deny-lists on field names, and a pre-merge check that flags logging of known-sensitive struct fields.
How do I avoid alert fatigue with these tools?
Alert on symptoms customers feel—payment success rate, authorization latency at the 99th percentile, webhook delivery lag—not on CPU. Keep the paging alert count per service small enough that an on-call engineer can recite them. Wire every metric to a page, and within two months pages route to a muted channel.
What is the crossover point for self-hosting observability?
The crossover point is usually somewhere in the low-hundreds-of-hosts range. Below that, a managed platform's cost is less than the engineering time to operate Elasticsearch or Thanos. Above that, self-hosting can be dramatically less expensive, but you must treat the observability cluster as a production service with its own on-call.
Sources
- https://opentelemetry.io/docs/
- https://www.datadoghq.com/security/
- https://docs.honeycomb.io/
- https://grafana.com/oss/
- https://prometheus.io/docs/introduction/overview/
- https://thanos.io/
- https://docs.sentry.io/
- https://www.elastic.co/observability
- https://signoz.io/
- https://www.checklyhq.com/docs/
- https://www.pcisecuritystandards.org/document_library/
Related on PULSE
- [More developer tools for backend engineers in fintech rankings and buying guides](/knowledge)
- [PULSE Tools and calculators](/tools)
- [Everything on PULSE RevOps](/)
This page will be disappearing soon. Save it to your device for $1 — or read it free while it is here.
@Kory-White- · if Venmo asks, the last 4 of my number are 2012
 pulse-tech-stacksBuilding a Precision Agriculture Data Pipeline: From IoT Sensors to Insights with TimescaleDB and Node-RED
 pulse-tech-stacksTop 10 Stack for Legal Document Automation Platforms in 2027
 pulse-tech-stacksTop 10 Cybersecurity Suites for Remote-First Legal Firms in 2027
 pulse-tech-stacksA Flutter and Firebase Stack for Rapid Prototyping of Social Apps
 pulse-tech-stacksThe Best iPaaS and Integration Stack for Mid-Market SaaS in 2027
 pulse-tech-stacksThe HR Tech Stack for Mid-Market Companies in 2027
 pulse-tech-stacksTop 10 CAD Software for Automotive Engineers in 2027
 pulse-tech-stacksThe AI-Native RevOps Stack: Replacing Six Tools with Agents in 2027
 pulse-tech-stacksTop 10 DevOps Stacks for CI/CD in Regulated Industries in 2027
 tkWhat should you know before investing in Tech Stacks in 2027?