
How Do I Know How Many Cooks and Servers to Schedule Each Shift at My Pizza Restaurant?
 Curated byKory White · Fractional CRO · Maryland
 PULSEKNOWLEDGE LIBRARY
Divide each shift's average gross profit by a per-person gross-profit target your leads agree on — say $200 per person per shift. A Friday dinner producing $2,400 needs 12 people; a $600 Monday lunch needs 3. Then use point-of-sale ticket times to place those bodies against the actual rush.
Why gross profit beats the labor-percentage habit
Most pizza owners schedule one of two ways: by memory ("we always run four on Friday") or by labor percentage ("keep labor under 28%"). Both feel rigorous. Neither tells you how many people to put on the floor at 6:15 p.m. on a Thursday in October.
Memory scheduling fails because it encodes last year's volume into this year's schedule. You opened with three cooks in your first summer, business grew 40%, and you are still opening with three because nobody re-derived the number. The schedule becomes a fossil. It also fails in the other direction — you added a person during a busy December, never took them back off, and have been paying for that ghost shift every Monday for eight months.
Labor percentage fails for a subtler reason: it is a rearview measurement, not a forward instruction. A percentage tells you whether last week was efficient. It cannot tell a manager building next week's schedule how many cooks to put on Tuesday lunch, because the percentage only resolves after the sales come in. Managers end up guessing the headcount, then rationalizing the percentage afterward. Worse, labor percentage is blind to mix. Two shifts can both hit 27% labor while one sold high-margin specialty pies and the other sold discounted two-for-one cheese pizzas that barely cleared food cost. The percentage says they performed identically. Your bank account disagrees.
Gross profit per person fixes both problems. It is forward-facing — you know Friday dinner's trailing gross profit before Friday arrives, so the headcount is computable in advance. And it is margin-aware, because gross profit is revenue minus cost of goods sold, which means a discount-heavy shift automatically shrinks the headcount it justifies. The metric self-corrects for the exact thing labor percentage ignores.
The practical setup: pull three to six months of sales, subtract food and beverage cost, and bucket the result by day and daypart. Most point-of-sale systems export this natively or through a reporting add-on. If yours does not, a manual export into a spreadsheet with a theoretical food-cost percentage applied per category gets you 90% of the way there — precision matters less than consistency. Use the same method every month so the trend line means something.
Then set the per-person target with your kitchen manager and front-of-house lead in the room, not alone at a desk. The number should represent the gross profit one average team member produces during an average shift giving average service. Say the number out loud to the crew: "Work a normal shift, handle a normal number of tickets, and you should produce no less than $200 in gross profit." Your strong people clear it without thinking about it. Your weak people now have a floor they can see. And when someone argues the number is too high, you have a conversation about tickets and speed instead of a conversation about feelings.
One caution on setting the target: derive it from a period you were actually staffed correctly, or at least defensibly. If you pull the target from a quarter when you were chronically short-staffed, you will bake understaffing into every future schedule and wonder why tickets keep running long. A reasonable sanity check is to compute the target three ways — from a good month, a bad month, and the full trailing period — and pick a number in the middle you can defend to the crew.
This versus the common alternatives
The gross-profit division method is not the only approach in circulation, and it is worth being honest about where the alternatives genuinely win.
Sales-per-labor-hour (SPLH) is the closest cousin and the most common alternative in restaurant operations. Instead of gross profit per person per shift, you target revenue per labor hour — say $70 SPLH. It is simpler to compute because it skips the cost-of-goods step, and most point-of-sale systems report it natively. The weakness is the same margin blindness as labor percentage: SPLH treats a $30 specialty pie and a $30 discounted bundle as identical. For a pizza shop running frequent promotions, third-party delivery, or a large-format value menu, SPLH quietly overstaffs your lowest-margin volume. If your menu mix is stable and you rarely discount, SPLH is fine and cheaper to maintain.
Covers-based staffing — one server per X tables or X covers — is the standard in full-service dining and works well where the service model is table-driven. It maps badly onto pizza because a pizza restaurant's work is not distributed by table. A counter order, a phone order, a delivery, and a dine-in table generate wildly different labor. A shop doing 60% delivery has almost no relationship between covers and cooks. If you run a full-service pizzeria with a real dining room, a hybrid works: covers for servers, gross profit for the kitchen.
Ticket-count staffing — one cook per N tickets per hour — is the most kitchen-native alternative and genuinely useful for the back of house. Ovens have throughput limits that money does not describe. A single deck oven that fits 12 pies at a time caps you at roughly 60–70 pies an hour regardless of what the gross-profit math says you can afford. This is the alternative most worth blending in, and the section below on ceilings covers it.
Fixed templates — the same schedule every week, adjusted only for callouts — deserve a fairer hearing than they usually get. Templates are extremely cheap to administer, they give the crew predictable income, and predictability reduces turnover, which is itself a large hidden cost. The right posture is not to abandon templates but to re-derive them quarterly using the gross-profit math, then run them as a template until the next re-derivation. You get the stability without the fossilization.
Vendor auto-scheduling — letting a scheduling platform propose the line-up from forecast sales — is the most automated option. The forecast quality depends entirely on how clean your point-of-sale integration is and how much history it has. It is worth turning on as a second opinion once you have run your own math for a quarter, because a disagreement between your number and the software's number is usually pointing at something real: a shifted rush, a new competitor, a menu change you did not account for.
The honest summary: gross-profit division is the best default for an independent pizza shop because it is margin-aware, computable in advance, and explainable to the crew. It is not the best choice if your margin data is unreliable, in which case fix the cost-of-goods accounting first and run SPLH in the meantime.
How to choose between them
Choosing a method is mostly a question of what data you can trust and how complex your service model is. Work through it in this order.
Start with your cost-of-goods data. If you cannot produce a defensible food-cost number by category, gross-profit staffing will produce confident nonsense. Fix the accounting first — theoretical food cost by menu item, monthly inventory, waste tracking — or fall back to sales-per-labor-hour until you can.
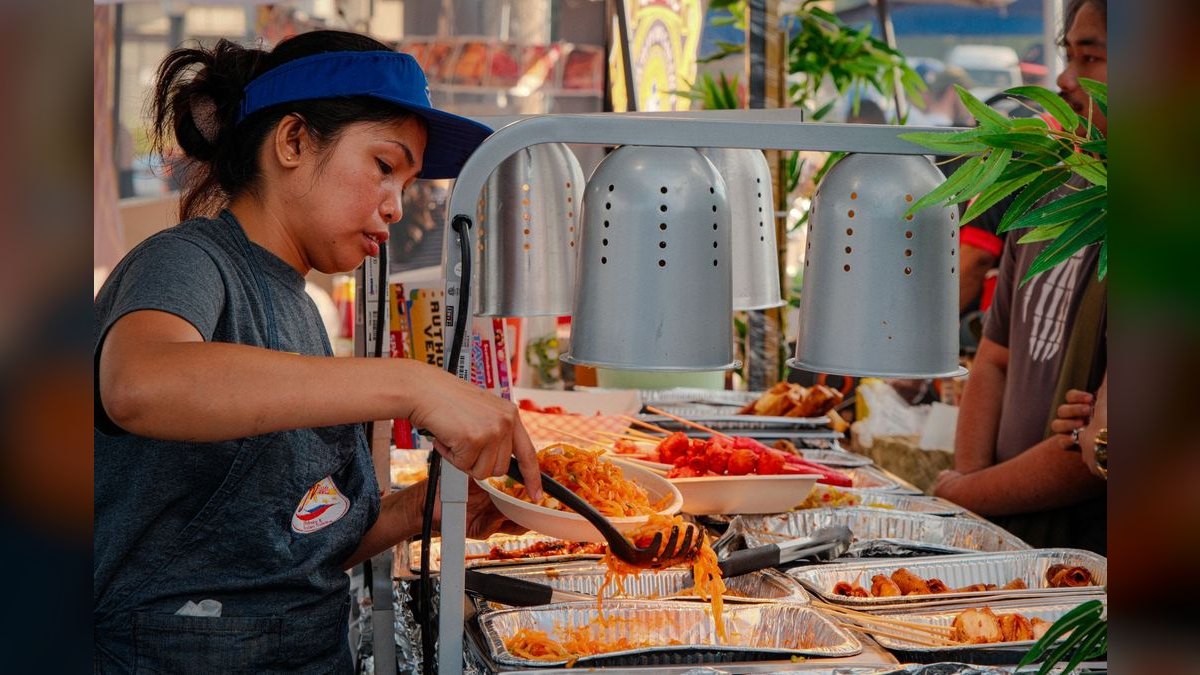
Next, look at your channel mix. A shop that is 80% dine-in with table service should split methods: covers or SPLH for servers, ticket throughput for cooks. A shop that is 70% carryout and delivery should run gross profit for the whole operation and treat drivers as a separate line item driven by delivery-order count and average drive time, not by dollars.
Then look at your discount exposure. Heavy promotional activity, third-party marketplace orders with 20–30% commissions, and catering at negotiated rates all distort revenue-based methods badly. The more of your volume runs through discounted or commissioned channels, the more strongly gross profit beats every revenue-based alternative — because it is the only method that automatically sees the margin compression.
Finally, consider your management bandwidth. A single owner-operator working the line cannot maintain a weekly re-derivation. Quarterly re-derivation plus a stable template is the realistic cadence. A shop with a general manager and shift leads can run it weekly and will capture more of the upside.
Where the math has ceilings
Gross-profit division answers "how many people can this shift afford." It does not answer "how many people can this shift physically use." Both constraints bind, and the schedule takes whichever number is lower.
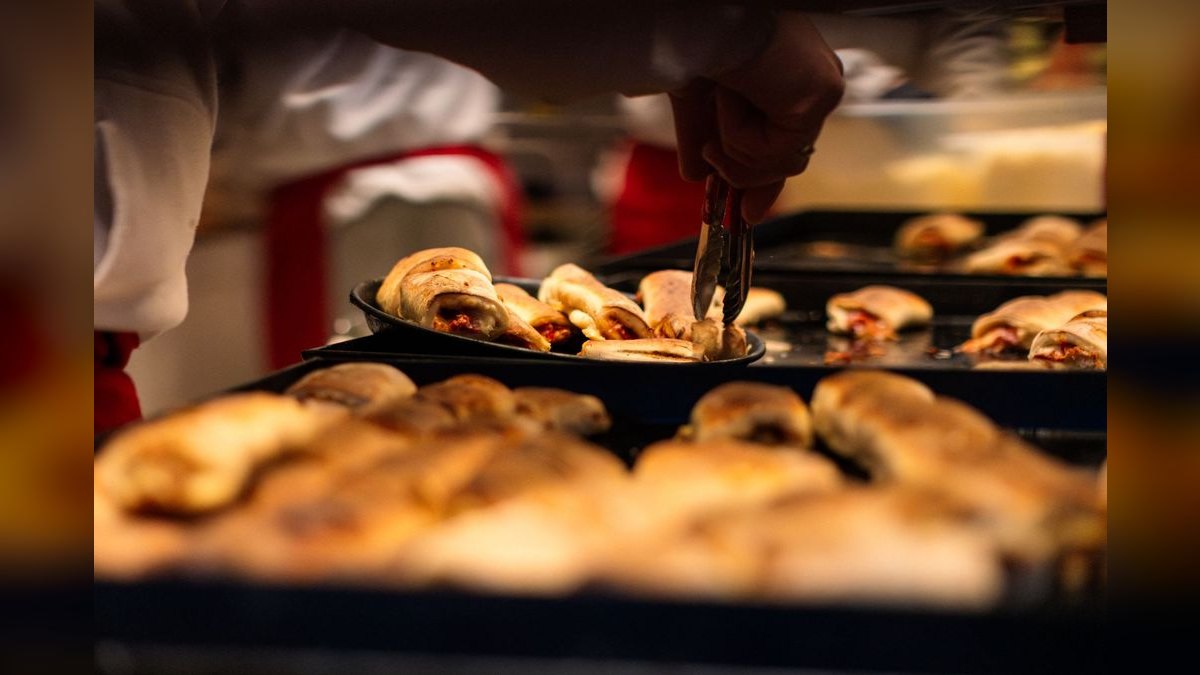
The oven is the hardest ceiling in a pizza restaurant. A deck oven with a 12-pie capacity and a 7-minute bake gives you a theoretical ceiling near 100 pies an hour and a realistic one closer to 60–70 once you account for loading, rotation, and uneven bake times. A conveyor oven is more predictable but capped by belt speed and width. Adding a fourth cook to a shift that is already oven-limited buys you nothing but payroll. If the gross-profit math says 12 people and your oven tops out serving 8 people's worth of throughput, the answer is not more staff — it is a second oven, a par-bake strategy, or a menu change that moves volume to items that do not compete for oven space.

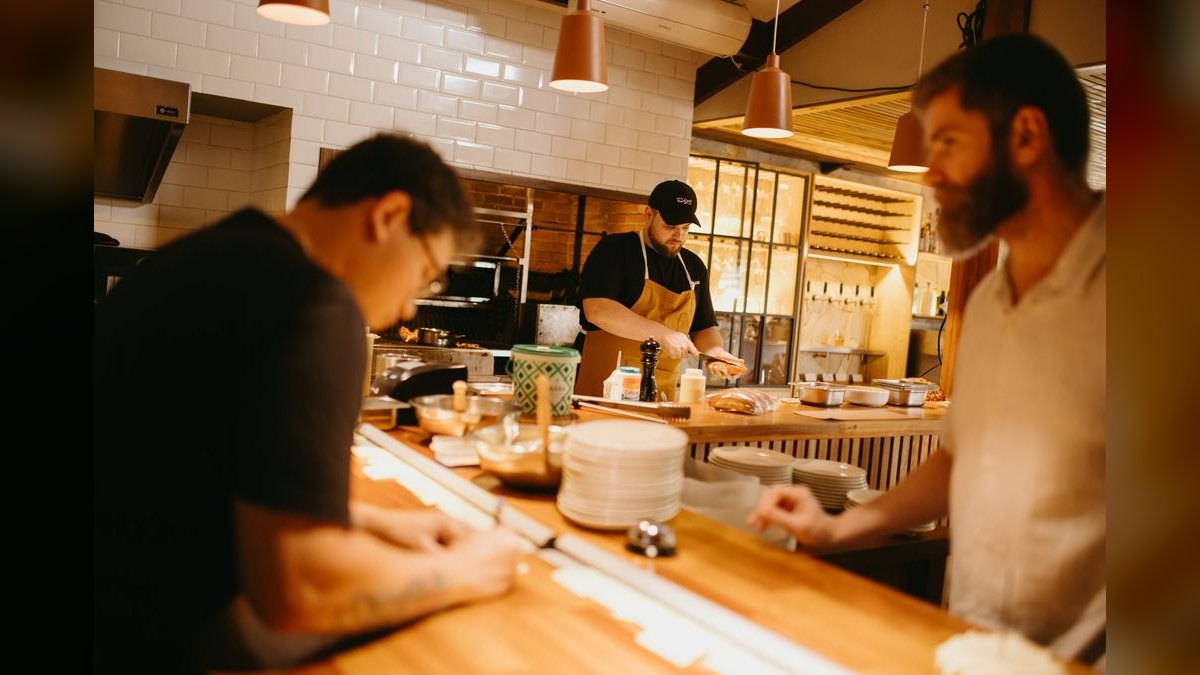
Station geometry is the second ceiling. A make line built for two people does not become faster with three; the third person becomes a bottleneck who is constantly stepping around the other two. Before you schedule the number the math produces, physically walk the line and count how many bodies can work without collision. Most independent pizza shops max out at two to three on the make line, one to two on the oven, one on cut-and-box, plus counter and phones.
Skill mix is the third and most-ignored ceiling. Twelve people is meaningless if nine of them are new. The headcount number assumes an average team member producing at the target. A shift stacked with three-week hires is effectively a smaller shift, and you should schedule it as such — or accept slower tickets and plan for it. A practical adjustment: assign each person a competency multiplier (0.6 for new, 1.0 for solid, 1.3 for strong) and schedule until the weighted sum hits your target headcount rather than the raw body count.
There is also a floor, not just a ceiling. Every shift has a minimum viable crew regardless of what the math says. You cannot run a dinner service with 1.4 people. Set a hard minimum per daypart — often two in the kitchen and one on the counter even on your deadest Tuesday — and treat that as non-negotiable safety and service infrastructure. The gross-profit math governs everything above the floor.
Finally, the math is silent on legal constraints. Minor-labor restrictions, mandatory break scheduling, predictive-scheduling ordinances in some cities, and overtime thresholds all shape the schedule independently of profit. Build those in as hard rules the math has to work around, not as adjustments you make afterward.

Costs, timelines, and what to expect
The method itself costs nothing but attention. The tooling around it ranges from free to enterprise, and it is worth being clear about what you actually need at each stage.
For a single location, the free tier of a restaurant-focused scheduling app plus a spreadsheet is genuinely sufficient. Several well-known platforms offer free tiers covering one location — enough to publish schedules, run a time clock, and track labor against sales. The paid tiers of restaurant-native scheduling software generally start in the mid-$30s per location per month and climb toward $80 for the fuller feature sets; general-purpose shift apps often price per user in the low single dollars per month. Enterprise restaurant platforms and full back-office suites that bundle accounting and inventory are quote-based and typically land well above what a single shop needs. Price the tool against the labor dollars it saves, not against its feature list — if a $40/month tool prevents one unnecessary four-hour shift a week, it has paid for itself several times over.
On timeline: expect two to four weeks before the schedule stops fighting you. Week one is data cleanup — you will discover your daypart boundaries are wrong, your food cost is stale, or your point-of-sale is categorizing delivery oddly. Week two you produce the first math-driven schedule and it will feel wrong to your managers, because it will differ from habit by one or two people on several shifts. Weeks three and four you compare predicted to actual, adjust the per-person target, and start trusting it.
On impact: the realistic wins are removing chronic overstaffing on slow dayparts and catching chronic understaffing on the shifts that actually make your money. Most independent shops discover both at once — they are carrying an extra body through a dead Tuesday afternoon and running one short during the Friday 6-to-8 peak, which costs far more in blown tickets, refused delivery orders, and long quotes than the Tuesday body costs in wages. The Friday fix is usually the bigger dollar item and the one owners underweight, because overstaffing shows up on the P&L and understaffing shows up only as revenue that never happened.

Do not promise yourself a fixed percentage of savings. The honest expectation is a schedule you can defend line by line, a crew that knows the standard, and a manager who can answer "why are four people on tonight" with a number instead of a shrug. That is worth more over a year than any single week's labor cut.
Budget for a review cadence too. Fifteen minutes a week comparing predicted headcount to actual gross profit, and a full re-derivation quarterly. Seasonal shops — anywhere near a campus, a beach, or a stadium — should re-derive at every season change rather than on the calendar quarter, because a trailing six-month average smears two completely different businesses together.
Implementation and handoff details
The method only survives if it outlives your attention. That means writing it down, assigning it, and building a review loop.
Define the buckets once and freeze them. Decide your dayparts explicitly — for a pizza shop, something like lunch 11:00–2:00, afternoon 2:00–4:30, dinner 4:30–9:00, late 9:00–close — and never change them casually. Every trend comparison depends on stable buckets. Write the definitions in the same document as the per-person target.

Write the target and its derivation. One page: the number, the period it came from, who agreed to it, and the date it expires. The expiration date is the most important line; without it the target silently becomes another fossil.
Assign the calculation to a named person. Usually the general manager or the owner. The task is: pull trailing gross profit by daypart, divide by target, produce headcount by shift, then place those bodies against the point-of-sale ticket curve. Thirty minutes weekly once the data pipeline is clean.
Separate the count from the timing. The division gives you how many. Your ticket-time report gives you when. If tickets spike 6:00–8:00 and fall off a cliff by 8:45, you stagger — an opener, a mid arriving at 5:00, closers overlapping the peak and covering breakdown. Staggering is where most of the real savings live, because a shift that is correctly sized in headcount can still waste four labor hours by starting everyone at once.
Handle the exceptions explicitly. Local events, weather, school schedules, and holidays override the trailing average. Keep a shared calendar of known demand events and adjust the computed headcount up or down against it before publishing. A single home game or a first-warm-Saturday can double a dinner and the trailing average will never see it coming.
Close the loop. After each week, compare predicted headcount to what the shift actually earned. Three consecutive shifts where actual gross profit runs well above what the headcount assumed means the target is too high or the shift is being underserved. Three the other way means overstaffing or a soft period. This weekly comparison is the RevOps discipline underneath the whole method — it is the same forecast-to-actual loop a sales organization runs on pipeline, applied to labor. The restaurant version is faster, because the feedback arrives nightly instead of quarterly.

Hand it off in writing when management changes. The most common failure is a manager who understood the method leaving, and the successor reverting to last week's schedule. The one-page document plus one working session with the successor prevents it.
Adjacent applications of the same method
The division is not pizza-specific, and seeing where else it applies tends to make owners more confident using it.
Delivery drivers need a parallel calculation on a different denominator. Drivers are constrained by orders per hour and average round-trip time, not by dollars. If your average delivery round trip is 22 minutes including hand-off, one driver clears roughly 2.5 runs an hour, and multi-order runs raise that meaningfully during a dense peak. Compute driver count from projected delivery orders divided by that rate, then sanity-check the cost against the delivery gross profit those orders produce. Third-party marketplace orders should be evaluated separately, since the commission changes the margin entirely.
Prep shifts invert the logic. Prep labor is driven by the volume you are about to sell, not the volume happening now, so prep headcount should be derived from tomorrow's projected gross profit, not today's. Shops that schedule prep off today's rush chronically under-prep for a busy weekend and over-prep going into a slow Monday.

Catering and large orders break the daypart average entirely. A 40-pie order dropped into a Tuesday lunch does not mean Tuesday lunch got busier — it means one discrete event consumed several hours of oven time. Pull known catering out of the trailing average and staff it as its own line item, or your daypart numbers will be permanently distorted.
Other counter-service formats — sandwich shops, taquerias, bakeries, coffee — use the identical division with different ceilings. A bakery is oven-constrained like pizza; a coffee shop is espresso-machine and barista-station constrained. Bowling alleys, car washes, and small retail all run the same calculation against their own throughput limits. The structure travels; only the ceiling changes.
The upstream effect on menu design is the part owners rarely anticipate. Once you staff to gross profit, low-margin high-labor items reveal themselves immediately, because they consume the headcount they justify and then some. Some shops respond by repricing, some by simplifying the item, some by removing it. Any of those beats carrying it invisibly.
The downstream effect on hiring is equally real. When you know Friday dinner needs 12 and Monday lunch needs 3, you know exactly what shape of roster you need — a small core of full-time people covering the reliable base and a flexible pool covering the peaks. That is a hiring plan, not a guess, and it makes turnover far less disruptive because you know precisely which slot opened up.
Related questions
How often should I re-run the gross-profit calculation?
Quarterly for a stable shop; at every season change for anything near a campus, beach, or stadium. Compare predicted headcount to actual gross profit weekly — that fifteen-minute check catches drift long before the quarterly re-derivation does.
What if my point-of-sale cannot report gross profit by daypart?
Export sales by category and daypart, then apply a theoretical food-cost percentage per category in a spreadsheet. It is less precise than true cost-of-goods but perfectly usable, as long as you apply the same method every period so the trend stays comparable.
Should delivery drivers use the same per-person target as cooks and servers?
No. Drivers are constrained by orders per hour and round-trip time, not dollars per shift. Compute driver count from projected delivery orders divided by realistic runs per hour, then check the total driver cost against delivery gross profit separately.
How do I set the per-person target for a brand-new restaurant with no history?
Use a comparable local operation's published benchmarks or an industry range as a starting estimate, run it for six to eight weeks, then re-derive from your own actuals. Treat the initial number as explicitly provisional and tell the crew so.
Does this method work if I mostly run third-party delivery orders?
Yes — better than revenue-based methods, in fact. Marketplace commissions of 20–30% compress margin severely, and gross profit is the only common metric that sees that compression automatically and shrinks the headcount those orders justify.
FAQ
What is a reasonable per-person gross-profit target for a pizza shop?
There is no universal number, and any figure quoted without your cost structure behind it is guesswork. Derive it from your own trailing data: total gross profit for a period divided by total shifts worked in that period gives you the current average, and your target should sit at or slightly above it. Set it with your kitchen manager and front-of-house lead so it survives the first argument about whether it is fair.
Why not just hold labor to a percentage of sales like everyone else?
Labor percentage is a rearview measurement — it resolves after the sales arrive, so it cannot tell a manager how many cooks to schedule next Tuesday. It is also margin-blind: a discount-heavy shift and a full-price shift can post identical percentages while earning very different money. Gross-profit division is computable in advance and automatically accounts for margin.
How do I handle a shift where the math says four people but I only have three trained?
Schedule the three, extend your quoted ticket times, and treat the gap as a hiring signal rather than a scheduling problem. Applying a competency multiplier — weighting newer staff below 1.0 — makes this visible before the shift instead of during it. Chronically unfillable shifts mean your roster shape is wrong, not your math.
Will this method reduce my labor cost?
Sometimes, but that is not the main benefit. Most shops find they are simultaneously overstaffed on slow dayparts and understaffed during peaks, and fixing the peak usually costs more in wages while earning considerably more in captured revenue. The reliable win is a schedule you can defend line by line and a crew that knows the standard.
Do I need scheduling software to run this?
No. The calculation runs in a spreadsheet, and the output is a headcount per shift that you can publish through whatever tool your crew already uses. Software helps most with the timing half — reading point-of-sale ticket curves and staggering starts — and with keeping labor visible against sales during the shift itself. Start free, upgrade when the manual work becomes the bottleneck.
How does this connect to RevOps thinking generally?
It is the same forecast-to-actual discipline a revenue team runs on pipeline, applied to labor: define the unit of production, set a per-unit target, compute the resource requirement forward, then close the loop weekly against actuals. Restaurants get faster feedback than sales organizations do, because the data arrives nightly rather than quarterly.
Sources
- National Restaurant Association — industry operations research: https://restaurant.org/
- U.S. Bureau of Labor Statistics — Food Services and Drinking Places employment data: https://www.bls.gov/iag/tgs/iag722.htm
- U.S. Department of Labor — Fair Labor Standards Act overtime rules: https://www.dol.gov/agencies/whd/overtime
- U.S. Small Business Administration — managing business finances: https://www.sba.gov/business-guide/manage-your-business
- Harvard Business Review — operations and workforce management: https://hbr.org/
- Nation's Restaurant News — restaurant industry reporting: https://www.nrn.com/
- Restaurant Business Online — operator-focused analysis: https://www.restaurantbusinessonline.com/
- QSR Magazine — quick-service and pizza segment coverage: https://www.qsrmagazine.com/
Related on PULSE
- [How Many Staff Should I Schedule Each Shift at My Sushi Restaurant?](/knowledge/tl0094)
- [How Many Employees Should I Schedule Each Shift at My Korean BBQ Restaurant?](/knowledge/tl0455)
- [How Many Employees Should I Schedule Each Shift at My Hot Pot Restaurant?](/knowledge/tl0454)
- [How Many Employees Should I Schedule Each Shift at My Vegan Restaurant?](/knowledge/tl0459)
- [How Many Staff Should I Schedule Each Shift at My BBQ Restaurant?](/knowledge/tl0093)
- [How Many Employees Should I Schedule Each Shift at My Pottery Studio?](/knowledge/tl0481)
@Kory-White- · if Venmo asks, the last 4 of my number are 2012
 pulse-toolsHow do I calculate the ramp-up time before a fractional CRO starts moving pipeline metrics in 2027?
 pulse-toolsHow do I find a fractional CRO who can also cover interim VP of Sales duties in 2027?
 tlHow do I train my sales team to work effectively with a fractional CRO in 2027?
 pulse-toolsHow Many Employees Should I Schedule Each Shift at My Bowling Alley?
 pulse-toolsHow do I calculate the total cost of a fractional CRO engagement over 12 months in 2027?
 pulse-toolsHow do I evaluate a fractional CRO's cultural fit with my leadership team in 2027?
 pulse-toolsHow Many Employees Should I Schedule Each Shift at My Deli?
 pulse-toolsHow do I calculate the right team size for a fractional CRO engagement in 2027?
 pulse-toolsWhere do I find a fractional CRO for a hospitality and restaurant group in 2027?
 pulse-toolsHow do I determine the right equity or profit-sharing structure for a fractional CRO in 2027?