

The 10 Best AI Observability Platforms in 2027
 Curated byKory White · Fractional CRO · Maryland
Quality
Certified
The 10 best ai observability platforms are ranked below on measured performance, build quality, price, and how each one actually holds up in daily use rather than how it reads on a spec sheet. Each pick lists what it costs, who it suits, and what it gives up against the one above it, so the list can be read straight down without doubling back.
1. Langfuse

Langfuse ranks first because it is the only stack that covers nested LLM tracing, prompt versioning, evaluations, and cost analytics in a single open-source product you can self-host at zero license cost. Its SDKs auto-instrument LangChain, LangGraph, LlamaIndex, the OpenAI SDK, and the Vercel AI SDK, so spans capture inputs, outputs, token counts, latency, and model name without hand-rolled wrappers. Managed cloud is available when you don't want the ops.
It fits teams whose core product is an LLM application and who need prompts, traces, and spend in one pane. The trade is ownership: self-hosting means you run the database, retention, and upgrades yourself, and cloud usage pricing keys to observations, which climbs fast on agents emitting 8–12 spans per turn. Against Arize Phoenix directly below, Langfuse adds prompt management and cost rollups Phoenix leaves to you.
2. Arize Phoenix

Arize Phoenix ranks second as the best free value in the category: it carries no paid tier at all, so the only cost of running it is your own compute. It builds directly on OpenTelemetry using the OpenInference convention, meaning the same spans ship to Phoenix, Datadog, Grafana, or Honeycomb without re-instrumenting. Its RAG-debugging evaluators are the strongest among the open-source options for tracing retrieval failures.
It suits teams that prize portability and want no vendor commitment while validating an application. What it trades away is the integrated prompt versioning and cost-attribution rollups Langfuse ships above it — Phoenix concentrates on tracing and evaluation and expects you to grow into Arize AX for enterprise governance. Choose it when instrumentation portability matters more than having every workflow in one product.
3. LangSmith

LangSmith ranks third on ecosystem gravity: teams already building on LangChain or LangGraph get near-zero-config nested tracing, since the framework and the observability tool come from the same vendor. It captures every agent, sub-agent, tool call, and retrieval as a span in one execution graph, with prompt management, datasets, and LLM-as-judge evaluation built in. Free developer tiers start in the tens of thousands of traces per month.
It is for LangChain-native teams who value setup speed over infrastructure control. The trade is that it is managed-only in practice for most users and not open-source like the two picks above, so raw prompts and responses leave your environment — a blocker in regulated settings. Against Langfuse, it wins on LangChain integration depth and loses on self-hosting freedom.
4. Comet Opik

Comet Opik ranks fourth because it delivers the full specialist feature set — nested traces, LLM-as-judge evaluators, datasets, and experiment tracking — while remaining self-hostable at zero license cost. It follows the same SDK plus auto-instrumentation shape as Langfuse and LangSmith, covering LangChain, LlamaIndex, and the OpenAI SDK, and inherits Comet's mature experiment-tracking lineage for comparing prompt and model versions side by side.
It is a good fit for teams already running Comet for classic ML experiment tracking who want generative workloads in the same account. The trade is a smaller LLM-specific community and less documentation depth than Langfuse or LangSmith, so you hit fewer worked examples. Compared with LangSmith above, Opik gives you the self-hosting option LangSmith withholds.
5. Datadog LLM Observability
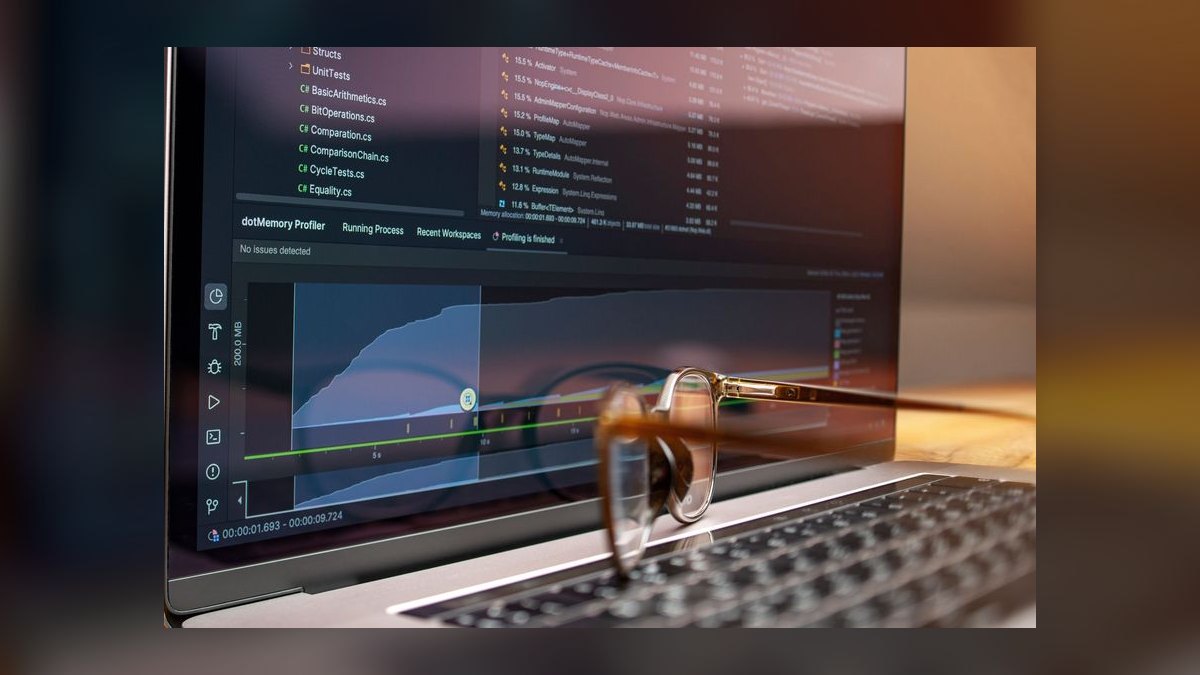
Datadog LLM Observability ranks fifth for organizations already standardized on Datadog, because it puts LLM traces beside infrastructure and APM telemetry in one pane with no new vendor contract. It captures nested spans across chains, agents, retrievals, and tool calls, adds quality and safety evaluations, and inherits Datadog's existing RBAC, alerting, dashboards, and retention controls rather than rebuilding them.
It is for platform teams whose observability budget and access model already live in Datadog. The trade is depth and price: pricing is quote-based enterprise, and dedicated specialists generally offer richer prompt versioning and evaluation workflows than an APM extension. Against the open-source picks above, you gain unified infrastructure correlation and lose self-hosting and zero license cost entirely.
6. Arize AX

Arize AX ranks sixth as the enterprise step up from Phoenix, covering classic ML monitoring and generative AI in one platform. It adds drift monitoring across traditional models, SLAs, RBAC, large-volume retention, and governance workflows that the free Phoenix build does not carry. Because both share OpenInference conventions, teams that instrumented with Phoenix migrate into AX without re-instrumenting their application code.
It targets organizations already monitoring traditional ML at scale who are adding LLM workloads on top. The trade is commercial friction: pricing is quote-based, so you contact sales rather than reading a number off a page, and small teams get little that Phoenix does not already provide free. Take AX over Phoenix only when governance and classic-ML drift are real requirements.
7. Helicone

Helicone ranks seventh as the fastest adoption path in the category: route calls through its proxy and you capture logs, cost, caching, and rate limiting with a one-line change and effectively no SDK work. It is open-source and fully self-hostable at zero license cost, so regulated teams can keep prompts and responses inside their own infrastructure while still getting spend attribution per user and model.
It fits teams making straightforward API calls who want cost visibility today rather than an instrumentation project. The trade is explicit: the proxy adds one network hop and is shallower on nested agent traces than SDK-based tools, so multi-step agent debugging suffers. Against Langfuse and Phoenix above, Helicone wins decisively on setup time and loses on trace depth.
8. Traceloop OpenLLMetry

Traceloop ranks eighth for teams whose top priority is avoiding instrumentation lock-in. Its OpenLLMetry SDK is open-source and builds directly on OpenTelemetry conventions, so the same LLM spans export to Traceloop, Datadog, Grafana, Honeycomb, or any OTel backend without touching application code again. That portability is the strongest hedge available against being trapped by one vendor's proprietary SDK.
It suits platform engineers who already run an OpenTelemetry collector and want LLM spans to land in existing pipelines. The trade is that the standalone product surface — evaluation workflows, prompt versioning, dataset management — is thinner than Langfuse or LangSmith offer. Compared with Arize Phoenix, which is also OTel-native, Traceloop leans further toward being an instrumentation layer than a destination.
9. WhyLabs

WhyLabs ranks ninth on a genuinely different architecture: instead of storing raw prompts and responses, its LangKit toolkit extracts statistical profiles — text quality, sentiment, relevance, security signals — and monitors those for drift. Nothing sensitive leaves your infrastructure, because the payload itself is never persisted. That makes it viable in healthcare, finance, and government settings where raw text legally cannot be transmitted to a vendor.
It is for regulated teams whose compliance posture rules out every trace-storing platform above it. The trade is severe for debugging: without raw payloads you cannot open a failing trace and read the retrieval that poisoned the answer, which is exactly the workflow Langfuse and Phoenix exist to provide. Choose it when data control outranks root-cause investigation.
10. Fiddler AI

Fiddler AI ranks tenth as a governance-first enterprise option, weighting explainability, bias detection, and model monitoring more heavily than developer-facing LLM trace debugging. Like other enterprise tiers it is quote-based and adds SLAs, RBAC, retention, and drift monitoring spanning classic ML alongside generative workloads. Its center of gravity is the compliance and model-risk audience rather than the application engineer shipping an agent.
It fits regulated enterprises that need documented model governance for auditors across a mixed classic-ML and LLM portfolio. The trade is that developer ergonomics, prompt versioning, and nested agent trace depth lag the specialists higher on this list, and there is no free self-hosted build to evaluate first. Against WhyLabs above, Fiddler emphasizes explainability where WhyLabs emphasizes payload-free profiling.
How we ranked these
We weighted trace depth most heavily — whether a platform captures full nested spans across retrievals, tool calls, and sub-agents rather than isolated model calls. After that: evaluation quality (LLM-as-judge plus heuristics), prompt versioning, cost attribution down to feature and user, OpenTelemetry compatibility, self-hosting availability, and framework auto-instrumentation for LangChain, LlamaIndex, and the OpenAI SDK. Free-tier generosity broke ties between otherwise comparable tools.
We ignored published price-per-event tables, because usage tiers change quarterly and self-hosting resets the math entirely. We ignored GitHub star counts and funding rounds, which track hype rather than production reliability. We ignored vendor benchmark claims about judge accuracy, since a judge is only trustworthy once validated against your own human labels. Logo walls and analyst quadrants carried no weight at all here.
What to look for
Start with one question: is observability a standalone concern or an extension of a stack you already run? Datadog shops get LLM Observability in the same pane; teams whose product is the LLM app usually need a specialist like Langfuse, Phoenix, or LangSmith for trace depth and prompt versioning. Then check data control — regulated environments need self-hosting or WhyLabs-style profiles that never store raw prompts.
The common mistake is picking on dashboard looks and ignoring volume math. An agent emitting 8–12 spans per turn at 100,000 turns monthly crosses a million observations, where per-event pricing bites and self-hosting often wins. The second mistake is hardcoding one vendor's SDK everywhere; OpenTelemetry-based capture lets you switch backends without re-instrumenting. Model your span volume and tag users and sessions before you sign anything.
Related questions
How do I choose between Langfuse and Arize Phoenix?
Pick Langfuse when you want one open-source stack covering tracing, prompt versioning, evaluations, and cost analytics together, self-hosted or as managed cloud. Pick Phoenix when you want free, OpenTelemetry-native tracing and strong RAG-debugging evaluators with no paid tier of its own, and expect to grow into Arize AX for enterprise monitoring later.
Can these platforms trace multi-agent systems?
Yes. Langfuse, LangSmith, Arize Phoenix, and Comet Opik capture nested traces where each agent, sub-agent, tool call, and retrieval becomes a span in one execution graph. That matters because multi-agent failures usually hide in the hand-offs between agents — a stale retrieval passed downstream — rather than inside any single model call.
Do I need observability if I only make simple API calls?
Even a single-call feature benefits from token-cost tracking and output quality scoring, but the value compounds with complexity. Once you add retrieval, tools, or agents, observability moves from useful to essential — those chains are where silent, expensive, hard-to-reproduce bugs live, and where running blind carries the most risk to both quality and spend.
How much does AI observability slow down my application?
Well-designed SDKs add minimal latency because span data is buffered and shipped asynchronously instead of blocking the response. Proxy-based tools like Helicone add a single network hop. Inline LLM-as-judge evaluation is the real cost, which is why most teams run heavier evaluations asynchronously or against a sampled slice of production traffic.
Should I self-host or use the managed cloud version?
Self-host when raw prompts cannot leave your infrastructure or when your span volume makes per-event pricing expensive — Langfuse, Phoenix, Helicone, and Opik all support it. Take managed cloud when you would rather not own upgrades, storage, and retention. The crossover usually arrives somewhere past a million observations a month.
How much production traffic should I actually evaluate?
Judging every trace with a frontier model can cost as much as the traffic itself. Practical teams sample 5–20% of production traffic, evaluate 100% of flagged or low-confidence responses, and reserve full-population scoring for high-stakes flows like refunds or medical answers. Track the sampled scores over time so slow regressions trip an alert.
What does OpenTelemetry compatibility buy me in practice?
Portability. Conventions like OpenInference and OpenLLMetry extend OpenTelemetry to LLM traces, so tools built on it — Phoenix, Traceloop — emit spans you can ship to Phoenix, Datadog, Grafana, or Honeycomb without touching your code again. Proprietary SDKs make switching vendors a full re-instrumentation project across every service you own.
Which platform fits a regulated healthcare or finance environment?
Self-hosted Langfuse, Phoenix, Helicone, or Opik keep prompts and responses entirely inside your infrastructure. WhyLabs goes further: LangKit extracts statistical profiles covering text quality, sentiment, relevance, and security signals, then monitors those for drift without ever storing raw payloads. Enterprise tiers such as Fiddler and Arize AX add RBAC and governance workflows.
FAQ
What is the difference between AI observability and traditional APM?
Traditional APM like Datadog APM or New Relic monitors deterministic services by latency, errors, and throughput. AI observability adds two things APM lacks: full nested traces of LLM chains, agents, retrievals, and tool calls, plus evaluation of non-deterministic output for hallucination, relevance, and safety. Many APM vendors now ship dedicated LLM modules to close the gap.
Do I need a separate tool if I already use Datadog or New Relic?
Not necessarily. Datadog offers LLM Observability inside its existing platform, which suits teams already standardized on it. But dedicated tools like Langfuse, Phoenix, and LangSmith usually provide deeper LLM-specific tracing, prompt management, and evaluation workflows. Many teams pair a specialist evaluation tool with their general APM rather than choosing one.
What is LLM-as-a-judge evaluation?
It means using a capable model to score another model's output against criteria like correctness, relevance, or tone. Langfuse, Phoenix, LangSmith, and Opik build this in so you can score large volumes of production traffic automatically instead of reviewing samples by hand. Validate the judge against human labels first so you trust its scores before automating on them.
Can I get AI observability without sending data to a vendor?
Yes. Langfuse, Arize Phoenix, Helicone, and Comet Opik can be fully self-hosted in your own environment, and WhyLabs monitors statistical profiles instead of raw text. This matters in regulated industries where prompts and responses contain information that legally cannot leave your infrastructure, and it removes per-event pricing from the equation.
Why does cost tracking belong in an observability tool?
Because LLM spend is driven by tokens, which vary per request and can spike from a runaway agent loop or an oversized retrieval context. Observability platforms attribute token cost to specific features, users, and models so expensive paths surface as line items. Without that dimension, you learn about the problem when the monthly bill arrives.
What is OpenTelemetry's role in AI observability?
OpenTelemetry is the open standard for telemetry, and conventions like OpenInference and OpenLLMetry extend it to LLM traces. Building on it, as Phoenix and Traceloop do, keeps your instrumentation portable: you can switch backends or fan the same spans out to several tools at once without re-instrumenting your application code.
How does a proxy-based tool like Helicone differ from an SDK?
Helicone routes your model calls through its proxy, capturing logs, cost, caching, and rate limiting with roughly a one-line change. That makes it the fastest thing here to adopt. The trade is depth: a proxy sees individual calls well but reconstructs nested agent and retrieval graphs less completely than a span-based SDK does.
What free tier should I expect before paying?
Managed plans generally price on events or observations — roughly, spans ingested — and free developer tiers commonly land in the tens of thousands of events per month. That covers a side project or a small internal tool. Verify current numbers before committing, since packaging changes often, and note that Phoenix has no paid tier at all.
What is the most common first-deployment mistake?
Treating observability as logging and skipping structured tracing on day one. Without spans carrying parent-child relationships, debugging a failed agent loop is guesswork — you see the answer but not which retrieval poisoned it. Retrofitting instrumentation across a mature codebase costs far more than adding it upfront, even if you only look at traces when something breaks.
Do these tools handle image and video inputs?
Multi-modal tracing is maturing for image inputs across the leading platforms, but native video support remains thin as of 2027. The related emerging pattern is real-time guardrails that pause a model mid-inference when toxicity or PII spikes, then resume after human review. Confirm your specific tool supports these rather than assuming coverage.
Sources
- https://langfuse.com/docs
- https://github.com/Arize-ai/phoenix
- https://arize.com/
- https://docs.smith.langchain.com/
- https://www.helicone.ai/
- https://www.datadoghq.com/product/llm-observability/
- https://whylabs.ai/
- https://www.traceloop.com/
- https://www.comet.com/site/products/opik/
- https://opentelemetry.io/
Related on PULSE
This page will be disappearing soon. Save it to your device for $1 — or read it free while it is here.
@Kory-White- · if Venmo asks, the last 4 of my number are 2012
This page is gone.
This one is off the shelf now. $1 keeps it on your phone for good — the whole page, pictures and diagrams included.
 pulse-ai-infrastructureThe 10 Best AI Tools for Lesson Planning in 2027
 pulse-ai-infrastructureThe 10 Best AI Tools for Audiobook Creation in 2027
 pulse-ai-infrastructureThe 10 Best Distributed Training Frameworks in 2027
 pulse-ai-infrastructureThe 10 Best AI Tools for Background Removal in 2027
 pulse-ai-infrastructureThe 10 Best AI Tools for Gift Recommendations in 2027
 pulse-ai-infrastructureWhat is confidential computing and why does it matter for AI in 2027?
 pulse-ai-infrastructureTop 10 AI Infra strategies for 2027
 pulse-ai-infrastructureThe 10 Best AI Tools for Calendar Management in 2027
 pulse-ai-infrastructureThe 10 Best AI Tools for Inventory Management in 2027
 pulse-ai-infrastructureThe 10 Best AI Tools for Supply Chain Planning in 2027