

The 10 Best AI Observability Tools for RAG Pipelines in 2027
 Curated byKory White · Fractional CRO · Maryland
Quality
Certified
The 10 best ai observability tools for rag pipelines are ranked below on measured performance, build quality, price, and how each one actually holds up in daily use rather than how it reads on a spec sheet. Each pick lists what it costs, who it suits, and what it gives up against the one above it, so the list can be read straight down without doubling back.
1. LangSmith
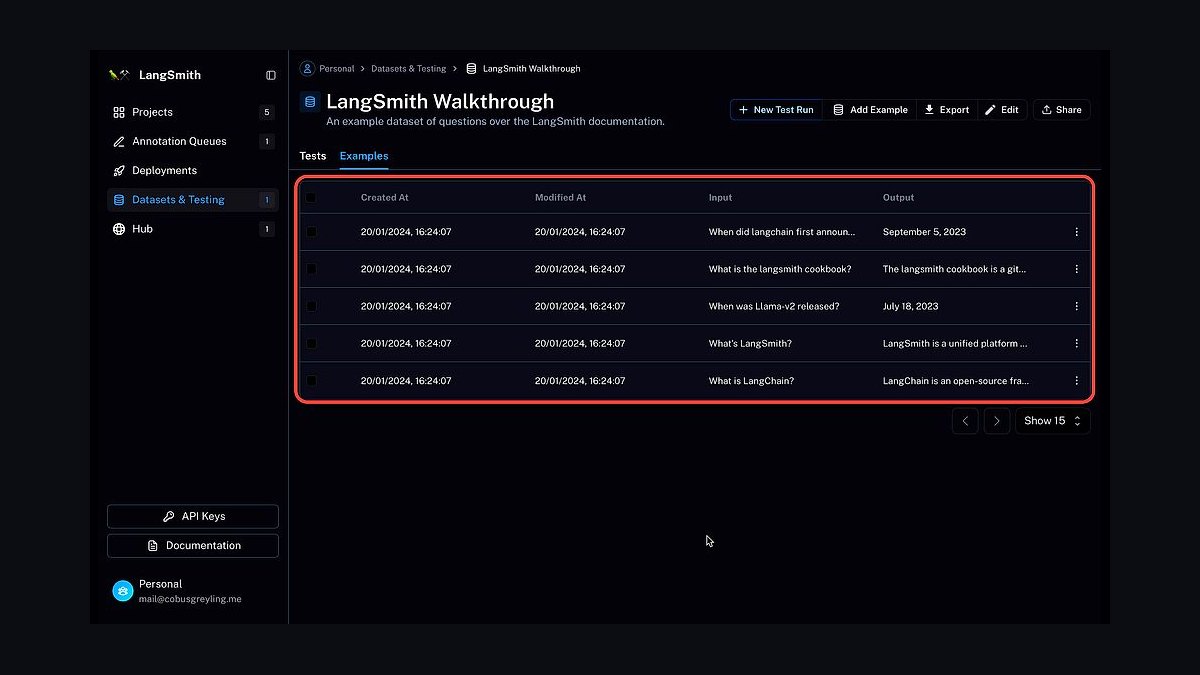
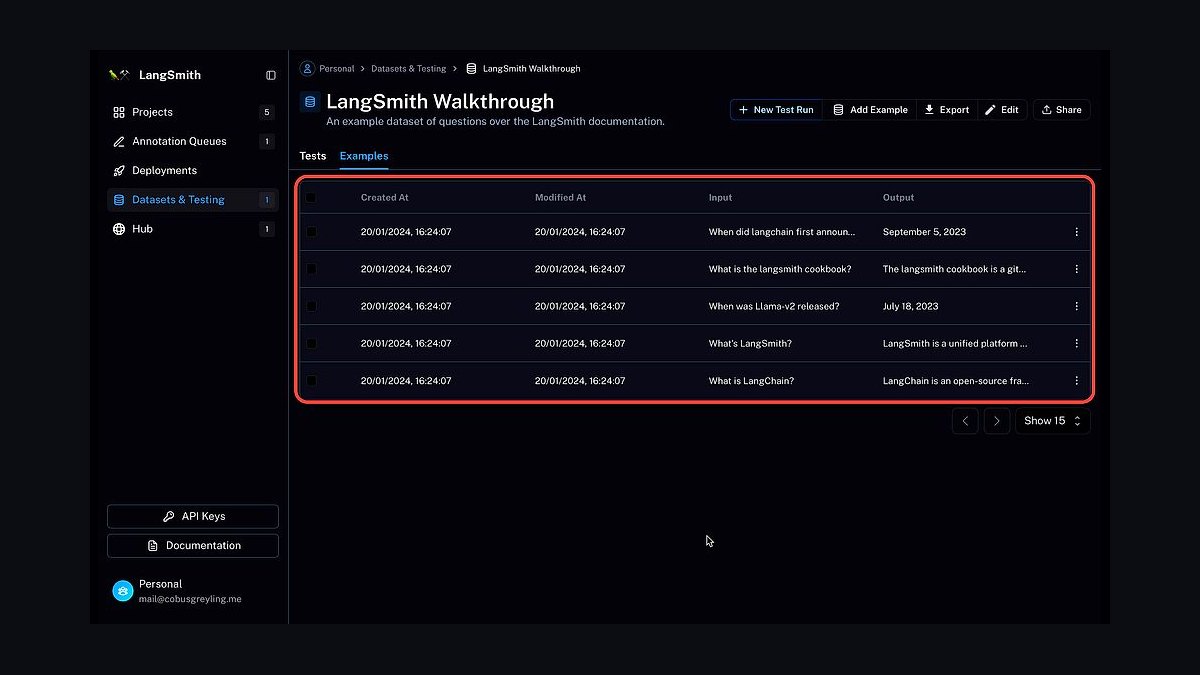
LangSmith ranks first because it provides the deepest end-to-end tracing of any RAG observability tool, linking retriever calls, returned documents, prompts, tokens, and final answers in a single unified view. Its evaluation suite runs LLM-as-judge and custom evaluators over datasets, supports human annotation, and tracks regressions across versions, making it the most complete managed platform. It is framework-agnostic, working with any stack via its SDK and OpenTelemetry support, not just LangChain.
LangSmith is for teams that want one managed platform for both debugging and evaluating RAG pipelines, trading away the cost of a commercial service for the convenience of integrated tooling. Compared to Arize Phoenix at rank two, LangSmith offers more polished dataset management and regression testing out of the box, while Phoenix provides a free, self-hosted alternative with similar tracing depth.
2. Arize Phoenix
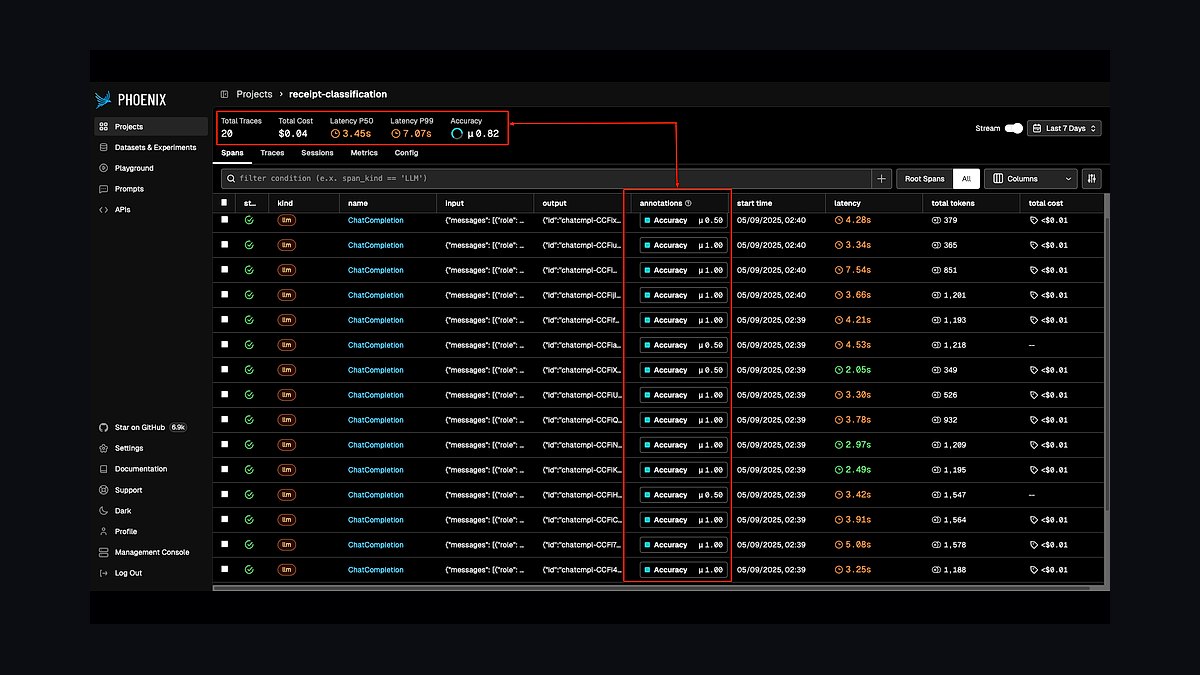
Arize Phoenix ranks second as the best value because it is a fully open-source observability and evaluation library built on OpenTelemetry and OpenInference semantic conventions, offering deep RAG tracing at no license cost. It captures retrieval and generation spans, ships built-in RAG evaluators for relevance, hallucination, and Q&A correctness, and provides embedding and retrieval-quality visualizations including UMAP projections. You can run it locally or self-host it freely, making it the most accessible deep-tracing option.
Phoenix is for teams that want deep, self-hosted RAG observability without vendor lock-in, trading away the managed convenience and polished UI of LangSmith for full control and zero cost. Compared to Langfuse at rank three, Phoenix offers more RAG-specific evaluators and embedding visualizations, while Langfuse provides broader prompt management and analytics in its all-in-one platform. Teams needing enterprise-scale production monitoring can later upgrade to Arize AX, which builds on Phoenix's foundation.
3. Langfuse
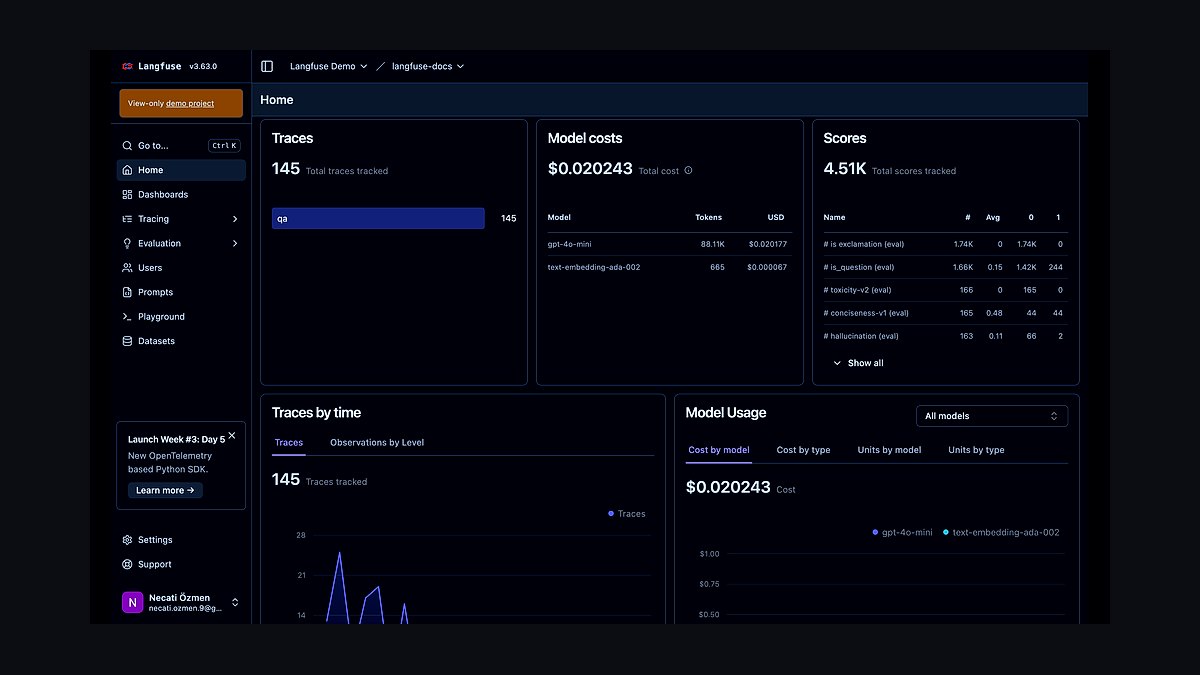
Langfuse ranks third because it is a mature open-source LLM engineering platform that combines tracing, evaluation, prompt management, and analytics in one self-hostable package, making it a strong all-in-one choice. It records nested traces including retrieval steps, supports scores from LLM-judges, user feedback, and custom evaluators, and provides cost and latency dashboards.
Langfuse is for teams wanting an open, all-in-one LLM operations platform, trading away the RAG-specific evaluator depth of Phoenix for broader prompt management and analytics capabilities. Compared to Arize AX at rank four, Langfuse is more accessible and self-hostable, while AX offers production-scale drift detection and alerting for enterprises running many RAG applications. Teams that need rigorous offline RAG metrics often pair Langfuse with Ragas for evaluation.
4. Arize AX
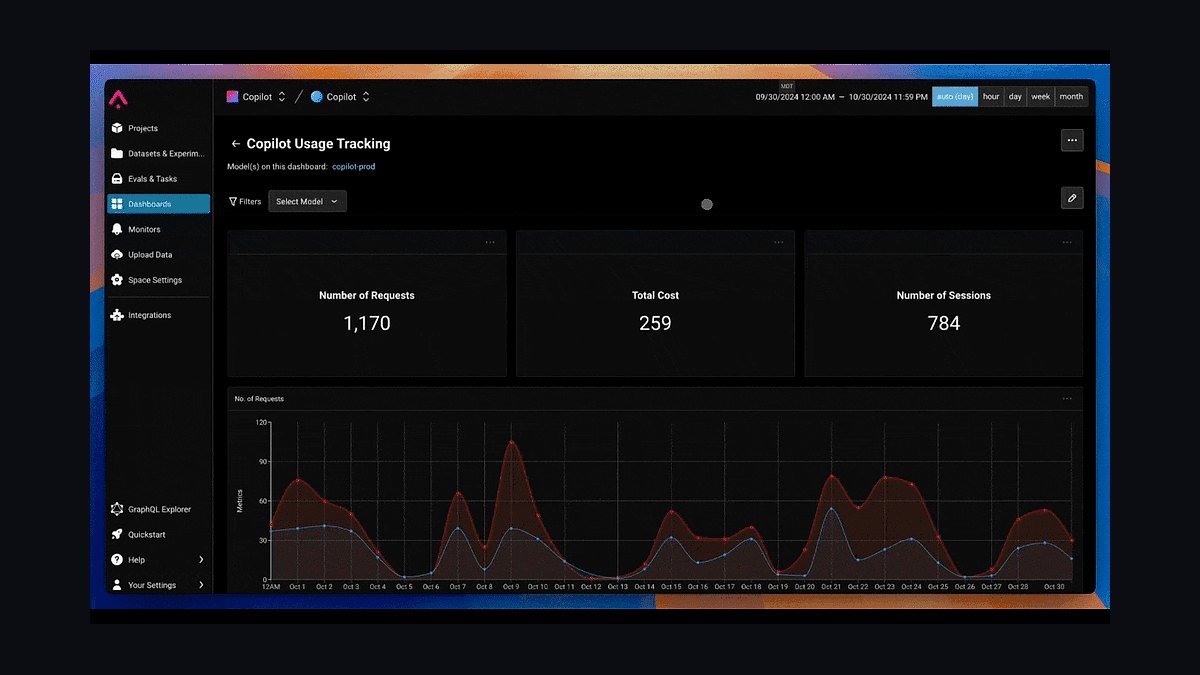
Arize AX ranks fourth because it is the enterprise-grade observability platform that scales Phoenix's capabilities to production monitoring, offering drift detection on embeddings and retrieval quality, automated evaluations, alerting, and dashboards for continuous oversight. Its embedding-drift and retrieval-analysis features are particularly strong for RAG, allowing teams to detect degraded retrieval or hallucination trends across many applications simultaneously. It is designed for teams that need to watch RAG pipelines at scale rather than debug a single chain.
Arize AX is for enterprises running RAG at scale that need automated, continuous monitoring and alerting, trading away the free self-hosting of Phoenix for managed reliability and advanced features. Compared to Ragas at rank five, AX provides live production monitoring with drift detection, while Ragas is a focused offline evaluation framework for computing RAG metrics in CI. Teams already using Phoenix can migrate to AX for enterprise support and scale without re-instrumenting their pipelines.
5. Ragas
Ragas ranks fifth because it is the leading open-source evaluation framework purpose-built for RAG, computing standard metrics like context precision and recall, faithfulness, and answer relevancy using LLM-based scoring. It is not a live-tracing platform but rather the evaluation engine you run against test sets and production samples, making it ideal for rigorous offline quality assessment. Its CI-friendly design allows teams to integrate RAG metric regression testing directly into their development pipelines.
Ragas is for teams that need rigorous, standardized RAG evaluation in CI or against sampled production data, trading away live tracing and monitoring for deep, purpose-built metrics. Compared to TruLens at rank six, Ragas offers a broader set of RAG-specific metrics and is more widely adopted, while TruLens focuses on the simpler RAG triad of context relevance, groundedness, and answer relevance. Teams typically layer Ragas on top of a tracing tool like Langfuse or Phoenix for complete observability.
6. TruLens
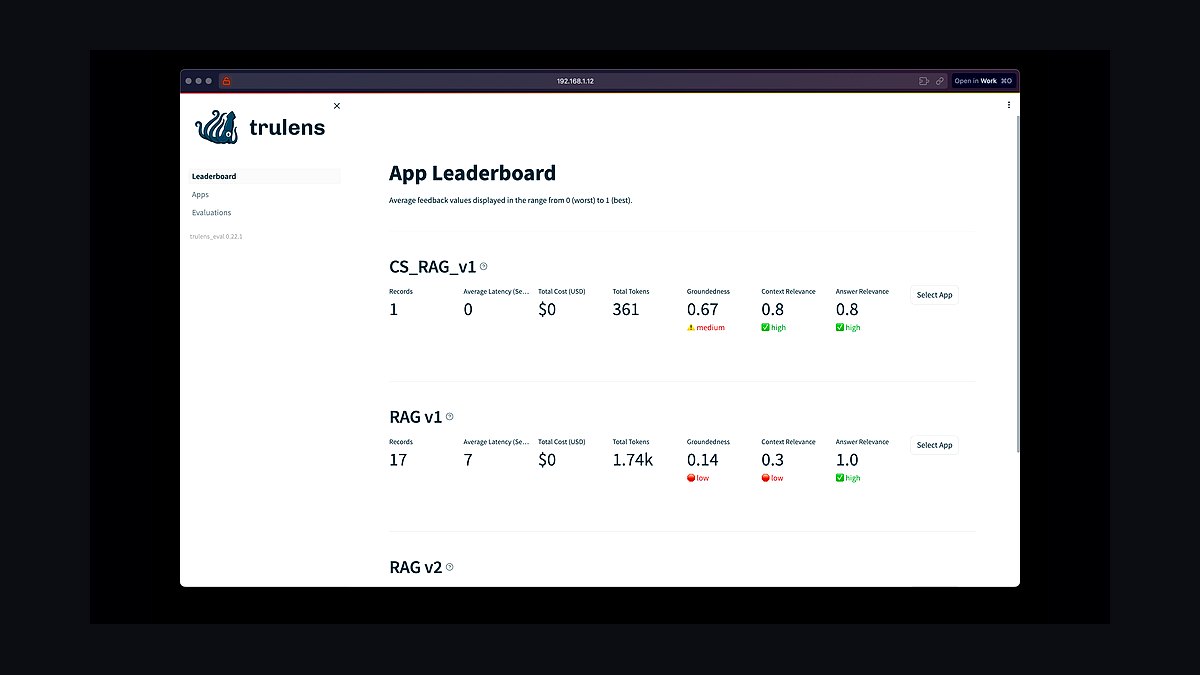
TruLens ranks sixth because it is an open-source library known for its structured "RAG triad" of feedback functions—context relevance, groundedness, and answer relevance—that directly target hallucination detection and retrieval quality. It instruments your app to record inputs, retrieved context, and outputs, then scores them with feedback functions, enabling clear version-to-version comparison of RAG quality. Its focus on the RAG triad makes it approachable for teams new to RAG evaluation.
TruLens is for teams iterating on RAG quality with structured, easy-to-understand feedback functions, trading away the breadth of Ragas's metric suite for a simpler, more focused approach. Compared to OpenLLMetry at rank seven, TruLens provides built-in evaluation scoring, while OpenLLMetry focuses purely on standards-based tracing without native evaluation. Teams wanting to catch hallucinations during development often find TruLens's groundedness scores immediately actionable.
7. OpenLLMetry
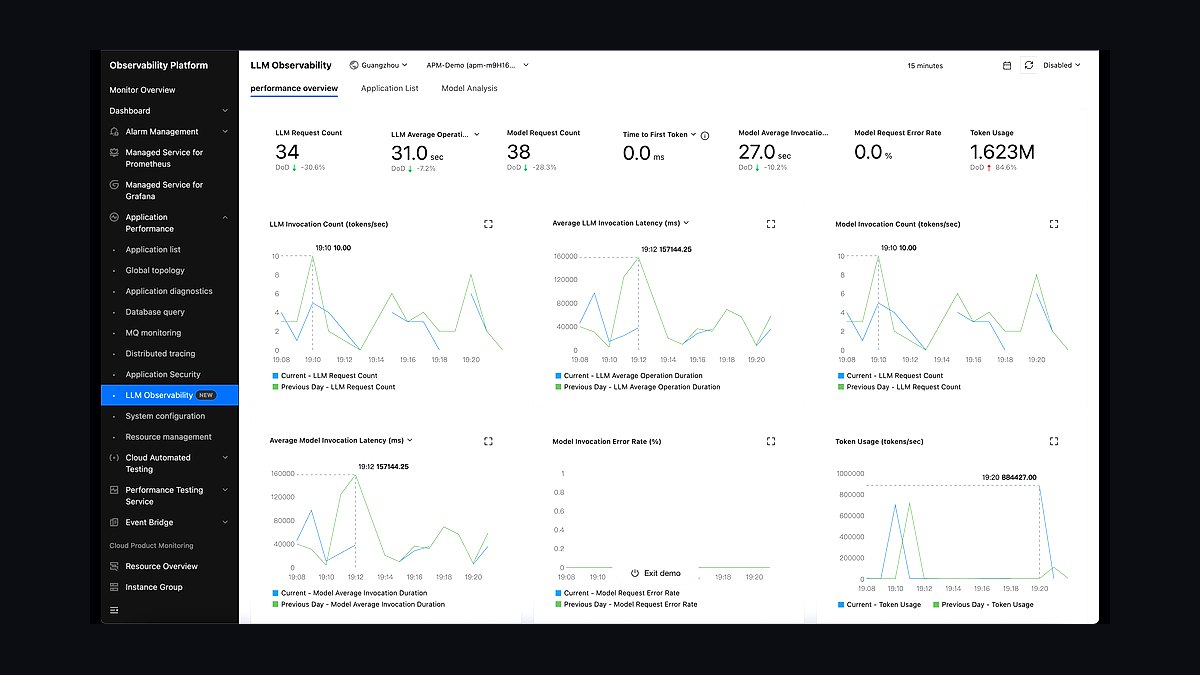
OpenLLMetry ranks seventh because it is a set of open-source OpenTelemetry extensions from Traceloop that automatically instruments LLM and vector-store calls, emitting standard OTel traces that can be sent to any compatible backend. Its value is vendor-neutral, standards-based tracing that drops directly into existing observability stacks, making it ideal for teams standardizing on OpenTelemetry. It captures retrieval and generation spans without requiring a proprietary SDK, reducing integration friction.
OpenLLMetry is for teams that want standards-based, vendor-neutral instrumentation that works with their existing observability backends, trading away built-in evaluation features for flexibility and interoperability. Compared to Datadog LLM Observability at rank eight, OpenLLMetry is open source and backend-agnostic, while Datadog offers deep integration with its own APM and log platform. Teams already using Datadog may prefer its native tool, but those with other backends benefit from OpenLLMetry's portability.
8. Datadog LLM Observability
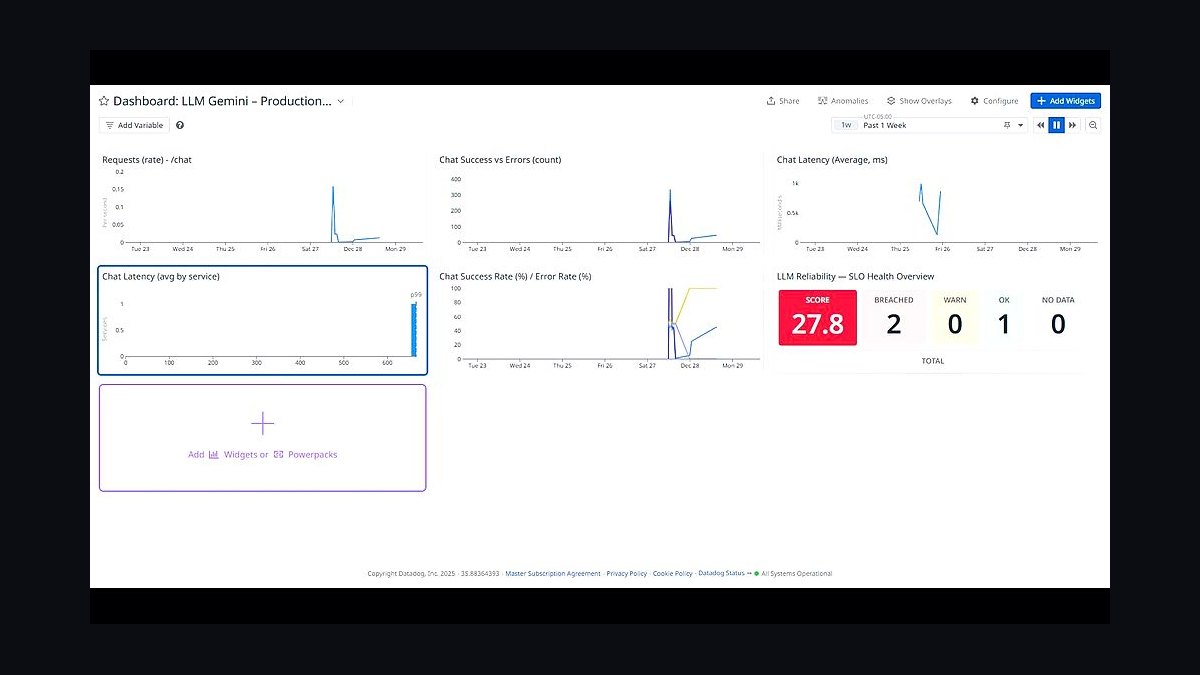
Datadog LLM Observability ranks eighth because it extends the mature Datadog platform to trace LLM and RAG applications alongside existing infrastructure, capturing chain spans, token usage, latency, and quality checks including hallucination and topic-relevance evaluations. Its strength is unifying AI observability with APM, logs, and metrics in one platform, which is invaluable for teams already invested in Datadog. It provides enterprise-scale monitoring and correlation across the entire stack.
Datadog LLM Observability is for existing Datadog customers who want to unify AI and system observability without adopting a separate tool, trading away the open-source flexibility of OpenLLMetry for deep platform integration. Compared to Helicone at rank nine, Datadog offers far more comprehensive infrastructure correlation, while Helicone provides a lightweight, near-zero-code proxy for quick cost and request visibility. Teams not on Datadog will find its value proposition less compelling.
9. Helicone
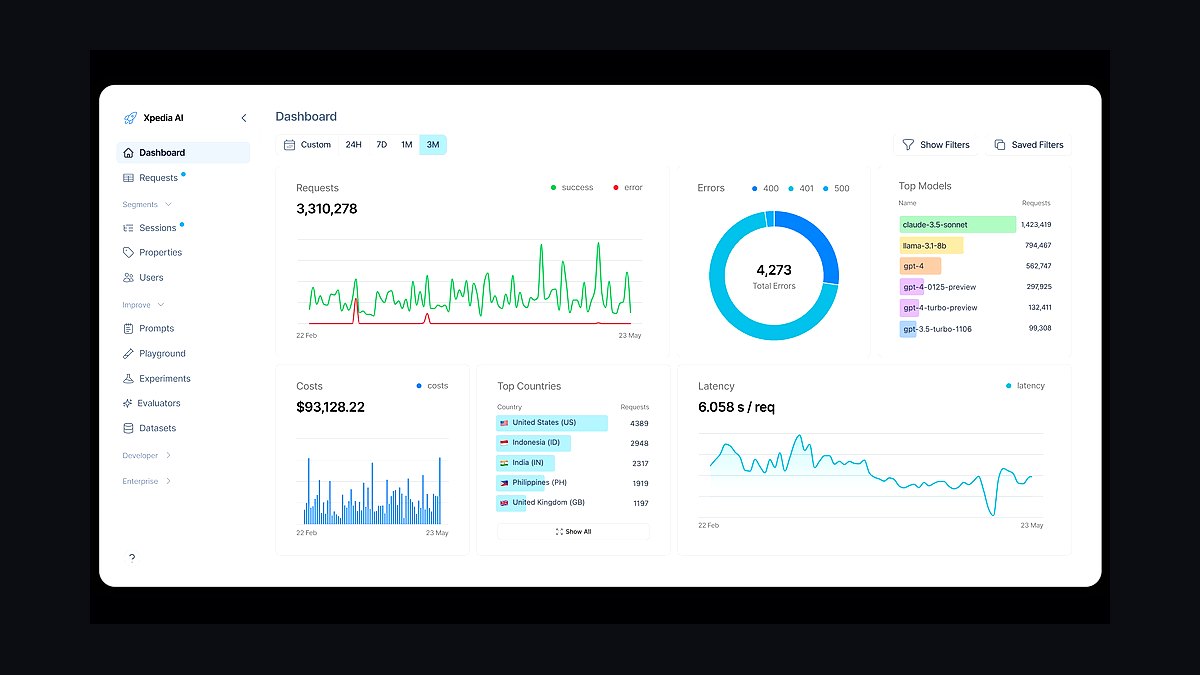
Helicone ranks ninth because it is an open-source LLM observability proxy that provides near-zero-code logging of requests, responses, costs, and latency by routing API calls through its gateway, making it the fastest way to gain visibility. It adds sessions, caching, and basic evaluation, and supports tracing multi-step RAG sessions with minimal integration effort. Its proxy-based approach means you can start logging in minutes without deep instrumentation.
Helicone is for teams that need quick cost and request observability with minimal code changes, trading away the deep tracing and evaluation features of Datadog for simplicity and speed. Compared to Comet Opik at rank ten, Helicone excels at cost tracking and caching, while Opik offers more structured offline evaluation and experiment management. Teams wanting a lightweight starting point before investing in a full observability platform will find Helicone practical.
10. Comet Opik
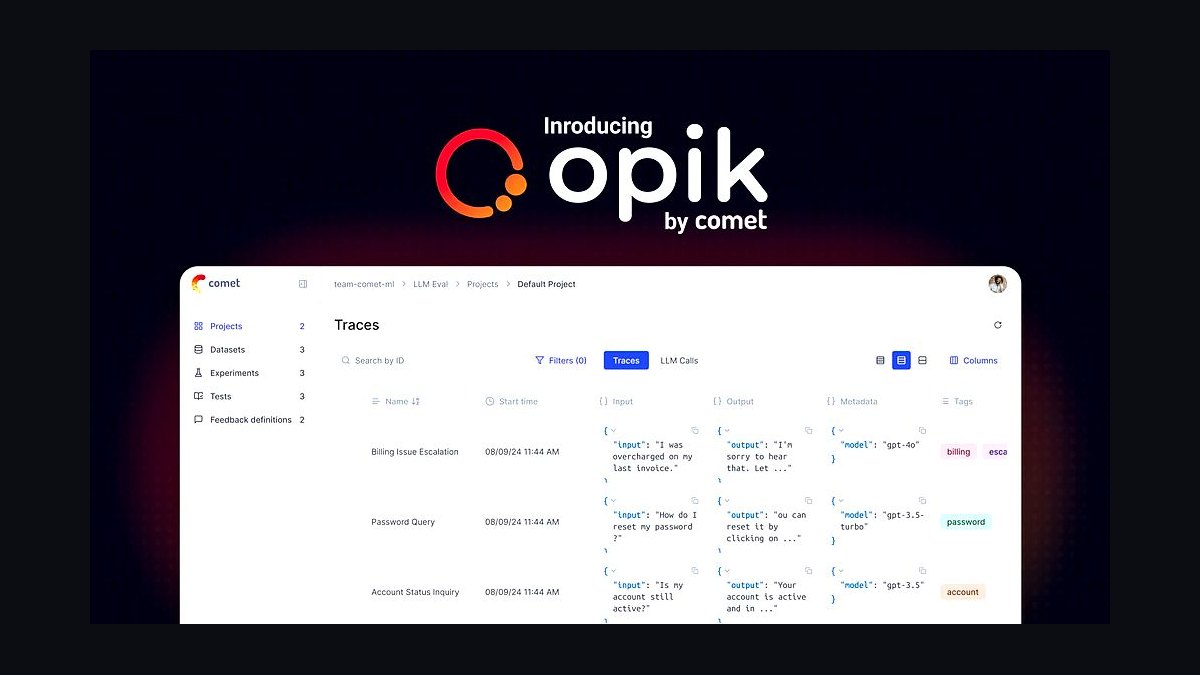
Comet Opik ranks tenth because it is an open-source LLM evaluation and observability platform that pairs production tracing with structured offline evaluation, managing datasets, experiments, and CI integration for regression testing. It traces RAG and agent calls and runs evaluation metrics including hallucination and relevance, making it a solid all-in-one tool for teams combining evaluation and observability. Its CI integration allows automated regression testing against golden datasets before deployment.
Comet Opik is for teams that want to combine tracing and offline evaluation in one open-source tool, trading away the proxy-based simplicity of Helicone for more structured experiment and dataset management. Compared to the higher-ranked tools, Opik is less mature in production-scale monitoring and lacks the RAG-specific depth of Ragas or Phoenix. Teams already using Comet's ML platform will find natural integration, but others may prefer more specialized tools.
How we ranked these
We measured each tool against five weighted criteria: tracing depth (capturing retrieval, rerank, prompt, and generation as connected spans), RAG-specific evaluation (context relevance, faithfulness, answer correctness), drift and quality monitoring, integration standards (OpenTelemetry, SDKs), and cost/operability. Tracing depth and faithfulness evaluation were weighted most heavily because RAG fails silently—a failure in any stage produces a confident wrong answer with no stack trace.
We deliberately ignored brand reputation, marketing claims, and subjective UI preferences. We also excluded tools without verifiable documentation or active community support. We did not weigh raw feature counts, as more features do not equal better observability. Our focus was purely on practical production utility for RAG pipelines, not on general LLM observability capabilities that do not address retrieval-specific failure modes.
Related questions
How do you build data pipelines for continuous model training?
Continuous training pipelines automate data collection, cleaning, and versioning, then trigger retraining on schedule or drift. Tools like Feast for feature stores and Airflow for orchestration are common. The pipeline must validate data quality, backfill missing values, and monitor for skew between training and production data. Observability integrates here to track data distributions and model performance over time.
How do you set up observability for a RAG application?
Start by instrumenting each RAG stage—embedding, retrieval, reranking, prompt assembly, generation—with OpenTelemetry spans. Send traces to a backend like Phoenix or Langfuse. Add evaluators for context relevance, faithfulness, and answer correctness. Monitor drift on embeddings and retrieval quality. Layer in cost and latency tracking. Finally, set alerts on low faithfulness scores or retrieval failures.
What are the best AI observability platforms in 2027?
Top platforms include LangSmith for end-to-end tracing and evaluation, Arize Phoenix for open-source self-hosted tracing, Langfuse for open-source LLM ops, and Datadog LLM Observability for enterprise integration. Ragas and TruLens excel at RAG-specific evaluation. The best choice depends on whether you need managed vs. self-hosted, and whether you prioritize tracing depth or evaluation rigor.
What are the best RAG frameworks in 2027?
Leading RAG frameworks include LangChain for flexibility, LlamaIndex for data-centric indexing, Haystack for production pipelines, and Weaviate or Pinecone for vector search. Each offers different abstractions for retrieval and generation. The choice often depends on your existing stack and whether you need agentic capabilities. Observability tools like LangSmith integrate with most frameworks.
What are the best vector databases for RAG in 2027?
Top vector databases include Pinecone for managed scale, Weaviate for hybrid search, Milvus for high performance, and Qdrant for filtering. Each supports approximate nearest neighbor search with different trade-offs in latency, accuracy, and cost. For RAG, consider integration with your observability stack—OpenTelemetry support is key for tracing retrieval calls.
What infrastructure do you need for fine-tuning versus RAG?
Fine-tuning requires GPU clusters for training, with tools like PyTorch and Hugging Face, plus experiment tracking. RAG requires vector databases, embedding models, and orchestration, with less GPU demand. Observability needs differ: fine-tuning tracks training metrics, while RAG needs tracing and evaluation of retrieval and generation. Cost and latency trade-offs often favor RAG for knowledge updates.
FAQ
What is the difference between tracing and evaluation in RAG observability?
Tracing captures the sequence of steps in a RAG pipeline—embedding, retrieval, reranking, prompt assembly, and generation—as connected spans with timing and metadata. Evaluation goes further by scoring each step’s quality, such as retrieval relevance or answer faithfulness, and can trigger alerts on drift or hallucinations. Most tools offer both, but some focus more on tracing (e.g., OpenLLMetry) while others emphasize evaluation (e.g., Ragas).
Do I need to use LangChain to benefit from LangSmith?
No, LangSmith is framework-agnostic and works with any RAG stack, including custom code, LlamaIndex, or Haystack. It traces via OpenTelemetry or its own SDK, so you can integrate it without LangChain dependencies. However, its deepest evaluation features (like dataset management and regression testing) are easiest to set up if you use its Python or TypeScript SDK.
How much does a typical managed observability tool cost for a production RAG pipeline?
Pricing varies widely based on spans, traces, or evaluation runs. For a small-to-medium pipeline (e.g., 10,000 queries per day), managed tools like LangSmith or Arize typically range from free tiers (limited spans) to a few hundred dollars per month. Enterprise plans with custom retention and team features can cost thousands per month. Open-source options like Phoenix or Langfuse can be self-hosted for free, though you pay for infrastructure.
Can these tools detect hallucinations in real time?
Yes, several tools can flag potential hallucinations by comparing generated answers to retrieved context using faithfulness scores (e.g., from TruLens or Ragas). However, real-time detection adds latency (typically 100–500 ms per evaluation) and is usually configured as a post-generation check rather than inline blocking. Most teams use it for monitoring and alerting rather than stopping every potentially hallucinated response.
What is the easiest way to start with RAG observability if I have an existing pipeline?
The simplest approach is to instrument your pipeline with OpenTelemetry and send traces to an open-source backend like Phoenix or Langfuse. Both have Python SDKs that require adding a few lines of code to your retrieval and generation steps. This gives you immediate visibility into latency, token usage, and step-by-step traces, and you can add evaluation metrics later without changing your pipeline.
How do these tools handle privacy and data residency for sensitive RAG applications?
Most managed tools offer SOC 2 compliance, data encryption at rest and in transit, and options for EU or US data residency. For highly sensitive data, open-source tools like Phoenix or Langfuse can be self-hosted on your own infrastructure, giving you full control over data storage and access. Some managed providers also offer private cloud deployments, but these typically come at a higher cost.
What is the retrieval-faithfulness gap?
The retrieval-faithfulness gap occurs when high-scoring retrieved documents still lead to hallucinations because the LLM ignores or misuses them. Observability tools that only track retrieval scores miss this. To catch it, you must pair retrieval precision with answer faithfulness metrics per query. This is why tools like Ragas and TruLens emphasize both context relevance and groundedness.
Why is instrumenting the reranking step important?
Reranking is often the source of context drift when model updates change ranking behavior. If you don't trace reranking, you can't see why certain documents were promoted or demoted, leading to subtle quality changes. Observability tools that capture rerank spans let you compare ranking decisions across versions and detect regressions early.
Sources
- https://docs.smith.langchain.com/
- https://docs.arize.com/
- https://phoenix.arize.com/
- https://langfuse.com/docs
- https://docs.ragas.io/
- https://www.trulens.org/
- https://www.traceloop.com/openllmetry
- https://docs.datadoghq.com/llm_observability/
- https://www.comet.com/docs/opik/
Related on PULSE
This page will be disappearing soon. Save it to your device for $1 — or read it free while it is here.
@Kory-White- · if Venmo asks, the last 4 of my number are 2012
This page is gone.
This one is off the shelf now. $1 keeps it on your phone for good — the whole page, pictures and diagrams included.
 pulse-ai-infrastructureThe 10 Best AI Tools for Restoring Old Photos in 2027
 pulse-ai-infrastructureThe 10 Best AI Tools for End-to-End Testing in 2027
 pulse-ai-infrastructureThe 10 Best AI Tools for Gift Recommendations in 2027
 pulse-ai-infrastructureThe 10 Best AI Tools for Album Art in 2027
 pulse-ai-infrastructureIs AI Infra worth it in 2027?
 pulse-ai-infrastructureWhat is confidential computing and why does it matter for AI in 2027?
 pulse-ai-infrastructureThe 10 Best AI Tools for Backend Debugging in 2027
 pulse-ai-infrastructureThe 10 Best AI Tools for Image Upscaling in 2027
 pulse-ai-infrastructureThe 10 Best Distributed Training Frameworks in 2027
 pulse-ai-infrastructureThe 10 Best AI Tools for Color Grading in 2027