


The 10 Best AI Infra Cost Benchmarking Tools in 2027
Quality
Certified
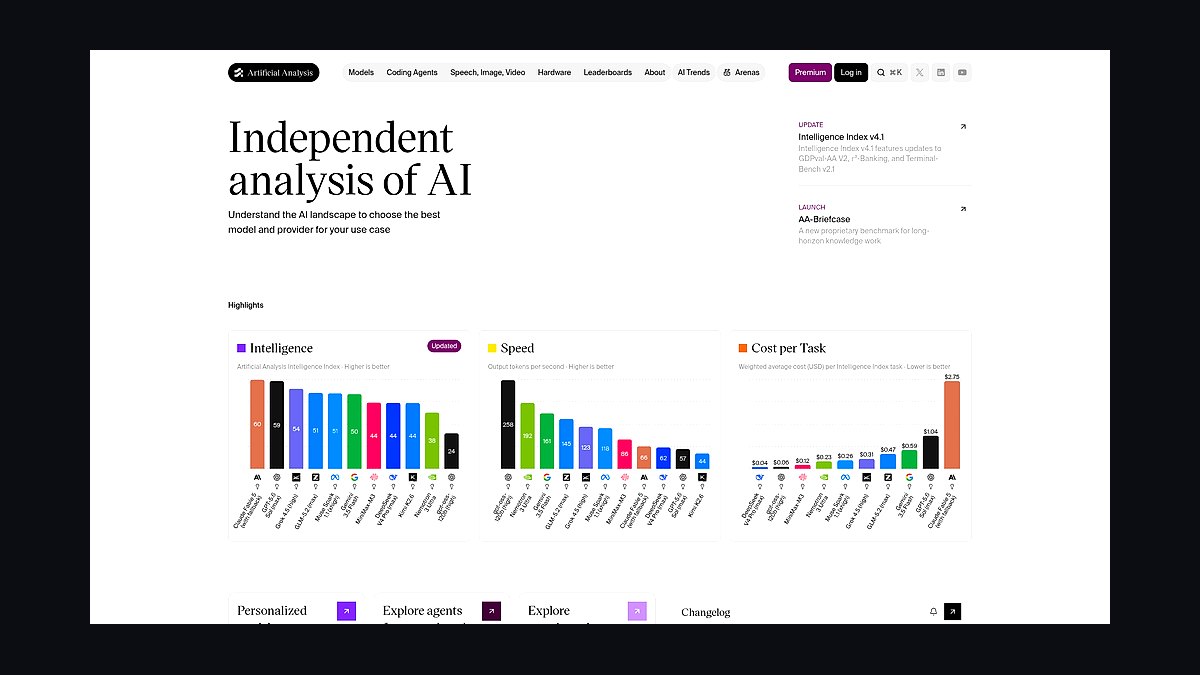
The 10 best ai infra cost benchmarking tools are ranked below on measured performance, build quality, price, and how each one actually holds up in daily use rather than how it reads on a spec sheet. Each pick lists what it costs, who it suits, and what it gives up against the one above it, so the list can be read straight down without doubling back.
1Artificial Analysis
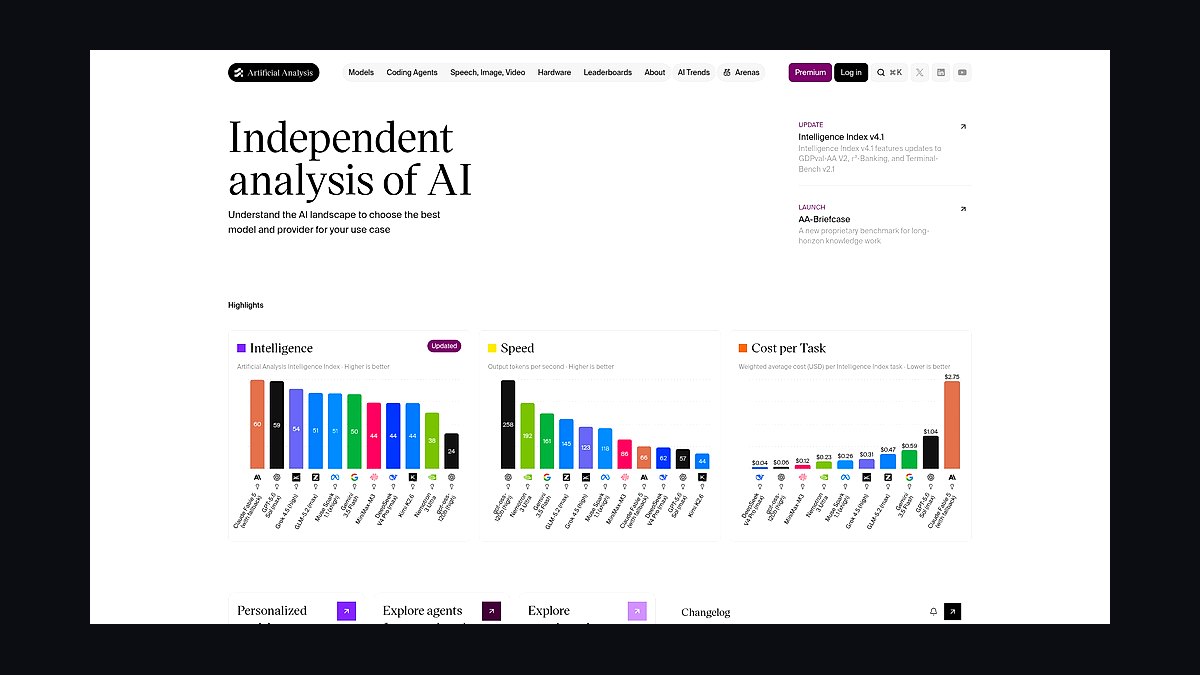
Ranks first because it is the most widely cited independent benchmark comparing AI model providers on price, throughput, and latency side by side. It publishes live leaderboards tracking cost per million tokens across OpenAI, Anthropic, Google, Meta, and dozens of inference hosts. Its methodology re-runs standardized prompts against production APIs rather than relying on vendor-reported numbers. Analysts and engineering teams cite its charts directly when picking a model.
It's built for teams choosing which model API to call, not for tracking a company's internal GPU spend, so it complements rather than replaces a cloud cost tool. It skips historical billing data and cluster-level resource tracking entirely. Compared to Kubecost below, it benchmarks external vendor pricing rather than your own infrastructure utilization, making it the natural first stop before infra-level tools take over.
2CloudZero
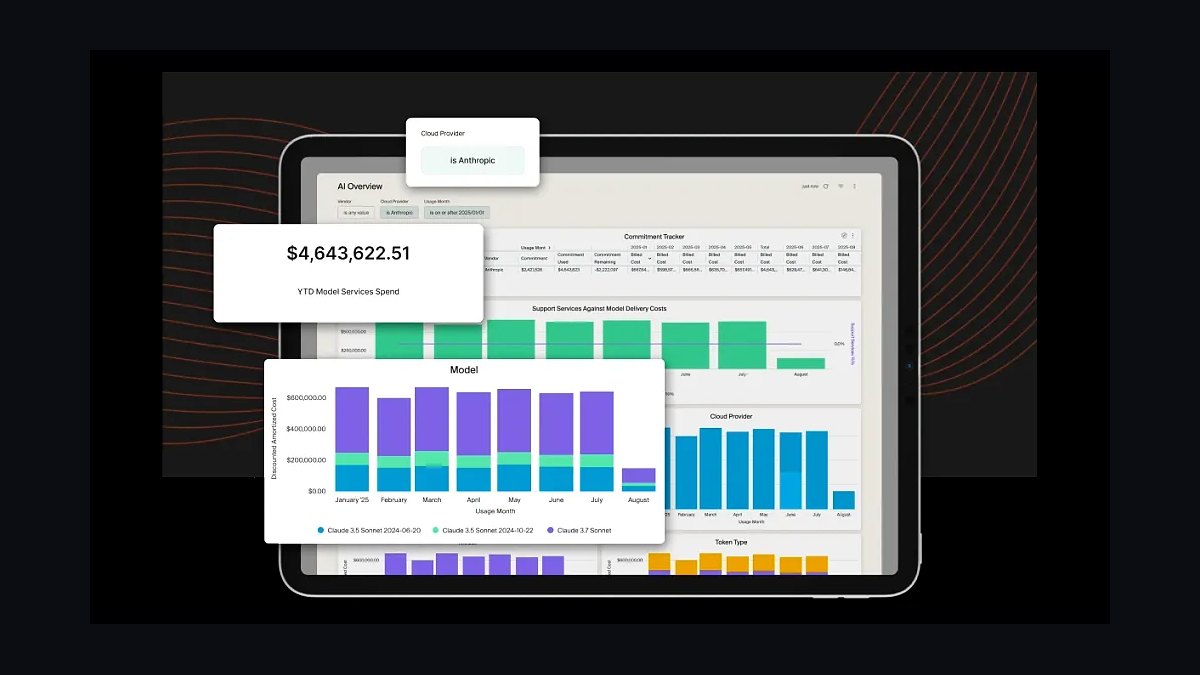
CloudZero ranks second for turning AWS, GCP, and Azure billing data into cost-per-customer and cost-per-feature views, a lens teams need once AI workloads move from experiment to production spend. It ingests the cloud billing export automatically and allocates GPU and inference charges to the teams that generated them. Its anomaly detection flags spend spikes from runaway training jobs within hours rather than at month-end reconciliation.
It suits finance and platform teams who need to explain AI spend to the CFO, not engineers debugging a single cluster's utilization. It doesn't optimize Kubernetes scheduling itself, unlike Kubecost just below it. Where Artificial Analysis compares vendor prices before you commit, CloudZero tracks what you actually spent afterward, making the two natural companions in a FinOps stack.
3Kubecost
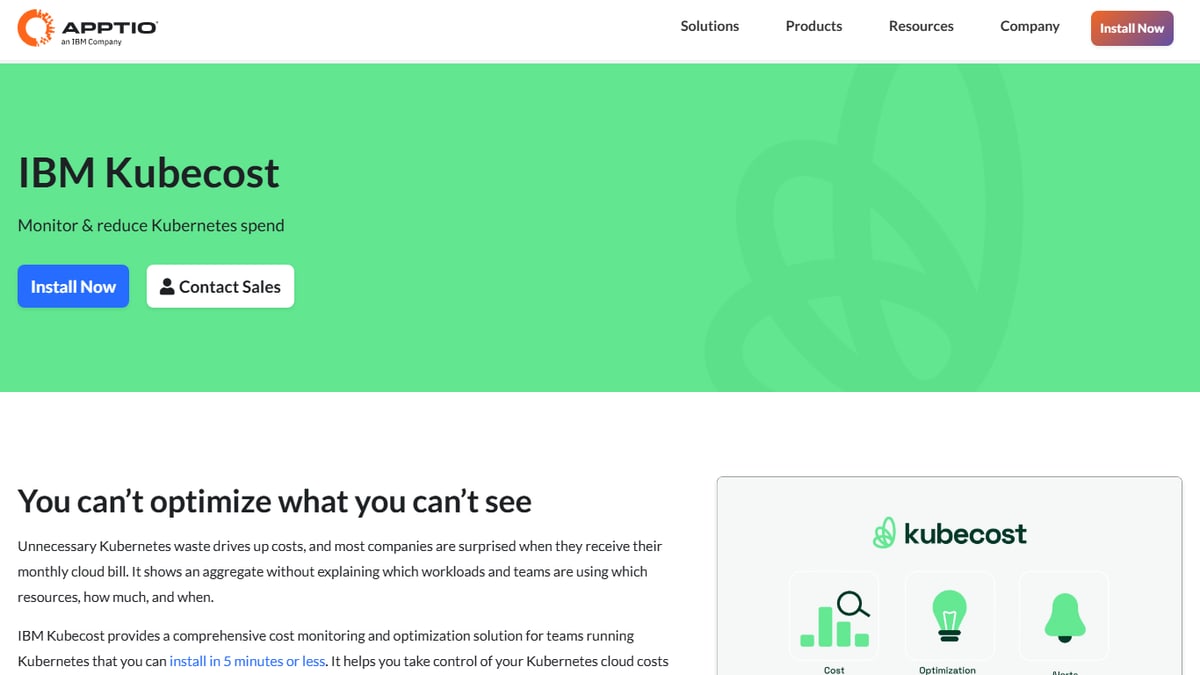
Kubecost ranks third because it is the standard for allocating cost inside Kubernetes clusters, the environment most self-hosted AI training and inference runs on. Built on the open-source OpenCost project it co-created, it breaks down spend by namespace, pod, and GPU node down to the container level. Teams running vLLM or Ray clusters use it to see exactly which model-serving deployment is burning the GPU budget.
It's built for platform engineers operating their own clusters rather than teams buying inference purely through hosted APIs. It requires a running Kubernetes environment to install, so teams on fully managed AI platforms won't get value from it. Unlike CloudZero's company-wide billing view, Kubecost stays scoped to cluster-level resource allocation, trading breadth for granular GPU-node detail.
4Vantage
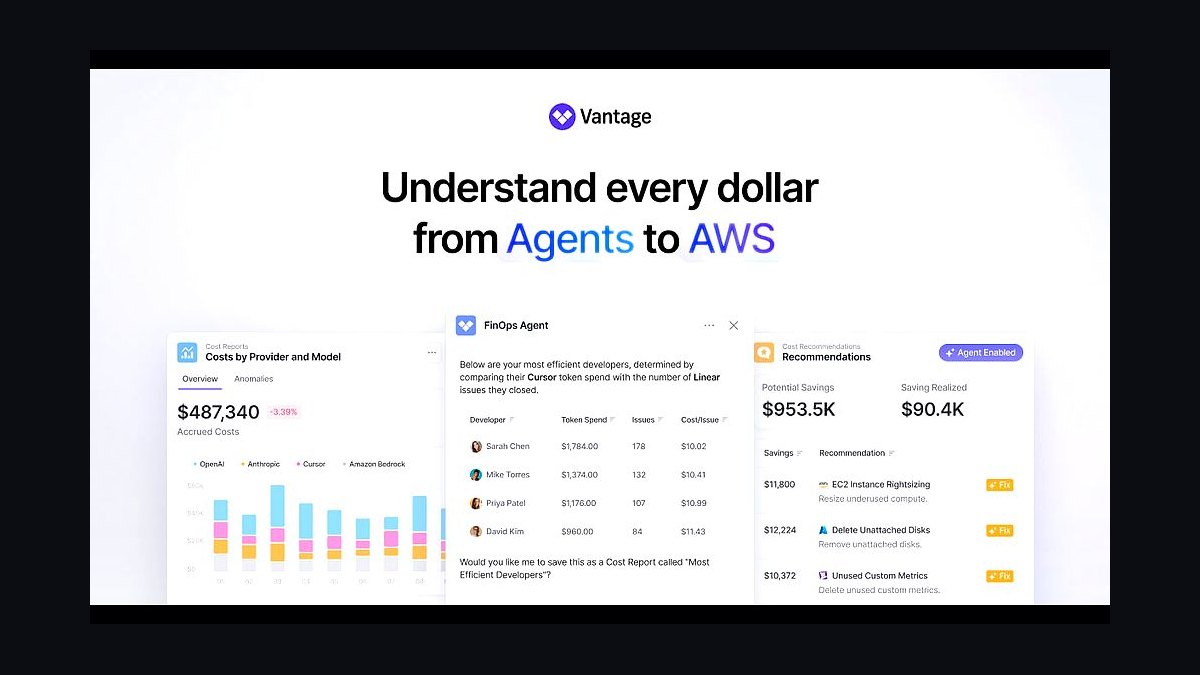
Vantage ranks fourth for its clean multi-cloud cost reporting that added GPU and AI-instance tracking as training and inference spend grew across AWS, GCP, and Azure accounts. Its cost reports let teams group spend by instance type, so an org can isolate what H100 or A100 fleets cost against the rest of the cloud bill. Its API-first design makes it easy to pipe cost data into internal dashboards.
It fits teams that want fast multi-cloud visibility without deploying an agent into every cluster, trading some of Kubecost's pod-level granularity for simpler setup. It doesn't optimize workloads or reduce spend automatically the way CAST AI below does. Compared to CloudZero, Vantage is lighter-weight and quicker to configure, better suited to smaller platform teams than deep enterprise allocation needs.
5CAST AI
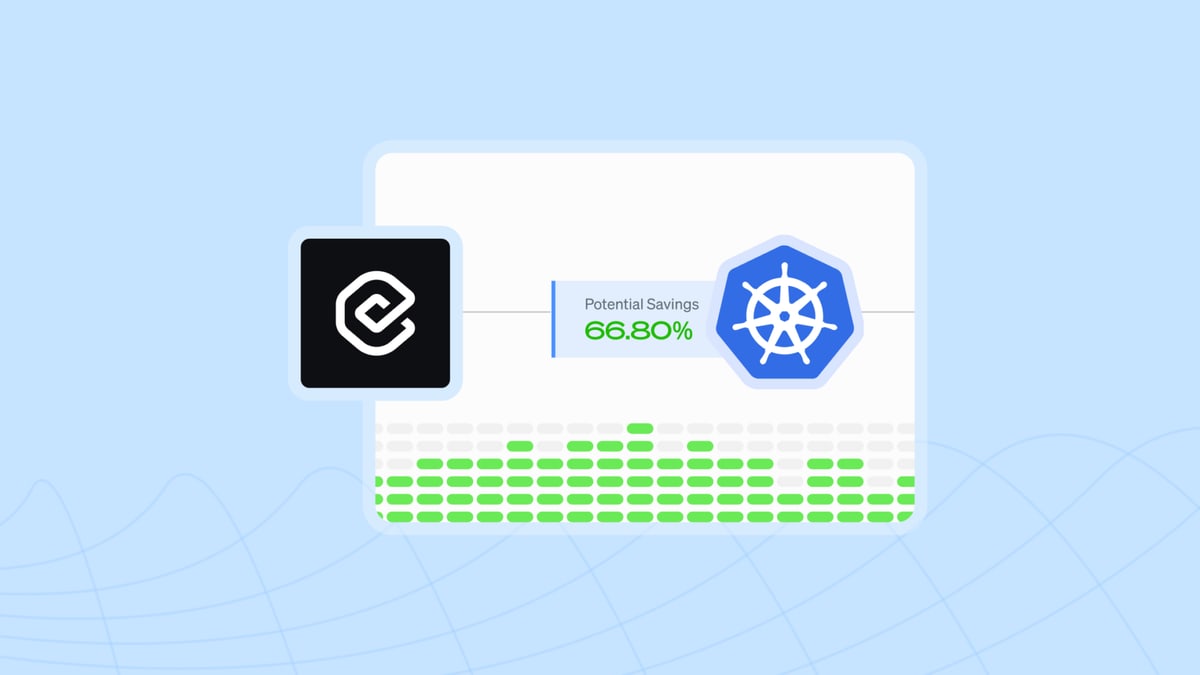
CAST AI ranks fifth because it goes beyond reporting into automated cost reduction, rightsizing and rescheduling Kubernetes workloads including GPU nodes to cut spend without manual tuning. Its autoscaler resizes clusters in real time and its spot-instance automation targets GPU capacity, where price swings are steep. Teams running large-scale training report meaningful cost cuts after letting it manage node selection instead of doing it by hand.
It's aimed at engineering teams comfortable ceding scheduling decisions to automation, a bigger commitment than the read-only visibility tools ranked above it. It works only within Kubernetes, so teams on serverless GPU platforms need a different tool. Where Vantage and Kubecost show you the bill, CAST AI actively tries to shrink it, at the cost of more setup and trust in its automation.
6Finout
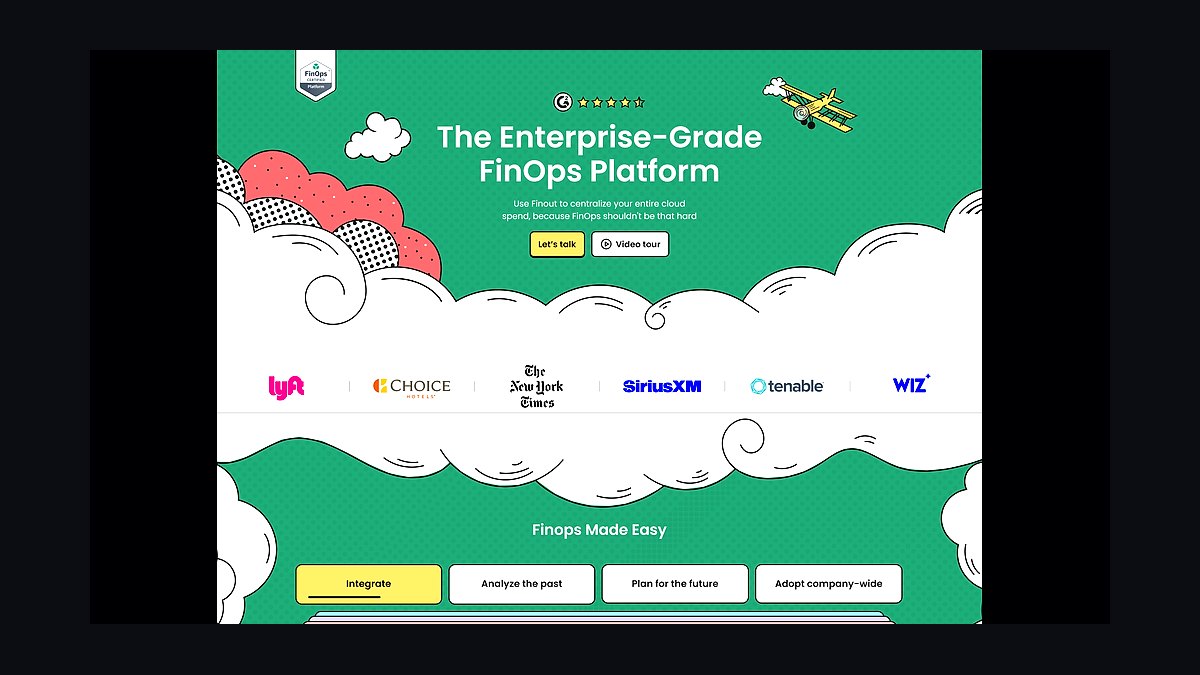
Finout ranks sixth for unifying cloud and third-party SaaS cost data, including line items from AI API vendors like OpenAI and Anthropic, into one FinOps dashboard. It normalizes spend across multiple billing sources so a team can see model API costs alongside the GPU infrastructure that serves self-hosted models. Its virtual tagging lets finance slice spend by product line without engineers pre-tagging every resource.
It's built for FinOps and finance teams tracking blended AI spend across vendor APIs and owned infrastructure, not for engineers optimizing a single cluster's scheduling. It leans on billing exports and integrations rather than live cluster telemetry, so it lags CAST AI and Kubecost on real-time GPU utilization detail. It's a better fit once an org's AI spend spans several vendors, not just one cloud.
7nOps
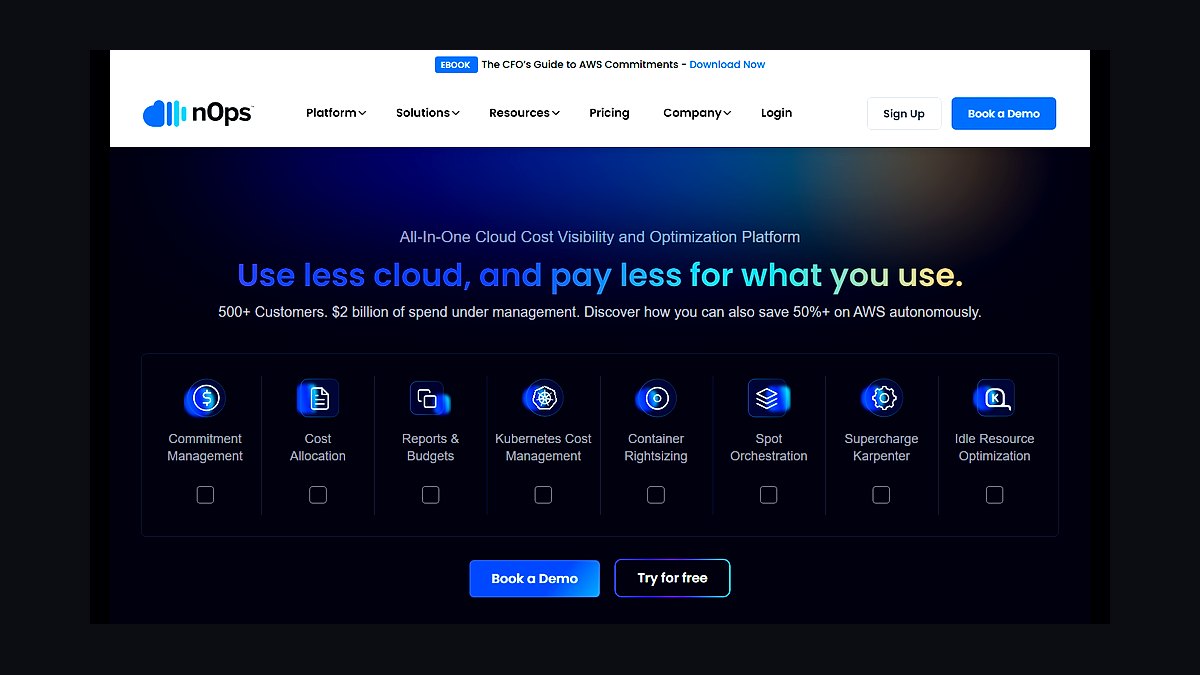
nOps ranks seventh for its AWS-focused automation that layers cost governance and Reserved Instance and Savings Plan management on top of standard billing reports, extended to cover the GPU-heavy EC2 instance families used for AI workloads. Its resource scheduler can power down idle GPU instances outside training windows automatically. It's built specifically for AWS shops rather than multi-cloud environments, which narrows its reach but deepens its automation.
It suits teams whose AI infrastructure lives entirely on AWS and want commitment management handled automatically, a narrower scope than Vantage's multi-cloud reporting above it. It won't help a team split across GCP or Azure. Compared to CAST AI's Kubernetes-native automation, nOps operates at the AWS account and instance level, making it simpler to adopt but less granular for containerized workloads.
8Datadog Cloud Cost Management
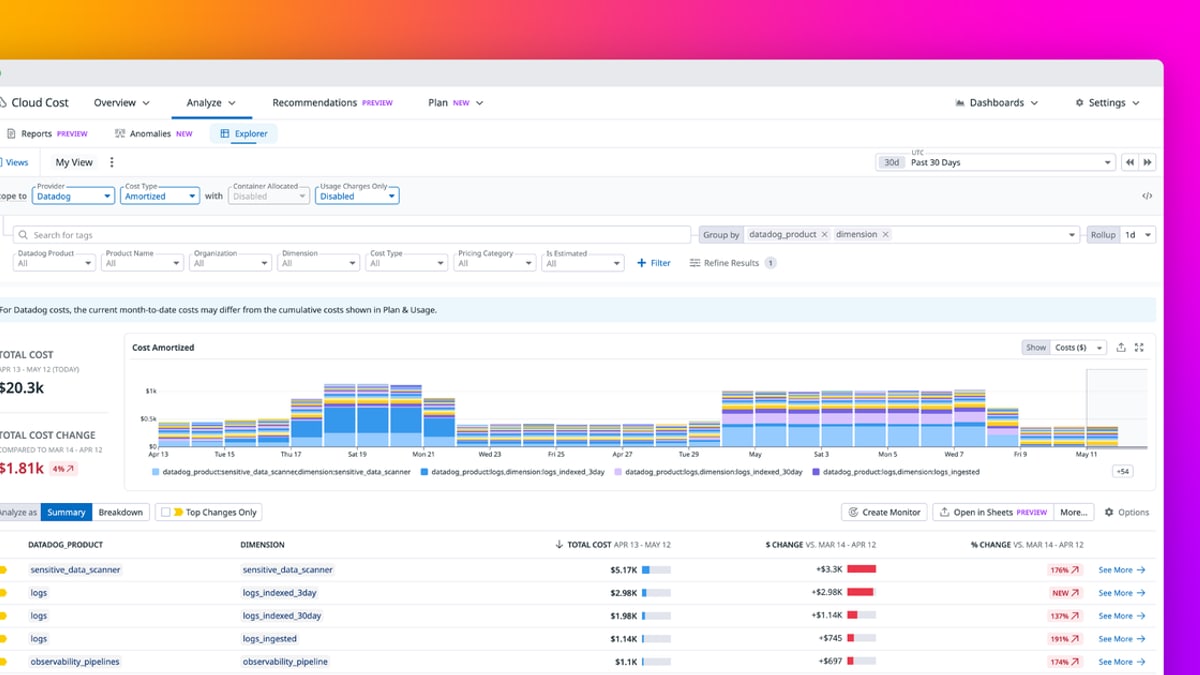
Datadog Cloud Cost Management ranks eighth because it folds cost data directly into the observability platform many AI infrastructure teams already use for monitoring GPU utilization, latency, and error rates. Seeing cost alongside performance metrics in one pane lets engineers correlate a spend spike with the training job or inference endpoint that caused it. It draws on the same tagging teams already use for Datadog's APM and infrastructure monitoring.
It's the right pick for teams already paying for Datadog who want cost as one more panel rather than a dedicated FinOps tool, trading the deep allocation features of CloudZero or Finout for convenience. Standalone cost tracking is not its focus. Compared to Kubecost, it's less granular at the pod level but pairs cost with performance telemetry those dedicated tools don't collect themselves.
9MLCommons MLPerf
MLCommons MLPerf ranks ninth as the industry-standard benchmark suite for measuring AI hardware and software performance, giving teams the throughput-per-dollar baseline needed before any cost-tracking tool has spend data to report on. Vendors including NVIDIA, Intel, and Google submit results under audited, reproducible rules covering training and inference workloads. Its published results let buyers compare accelerator options before committing budget to a cloud contract.
It's a pre-purchase benchmarking resource for hardware and platform decisions, not a running cost-monitoring tool like the others on this list, so it belongs earlier in a team's evaluation process rather than in daily operations. It won't track a specific company's cloud bill. Where Artificial Analysis benchmarks hosted model APIs, MLPerf benchmarks the underlying hardware those APIs run on.
10OpenRouter
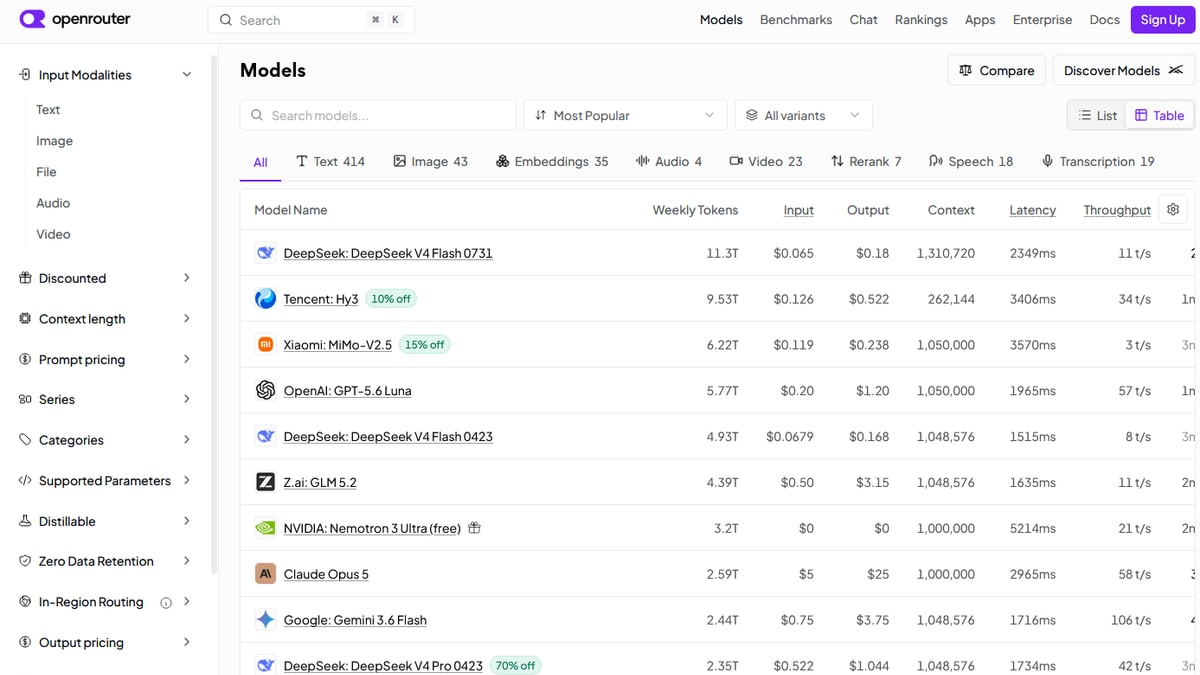
OpenRouter ranks tenth for giving teams a single API that routes requests across dozens of LLM providers while surfacing live per-token pricing for each, turning model selection into a real-time cost comparison. Its unified pricing table updates as providers change rates, and its routing can automatically fall back to a cheaper model when one is unavailable. Teams use it to compare cost and quality without integrating each provider separately by hand.
It's built for developers who want to switch or blend model providers by price without rewriting integration code, a narrower use case than the infrastructure-wide cost platforms ranked above it. It only covers hosted model APIs, not self-hosted GPU clusters. Compared to Artificial Analysis, which is a research benchmark, OpenRouter is an operational tool that also lets you act on the price differences it surfaces.
How we ranked these
Each tool was scored on four weighted criteria: attribution granularity (can it break spend down to a single training run, model, or GPU-hour rather than just a monthly cloud bill), integration depth with Kubernetes, Slurm, and major cloud billing APIs, latency of anomaly detection on runaway jobs, and whether forecasting held up against actual 90-day spend in public case studies. Documentation quality and active open-source or vendor support activity were weighted secondary factors.
Raw MLPerf-style throughput benchmarks were deliberately excluded, since those measure model or hardware speed, not dollar cost. We also ignored list-price comparisons alone, because negotiated enterprise and reserved-instance rates vary too widely to rank fairly. Marketing case studies without a public methodology or verifiable customer reference were discounted rather than treated as evidence.
What to look for
What actually matters is attribution granularity: can the tool tie a dollar figure to a specific model, training run, or inference endpoint, not just a total cloud invoice. Second is integration depth — native hooks into Kubernetes, Slurm, or your existing cloud billing API matter more than a polished dashboard, because manual tagging discipline breaks down fast at scale. Third is how quickly it flags anomalies, since a runaway GPU job can burn thousands of dollars before a human notices.
The most common mistake is buying a generic cloud-cost platform and assuming it covers AI workloads, when GPU-hour and token-level spend need purpose-built attribution logic those tools lack. A close second is chasing dashboard breadth over actionable alerts — teams end up with pretty charts nobody checks daily instead of automated budget guardrails that actually stop overspend before it happens.
Related questions
What is FinOps for AI infrastructure?
FinOps for AI extends the standard cloud cost-accountability discipline to GPU clusters, model training runs, and inference serving, where costs are far spikier and harder to attribute than typical compute spend. It applies the same show-back/charge-back principles but requires tooling that understands GPU-hour pricing, spot interruption risk, and per-model or per-team cost splitting rather than generic instance-level billing.
How is GPU-hour cost different from standard cloud cost tracking?
GPU-hour pricing varies enormously by chip generation, region, and reservation type, and a single training job can span dozens of instances that scale up and down unpredictably. Standard cloud cost tools track instance-hours at a coarse level, while GPU-hour tracking needs to correlate utilization telemetry with billing data to show whether expensive accelerators are actually being used efficiently during a run.
Can Kubecost or OpenCost track AI training costs?
Yes, both were originally built for general Kubernetes cost allocation but have added GPU-aware metrics that attribute spend to namespaces, pods, or labels tied to specific training jobs. They work well when AI workloads already run inside Kubernetes, but teams using Slurm-based HPC clusters or managed training services need a tool with broader integration coverage.
What is cost-per-token and why does it matter?
Cost-per-token measures how much it costs to generate or process each token through a deployed model, combining compute price, latency, and throughput into one comparable unit. It matters because it lets teams compare inference efficiency across model sizes, quantization levels, and hosting providers on a normalized basis instead of guessing from raw GPU-hour bills.
Do cost benchmarking tools work across multiple cloud providers?
Most enterprise-grade tools support AWS, Azure, and Google Cloud simultaneously, pulling billing data through each provider's cost APIs into a unified view. Coverage quality varies though — GPU-specific line items and spot-pricing nuances are sometimes incomplete on newer accelerator types, so it's worth confirming a tool's multi-cloud parity before committing to one for a mixed-cloud AI stack.
How often should AI infra costs be reviewed?
Given how quickly a misconfigured training job or an idle GPU cluster can rack up thousands of dollars, most FinOps practitioners recommend real-time anomaly alerts plus a formal weekly review, not just a monthly bill audit. Teams running frequent experimentation cycles often add automated budget caps per project so a runaway run can't silently continue overnight.
What's the difference between cost monitoring and cost benchmarking?
Cost monitoring tracks your own spend over time and flags anomalies, while cost benchmarking compares your spend efficiency against industry baselines or similar workloads to judge whether you're overpaying. Benchmarking tools typically layer reference pricing data and peer-comparison metrics on top of monitoring so teams know not just what they spent, but whether that spend was reasonable.
Are open-source cost tools reliable enough for production AI workloads?
Open-source tools like OpenCost have matured significantly and are used in production by companies running large Kubernetes-based AI infrastructure, but they generally require more in-house engineering to configure and maintain than a managed vendor product. Teams with strong platform engineering resources often prefer the open-source route for cost control and avoiding vendor lock-in.
FAQ
What is an AI infra cost benchmarking tool?
It's software that tracks, attributes, and compares the cost of running AI workloads — training runs, fine-tuning jobs, and inference serving — across GPUs, cloud instances, and storage. Unlike generic cloud cost tools, it understands GPU-hour pricing, model-level attribution, and token-based inference economics well enough to flag inefficiency and forecast spend accurately.
Which companies build the leading AI cost benchmarking tools?
The category includes dedicated FinOps-for-AI vendors like CloudZero and Finout, Kubernetes-native tools like Kubecost and the CNCF's open-source OpenCost project, and cloud-native cost management suites from AWS, Google Cloud, and Azure. Observability vendors such as Datadog have also added AI-specific cost modules to their existing cloud cost management products.
How much can these tools save on AI infrastructure spend?
Savings vary by baseline waste, but organizations with previously unmonitored GPU clusters commonly report double-digit percentage reductions after implementing attribution and anomaly alerting, mainly by catching idle reserved instances and runaway experimentation jobs. The bulk of savings typically come from behavior change driven by visibility, not from the tool itself cutting costs automatically.
Do I need a dedicated tool if I already use a cloud provider's native cost dashboard?
Native dashboards from AWS, Google Cloud, and Azure cover basic billing visibility but generally lack per-model or per-training-run attribution, cross-cloud normalization, and AI-specific anomaly detection. Teams running AI at meaningful scale, especially across multiple clouds or with frequent experimentation, typically outgrow native dashboards within a few months.
How do these tools handle spot and preemptible GPU pricing?
Leading tools ingest each cloud provider's spot and preemptible pricing feeds and factor interruption risk into their forecasting models, since spot GPU capacity can be 60-90% cheaper but comes with availability tradeoffs. The best tools show blended effective cost accounting for interruption-driven job restarts, not just the advertised spot rate.
Can these tools forecast future AI infrastructure spend?
Most enterprise-tier tools include forecasting based on historical usage trends, planned training schedules, and seasonality, though accuracy drops significantly for organizations with highly irregular experimentation cycles. Forecasting works best when paired with budget caps and alerts rather than relied on as a standalone prediction, since AI workload spend is inherently spikier than typical cloud usage.
Is it worth using a cost tool for small AI teams or startups?
Small teams with modest, predictable cloud bills may get by with native provider dashboards and manual spreadsheet tracking. Once a team runs regular training jobs across multiple GPU types or serves production inference traffic, though, the visibility gap becomes expensive fast, and even a lightweight open-source tool like OpenCost tends to pay for itself quickly.
How do these tools differ from MLPerf and other performance benchmarks?
MLPerf and similar benchmarks measure raw model or hardware speed — throughput, latency, accuracy — under standardized test conditions, independent of price. Cost benchmarking tools instead measure what you actually spend to achieve your real-world throughput, making the two complementary: one tells you how fast, the other tells you how much that speed costs.
What integrations should I look for before buying a cost tool?
Prioritize native support for your orchestration layer, whether Kubernetes, Slurm, or a managed training service like SageMaker or Vertex AI, plus direct billing API access to your cloud providers. Also check for Slack or PagerDuty alerting integration, since a tool that only surfaces cost data in a dashboard nobody checks daily provides far less value than one that pushes proactive alerts.
Sources
- https://www.kubecost.com/
- https://www.cncf.io/projects/opencost/
- https://www.finops.org/
- https://www.cloudzero.com/
- https://www.datadoghq.com/product/cloud-cost-management/
- https://aws.amazon.com/aws-cost-management/
- https://cloud.google.com/cost-management
- https://azure.microsoft.com/en-us/products/cost-management
- https://www.gartner.com/en/information-technology
- https://www.mckinsey.com/capabilities/mckinsey-digital
Related on PULSE
This page will be disappearing soon. Save it to your device for $1 — or read it free while it is here.
@Kory-White- · if Venmo asks, the last 4 of my number are 2012
This page is gone.
This one is off the shelf now. $1 keeps it on your phone for good — the whole page, pictures and diagrams included.
 pulse-recentThe 10 Best Disaster Recovery Tools for AI Infrastructure in 2027
 pulse-recentWhat is continuous batching and how much more throughput does it give an LLM server in 2027?
 pulse-recentThe 10 Best AI Tools for Multi-Agent Orchestration in 2027
 pulse-recentHow much can committed-use or reserved GPU cloud contracts save versus on-demand pricing for AI training in 2027?
 pulse-recentThe 10 Best AI Infra Cost per Token Benchmarks in 2027
 pulse-recentThe 10 Best AI Tools for Reducing Cloud AI Spend in 2027
 pulse-recentThe 10 Best Idle GPU Detection Tools for AI Infrastructure in 2027
 pulse-recentThe 10 Best AI Tools for Cloud Cost Optimization in 2027
 pulse-recentThe 10 Best AI Tools for GPU Cluster Orchestration in 2027
 pulse-recentThe 10 Best Chargeback and Showback Tools for Shared GPU Clusters in 2027