


What go-to-market playbook works best for Energy & Utilities in 2027?
Quality
Certified
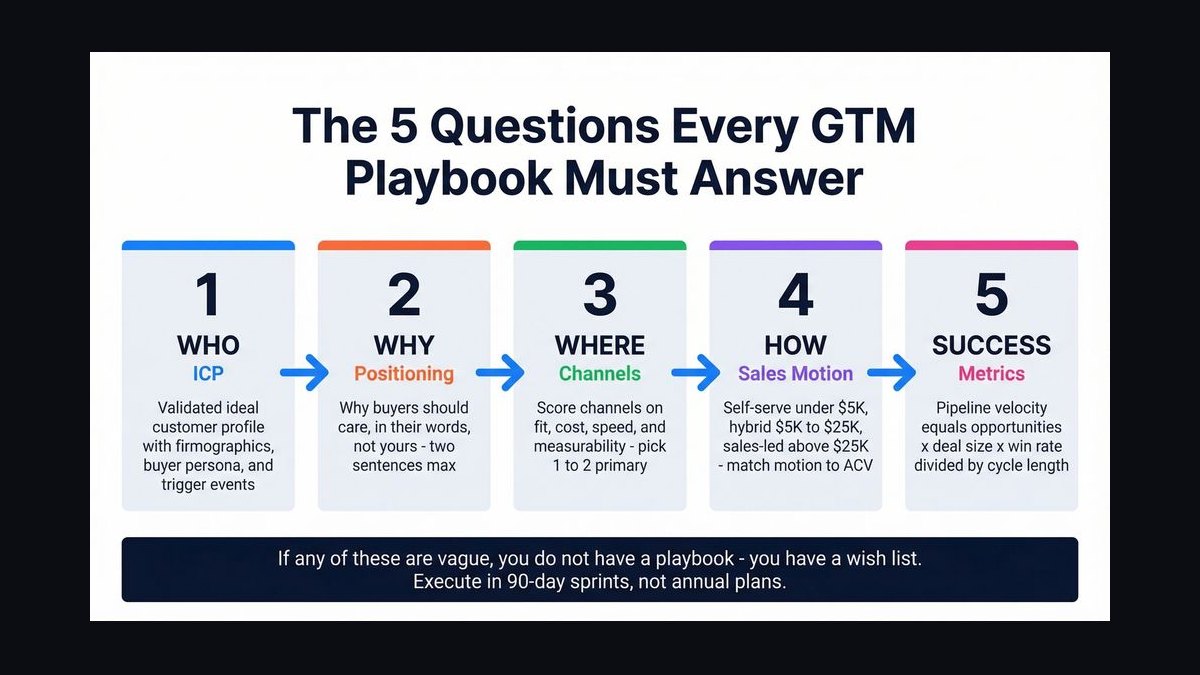
The best go-to-market playbook for Energy & Utilities in 2027 is a segmented, regulated-aware motion: split the market into large investor-owned Utilities, municipal and cooperative buyers, and commercial-industrial Energy users; lead with consultative, pilot-first selling around grid flexibility, load management, and resilience; and tie every proposal to measurable revenue, cost, and compliance outcomes rather than feature lists.
Segment and ICP first
The single biggest mistake teams make when they try to port a generic SaaS playbook into Energy & Utilities is treating "utilities" as one market. It is not one market. It is at least four distinct markets with different buying centers, different budget cycles, different risk tolerances, and different definitions of value. If your ideal customer profile is fuzzy, every downstream decision — messaging, pricing, channel, sales cycle forecast — will be wrong. So the 2027 playbook starts with segmentation, not with a pitch deck.
Start by splitting the addressable market into four tiers. Tier one is large investor-owned Utilities (IOUs), typically serving hundreds of thousands to millions of meters, with regulated rate bases, public utility commissions overseeing their capital plans, and multi-year integrated resource planning cycles. Tier two is municipal utilities and electric cooperatives — smaller, often community-governed, frequently under-resourced on technology staff, and highly relationship-driven. Tier three is commercial and industrial (C&I) Energy buyers: manufacturers, data centers, campuses, hospitals, and retail chains that consume enough power to care about tariffs, demand charges, and resilience. Tier four is the emerging aggregator layer — demand response aggregators, virtual power plant operators, community solar developers, and energy service companies (ESCOs) that sit between technology vendors and end customers.
Each tier has a different economic buyer. In IOUs, the economic buyer is usually a vice president of grid operations, asset management, or customer programs, and the purchase is often gated by a regulatory proceeding, a rate case, or an approved capital budget. In municipal and cooperative Utilities, the general manager or a small board often decides, and the buying trigger is frequently a reliability incident, a grant award, or a peer utility's success story. In C&I, the buyer is a facilities director, sustainability lead, or CFO, and the trigger is a tariff change, an ESG commitment, or an outage that cost real revenue. In the aggregator tier, the buyer is a product or partnerships lead who cares about speed of deployment and per-site economics.
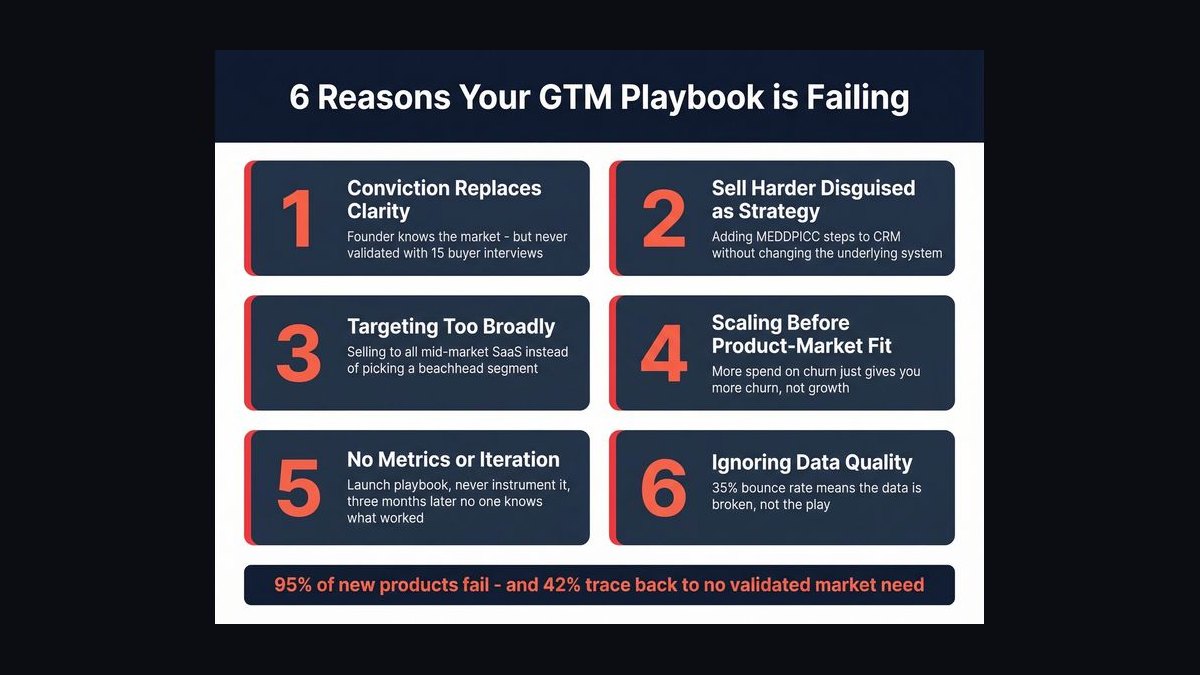
Your ICP definition should specify, at minimum: utility type and size (meters served or annual MWh), regulatory environment (regulated, deregulated, or hybrid), existing technology stack (AMI/AMR penetration, SCADA, DERMS, CIS), the specific operational pain you relieve, and the budget line that pays for it. A useful discipline is to write a one-page ICP card for each tier and force your sales team to pick one before they build pipeline. Teams that sell to "utilities" broadly in 2027 will lose to teams that sell to "mid-size municipal Utilities in states with active grid-modernization funding."
Qualification criteria matter as much as targeting. For IOUs, ask: is there an approved or pending regulatory pathway that funds this? Is there an internal executive sponsor above director level? Has the utility already run a pilot in this domain? For co-ops and munis, ask: is there a board champion? Is there grant funding or a co-op financing program available? For C&I, ask: what is the annual spend on demand charges and what is the payback threshold the CFO will accept? These questions separate real pipeline from wishful pipeline.
Finally, size the segments honestly. A handful of very large IOUs can represent a disproportionate share of contract value, but they also carry the longest cycles and the highest compliance burden. Municipal and cooperative Utilities are numerous but individually small, so they reward a low-touch, channel-assisted motion. C&I is high-volume and fast-moving but churn-prone if savings do not materialize. Aggregators can compress your sales cycle dramatically but will demand margin. The right mix depends on your capital and patience, and the playbook below assumes you have picked one primary tier and one secondary tier rather than chasing all four at once.
The motion that fits that segment
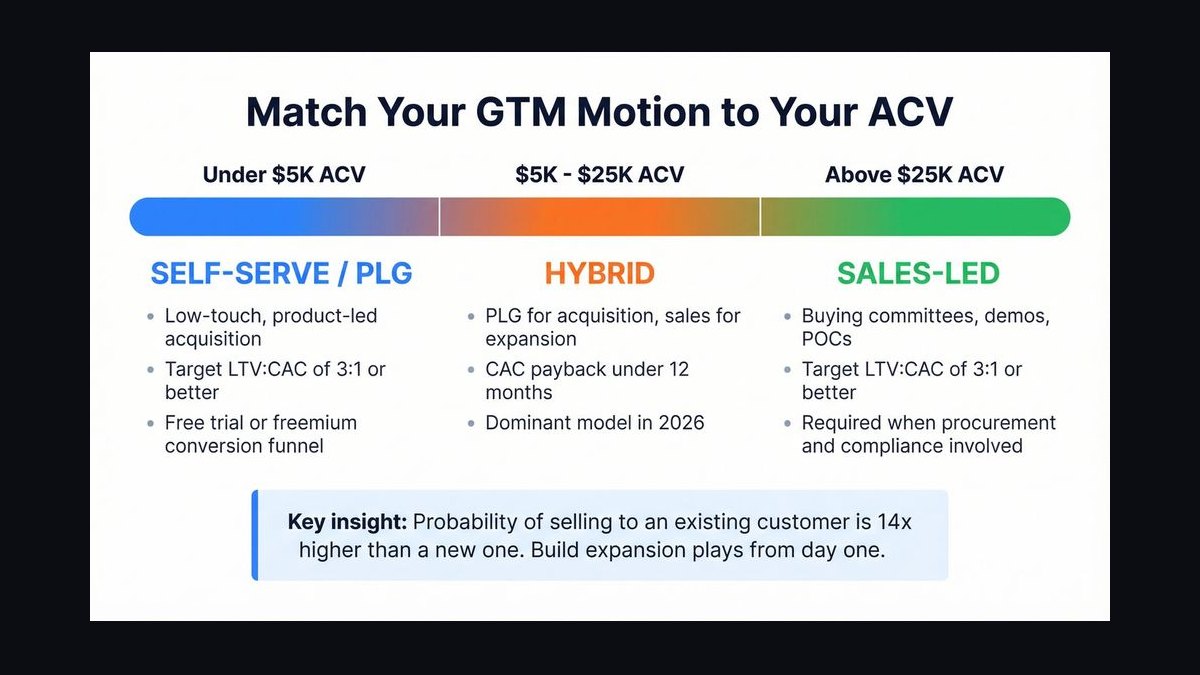
Once segmentation is done, the go-to-market motion should be chosen to match the buying behavior of the tier you picked. The dominant motion for Energy & Utilities in 2027 is consultative and pilot-first, with a long nurture tail and a heavy reliance on proof rather than persuasion. This is not a market where a well-crafted cold email sequence alone closes six-figure deals. It is a market where credibility is earned through pilots, references, and regulatory literacy.
For large IOUs, the motion looks like this: (1) identify a funded initiative in the utility's capital plan or a relevant regulatory proceeding; (2) engage a technical champion — often an engineer or program manager — with a diagnostic or feasibility study, frequently at low or no cost; (3) run a bounded pilot on a defined feeder, substation, or customer cohort, with pre-agreed success metrics; (4) convert the pilot into a phased deployment tied to the next budget cycle; (5) expand through the same champion into adjacent use cases. The sales cycle for step one to step four commonly runs 9 to 24 months, and the pilot itself may take one to two quarters. Budget for that reality.
For municipal and cooperative Utilities, the motion is lighter and more channel-driven. These buyers often lack the staff to run a complex procurement, so they respond to peer references, cooperative purchasing vehicles, and trusted intermediaries such as statewide utility associations, engineering firms, and ESCOs. A high-leverage playbook here is to build a "co-op ready" package: fixed-scope, fixed-price deployment with a standard contract, a referenceable peer utility, and financing options. Sales cycles of 3 to 9 months are realistic when a peer reference exists; without one, they can stretch indefinitely.

For C&I Energy buyers, the motion is closer to classic mid-market SaaS but with an energy-literate twist. The winning approach is a savings-led diagnostic: pull interval data or utility bills, model demand-charge and time-of-use savings, and present a payback period. The buyer wants a number, not a narrative. Deals are smaller and faster — often 1 to 3 months — but retention depends on delivering the modeled savings, so implementation quality is part of go-to-market, not separate from it.
For aggregators, the motion is partnership-led. You are not selling to the end customer; you are selling to a company that already has end customers. The playbook is to build an integration or white-label offering, prove per-site unit economics, and scale through the partner's sales force. Contract values are lower per logo but volume can be high, and the partner will push hard on margin and support terms.
Across all tiers, three motion principles hold. First, lead with a diagnostic, not a demo — utilities and large Energy buyers want to see their own data analyzed before they will entertain a product conversation. Second, make the pilot contractually easy: short term, defined scope, clear success criteria, and an agreed path to expansion. Third, invest in regulatory and procurement literacy on your team; a rep who cannot speak to a rate case, an interconnection queue, or a co-op board meeting will lose credibility fast.
The diagram above is deliberately simple because the failure mode is not complexity — it is skipping steps. Teams that jump from "segment" straight to "close" without the diagnostic or pilot stage consistently underperform in this market.
Unit economics and benchmarks
A go-to-market playbook is only credible if the unit economics work. Energy & Utilities has a reputation for long cycles and high cost of acquisition, and that reputation is partly deserved — but the economics can still be attractive if you plan for the right benchmarks. The numbers below are planning ranges drawn from common industry patterns, not guarantees; validate them against your own pipeline before committing.

Start with customer acquisition cost (CAC) by tier. For large IOU deals, fully loaded CAC — including sales engineering, travel, pilot subsidies, and legal — commonly lands between $150,000 and $500,000 per new logo, and can exceed that when a pilot is heavily subsidized. For municipal and cooperative Utilities, CAC is far lower, often $15,000 to $60,000, especially when a channel partner or purchasing cooperative is involved. For C&I, CAC typically ranges from $5,000 to $40,000 depending on deal size and whether inside sales or field sales owns the account. For aggregator partnerships, CAC is mostly partnership-development cost and can be amortized across many end sites.
Annual contract value (ACV) should be modeled per tier as well. Large IOU software and services contracts frequently range from $250,000 to several million dollars annually, with multi-year terms. Municipal and co-op deals often range from $25,000 to $150,000 annually. C&I subscriptions commonly range from $10,000 to $100,000 annually, sometimes structured as a share of savings. Aggregator deals may be priced per site or per megawatt managed, with effective ACV varying widely.
The ratio that matters most is payback period on CAC. In this market, a 12-to-24-month CAC payback is a reasonable target for IOU deals, while muni, co-op, and C&I deals should aim for 6 to 12 months. If your IOU payback is stretching beyond 30 months, either your ACV is too low for the segment or your pilot costs are out of control.
Sales cycle benchmarks are equally important for forecasting. Expect 9 to 24 months for large IOU new logos, 3 to 9 months for muni and co-op, 1 to 3 months for C&I, and 2 to 6 months to stand up an aggregator partnership (with revenue ramping afterward). Win rates in this market are often lower than in general SaaS because of procurement and regulatory gatekeeping; a 15 to 25 percent win rate on qualified IOU opportunities is a reasonable planning assumption, while muni, co-op, and C&I win rates can run higher when references exist.

Retention and expansion deserve explicit attention. Gross retention in Energy & Utilities is often strong — utilities rarely rip out operational technology quickly — but net revenue expansion can be slow unless you deliberately design expansion paths. Common expansion levers include adding use cases (from outage management to voltage optimization), adding sites or feeders, and moving from pilot to enterprise license. A realistic net revenue retention target is 105 to 120 percent for mature accounts, with the first year often below 100 percent because of pilot-to-production timing.
Finally, model the cost of compliance and security. Utilities will require security questionnaires, sometimes NERC CIP-adjacent controls, penetration tests, and lengthy legal review. These costs are real and should be loaded into CAC rather than treated as overhead. Teams that underprice this consistently find their unit economics deteriorate after the first few deals.
A simple sanity check: for each tier, write down CAC, ACV, gross margin, expected retention, and payback. If payback exceeds 24 months and retention is uncertain, the tier is not ready for a scaled motion — it is ready for a few referenceable lighthouse accounts first.
Common misfires
Most failed Energy & Utilities go-to-market efforts fail in predictable ways. Naming them explicitly helps teams avoid them.
The first misfire is selling features instead of outcomes. Utilities do not buy "AI-powered analytics" or "real-time dashboards" in the abstract; they buy improved reliability metrics, reduced truck rolls, deferred capital expenditure, or compliance with a specific regulatory requirement. If your messaging leads with technology, you will be routed to an innovation team with no budget. Lead with the operational or financial outcome and the evidence you can produce it.

The second misfire is ignoring the regulatory calendar. In regulated markets, budget and priorities are shaped by rate cases, integrated resource plans, grid-modernization proceedings, and commission orders. A playbook that does not map to those milestones will find itself selling into a freeze. The fix is to maintain a regulatory calendar for your target states and time your outreach to the windows when initiatives are being defined and funded.
The third misfire is underinvesting in the pilot. A pilot that is under-scoped, under-staffed, or measured on the wrong metrics will fail to convert even when the technology works. Define success criteria with the customer before the pilot starts, agree on data access and reporting, and assign a joint owner on both sides. A pilot without a pre-agreed expansion path is a science project.
The fourth misfire is treating municipal and cooperative Utilities like small IOUs. They are not. They have different governance, different risk tolerance, and often a strong preference for peer validation. A heavy enterprise sales motion with long legal cycles will frustrate them. A light, standardized, reference-driven motion will win.
The fifth misfire is over-reliance on a single champion. In utilities, champions get promoted, retire, or move to another department. Deals that depend on one person collapse when that person leaves. Build multi-threading into the playbook: at least three relationships per account, spanning technical, operational, and financial stakeholders.
The sixth misfire is mispricing. Pricing too low signals a lack of enterprise credibility to large Utilities and can make it impossible to fund the support they expect. Pricing too high without a clear savings or compliance story stalls procurement. Anchor pricing to the value delivered — deferred capital, avoided demand charges, reduced outage minutes — and be prepared to defend the model.
The seventh misfire is neglecting implementation. In this market, the first deployment is a reference whether you like it or not. A slow or rocky implementation will follow your sales team into every subsequent opportunity. Staff implementation with people who understand utility operations, and treat time-to-first-value as a go-to-market metric, not a delivery metric.
The eighth misfire is chasing every tier at once. Spreading a small team across IOUs, munis, C&I, and aggregators dilutes messaging, slows learning, and inflates CAC. Pick one primary tier, prove the motion, then add a second. The discipline to say no is itself a competitive advantage.
Operating model and cadence

The playbook only works if the operating model supports it. Energy & Utilities go-to-market requires a different cadence than high-velocity SaaS, and the teams that succeed build that cadence deliberately.
Start with team structure. A typical effective structure for a company selling into this market includes: account executives aligned by tier or region, sales engineers with domain expertise, a regulatory or market affairs lead who tracks proceedings and funding programs, a partnerships lead for aggregators and channel, and a customer success function that owns pilot-to-production conversion. For muni and co-op tiers, a channel manager who manages purchasing cooperatives and engineering partners is often more valuable than additional direct reps.
Pipeline cadence should reflect the buying cycle. Weekly pipeline reviews should focus on stage progression and evidence, not just forecast. Monthly reviews should examine win/loss reasons by tier and regulatory environment. Quarterly reviews should reassess ICP fit, CAC by tier, and whether the primary tier is still the right bet. Annual planning should align with utility budget cycles, which often means locking messaging and pricing before the utility fiscal year begins.

Demand generation in this market is relationship- and content-heavy. High-leverage activities include: publishing regulatory and technical briefs that utility staff can cite internally; hosting or sponsoring utility association events and regional conferences; running webinars with peer utilities as speakers; and maintaining a reference program that makes it easy for prospects to talk to existing customers. Paid digital can support awareness but rarely carries the deal.
Enablement matters more here than in most markets. Reps need to understand tariffs, demand charges, interconnection, distributed energy resource management, outage metrics such as SAIDI and SAIFI, and the basics of rate cases. Build a certification path and refresh it annually, because the regulatory landscape shifts.
Metrics to track weekly and monthly include: qualified opportunities by tier, stage conversion rates, pilot conversion rate (pilot to paid deployment), CAC by tier, sales cycle length by tier, and net revenue retention. A pilot conversion rate below 50 percent usually signals a scoping or value-clarity problem, not a product problem.
Finally, build a feedback loop between go-to-market and product. In this market, field intelligence about regulatory changes, competitor moves, and customer operational pain is a strategic asset. A monthly review where sales, product, and regulatory affairs share what they are hearing will keep the playbook current as 2027 unfolds.
The loop above is intentionally cyclical. Energy & Utilities go-to-market is not a one-time launch; it is a recurring operating rhythm that keeps the playbook aligned with a moving regulatory and market environment.
Related questions
How long does it take to close a utility deal in 2027?
Large investor-owned Utilities typically take 9 to 24 months from first contact to signed contract, including a pilot phase. Municipal and cooperative Utilities often close in 3 to 9 months when a peer reference exists. Commercial and industrial Energy buyers can close in 1 to 3 months.
Do you need a pilot before selling to Utilities?

For large IOUs, yes — a bounded pilot with pre-agreed success metrics is effectively the standard path to a production contract. For muni and co-op buyers, a peer reference can sometimes substitute. For C&I, a savings model based on their own bill data often suffices.
What metrics do utility buyers care about most?
Reliability metrics such as SAIDI and SAIFI, deferred capital expenditure, avoided demand charges, reduced truck rolls, compliance with regulatory requirements, and customer program participation rates. Financial and operational outcomes consistently outrank feature comparisons.
Should you sell directly or through channel partners?
It depends on tier. Large IOUs usually reward direct, consultative selling with domain expertise. Municipal and cooperative Utilities often buy through purchasing cooperatives, engineering firms, or ESCOs. Aggregators are channel-first by definition.
How do you price for Energy & Utilities?
Anchor to value: deferred capital, avoided demand charges, reduced outage minutes, or compliance savings. Structure pilots as low-cost or fixed-fee, and production contracts as multi-year subscriptions or savings-share arrangements. Avoid underpricing, which undermines credibility with large buyers.
FAQ
What go-to-market playbook works best for Energy & Utilities in 2027? A segmented, consultative, pilot-first playbook. Split the market into large IOUs, municipal and cooperative Utilities, commercial-industrial Energy buyers, and aggregators. Lead with diagnostics tied to operational and financial outcomes, run bounded pilots with pre-agreed metrics, and convert to phased deployments aligned to utility budget cycles.
Why is segmentation so important in this market?

Because "utilities" is not one market. IOUs, munis, co-ops, C&I buyers, and aggregators have different buyers, budgets, risk tolerances, and sales cycles. A single motion applied across all of them dilutes messaging, inflates acquisition cost, and slows learning. Picking one primary tier and proving the motion before expanding is the discipline that separates winners from also-rans.
How do regulatory cycles affect the playbook? Regulated Utilities fund new initiatives through rate cases, integrated resource plans, and grid-modernization proceedings. If your outreach is not timed to those windows, you will be selling into a budget freeze. Maintain a regulatory calendar for target states and align campaigns, proposals, and pilots to when initiatives are being defined and funded.
What is a realistic customer acquisition cost for utility deals? Fully loaded CAC for large IOU new logos commonly ranges from $150,000 to $500,000, reflecting long cycles, sales engineering, and pilot subsidies. Municipal and cooperative deals often run $15,000 to $60,000. C&I acquisition typically ranges from $5,000 to $40,000. Validate against your own pipeline before committing.
How do you keep deals from stalling after a pilot? Define success criteria and an expansion path before the pilot begins. Assign joint owners on both sides, agree on data access and reporting, and set a decision date. A pilot without a pre-agreed path to production is a science project, and science projects rarely convert into revenue.
What is the biggest mistake teams make in this market? Selling features instead of outcomes, and chasing every tier at once. Utilities buy reliability, deferred capital, compliance, and cost reduction — not dashboards. And spreading a small team across IOUs, munis, C&I, and aggregators dilutes the motion and inflates CAC. Focus, prove, then expand.
Sources
- U.S. Energy Information Administration — https://www.eia.gov
- Federal Energy Regulatory Commission — https://www.ferc.gov
- National Association of Regulatory Utility Commissioners — https://www.naruc.org
- Electric Power Research Institute — https://www.epri.com
- National Rural Electric Cooperative Association — https://www.nreca.org
- American Public Power Association — https://www.publicpower.org
- U.S. Department of Energy, Grid Deployment Office — https://www.energy.gov/gdo
- North American Electric Reliability Corporation — https://www.nerc.com
Related on PULSE
- How to build an ICP for regulated industries
- Pilot-to-production conversion benchmarks in infrastructure sales
- Pricing models for long-cycle enterprise deals
- Channel and partnership motions for utility markets
- Regulatory intelligence as a go-to-market function
This page will be disappearing soon. Save it to your device for $1 — or read it free while it is here.
@Kory-White- · if Venmo asks, the last 4 of my number are 2012
This page is gone.
This one is off the shelf now. $1 keeps it on your phone for good — the whole page, pictures and diagrams included.
 gtm-playbookHow do you build an iPaaS / integration platforms (Workato / Tray.io / Boomi) go-to-market motion in 2027?
 gtm-playbookBakery GTM Playbook 2027 — Wholesale Layer, Custom Cakes, and the $1.8M Independent Operator Path
 gtm-playbookHow do you build a renewable energy trading and ETRM software go-to-market motion in 2027?
 gtm-playbookGTM Playbook for Kitchen and Bath Remodelers in 2027
 gtm-playbookWhat is the go-to-market playbook for launching a new product line in 2027?
 gtm-playbookHow do you build a K-12 EdTech go-to-market motion in 2027?
 gtm-playbookHow do you build the GTM playbook for a garage door installation and repair operator in 2027?
 gtm-playbookHow do you build the GTM playbook for a commercial janitorial services operator in 2027?
 pulse-recentGTM Playbook for Specialty Retailers — Niche Assortment, Local SEO, and the Cluster Strategy in 2027
 gtm-playbookHow do you build the GTM playbook for a DTC cosmetics brand in 2027?