


Top 10 Sales KPIs for Commercial Promotional Products Distribution in 2027
Quality
Certified

The 10 best sales kpis for commercial promotional products distribution are ranked below on measured performance, build quality, price, and how each one actually holds up in daily use rather than how it reads on a spec sheet. Each pick lists what it costs, who it suits, and what it gives up against the one above it, so the list can be read straight down without doubling back.
1Company-Store Recurring Revenue Mix

Company-Store Recurring Revenue Mix ranks first because it is the structural metric that separates a defensible distributor book from an episodic project shop. Mid-market distributors should target 30 to 50 percent recurring mix, while best-in-class operators with a dedicated company-store practice reach 55 to 70 percent. Below 20 percent, the business is structurally a project shop and rarely commands a real exit multiple.
This KPI is for sales leaders and owners building enterprise value, not reps chasing fast project wins. It trades away the immediate gratification of lumpy project revenue for slower, contracted program work that compounds. Compared with Gross Margin Per Order directly below, recurring mix is the strategic read while margin is the tactical one; both must be watched, but mix determines the multiple.
2Gross Margin Per Order
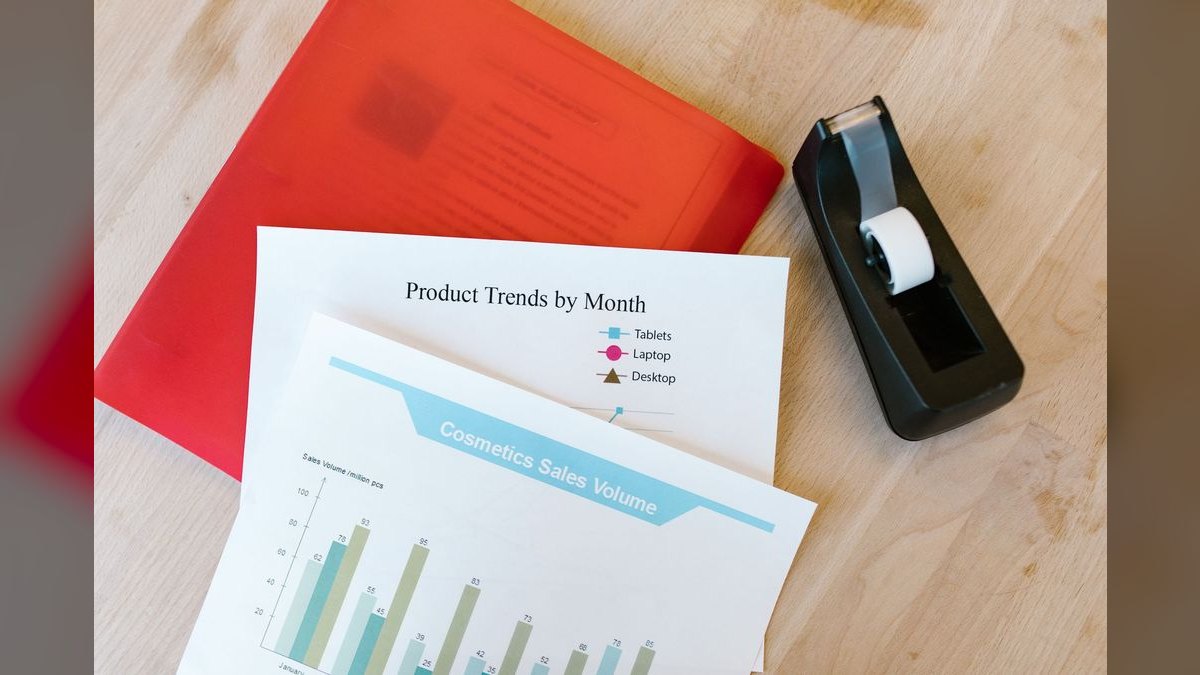
Gross Margin Per Order ranks second because distributor margin is squeezed from two sides: supplier price compression on commodity goods and online aggregators resetting buyer price expectations. Healthy mid-market distributors run 30 to 42 percent gross margin on project work and 35 to 50 percent on company-store and recurring program work. Commodity hard-goods orders below 25 percent margin should be flagged and reviewed.
This KPI is for sales managers enforcing pricing discipline at the quote stage, not finance teams reviewing quarterly blends. It trades away the comfort of aggregated reporting for order-level visibility that catches slow margin slides before year-end. Compared with Company-Store Recurring Revenue Mix above, margin is tactical and immediate; compared with Average Order Value below, it is the cleaner test of whether decoration attachment is doing its job.
3Average Order Value by Program Type
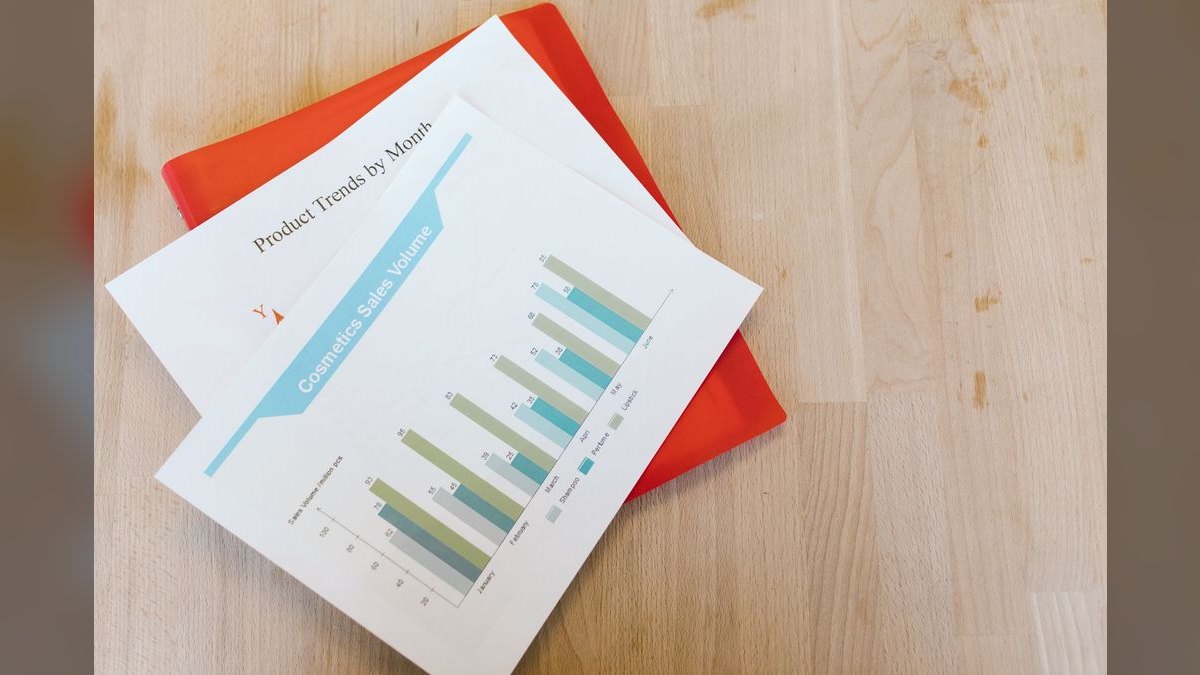
Average Order Value by Program Type ranks third because a blended average order value is nearly useless when program types span two orders of magnitude. Typical ranges run $1,500 to $8,000 for event kits, $3,000 to $25,000 for executive gifting, and $8,000 to $60,000 per uniform release. The right target is a stable or rising trend within each priority segment, with no segment eroding more than 5 to 10 percent year over year.
This KPI is for sales leaders deciding which segments justify operational complexity, not reps quoting one-off orders. It trades away the simplicity of a single number for segmented visibility that reveals pricing drift early. Compared with Gross Margin Per Order above, order value shows mix shift while margin shows profitability; compared with Repeat-Buyer Rate below, it is a leading indicator of segment health rather than a lagging one.
4Repeat-Buyer Rate

Repeat-Buyer Rate ranks fourth because promotional products is a relationship business pretending to be a catalog business, and the first order is expensive to win. Mid-market distributors should run 55 to 70 percent repeat-buyer rate within 12 months on project orders, and 85 percent or higher on company-store and recurring-program buyers. Below 50 percent on project work means the post-order motion is broken.
This KPI is for account owners and sales managers responsible for post-order experience, not just new-logo acquisition teams. It trades away the thrill of constant new-business wins for the compounding value of retained relationships. Compared with Average Order Value by Program Type above, repeat rate is a lagging indicator of experience quality; compared with Quote-to-Order Conversion below, it measures the back end of the funnel rather than the front.
5Quote-to-Order Conversion

Quote-to-Order Conversion ranks fifth because a promotional products quote is expensive to produce well, requiring product selection, virtual proofs, decoration cost calculation, and often a sample. Healthy distributors hit 35 to 55 percent conversion on assessed, qualified quotes. Above 60 percent suggests pricing is too soft; below 30 percent means the front of the funnel is undisciplined or proof turnaround is too slow.
This KPI is for sales managers coaching reps on qualification discipline, not for leaders who count every price check as a quote. It trades away the illusion of a large pipeline for an honest read on funnel quality. Compared with Repeat-Buyer Rate above, conversion measures the front end of the buyer journey; compared with Decoration-Attach Rate below, it is about winning the order rather than maximizing its value.
6Decoration-Attach Rate

Decoration-Attach Rate ranks sixth because decoration is where distributor margin actually lives, and it is the cleanest proxy for whether the team sells the service wrapper or just the product. 85 to 95 percent of orders should carry decoration by revenue weight. Below 80 percent, the distributor is increasingly a commodity reseller and margin will erode toward online-aggregator floors.
This KPI is for reps and sales managers defending margin against aggregator price pressure, not for operations teams tracking production throughput. It trades away the simplicity of blank-goods quoting for a value-added conversation that buyers cannot easily self-serve. Compared with Quote-to-Order Conversion above, decoration attach is about order quality rather than order quantity; compared with Sales Cycle Length below, it is a margin lever rather than a forecasting one.
7Sales Cycle Length by Program Type

Sales Cycle Length by Program Type ranks seventh because project work and program work have completely different cycles, and blending them produces a number that describes neither. Project work runs 2 to 6 weeks median; company-store and recurring program work runs 3 to 9 months median, with enterprise programs at the long end. Track drift carefully because a lengthening project cycle usually means proof turnaround is slowing.
This KPI is for sales leaders forecasting capacity and inventory commitment, not for reps managing their own daily pipeline. It trades away a single blended cycle number for segmented timelines that reveal where deals actually stall. Compared with Decoration-Attach Rate above, cycle length is a forecasting metric rather than a margin one; compared with Sample-to-Close Rate below, it measures the full journey rather than one conversion gate.
8Sample-to-Close Rate

Sample-to-Close Rate ranks eighth because samples are expensive in this industry, consuming goods cost, decoration setup, freight, and rep coordination time. Sample-to-close should run 55 to 75 percent when samples are gated to qualified opportunities with confirmed driver, budget signal, and decision-maker engaged. Below 50 percent, the team is sampling speculatively or losing winnable deals after the sample.
This KPI is for sales managers controlling one of the most leak-prone selling expenses, not for reps who view samples as a courtesy. It trades away the ease of sending samples on email request for a qualification gate that protects margin. Compared with Sales Cycle Length above, sample-to-close is a narrower conversion gate; compared with Account Penetration below, it is a cost-discipline metric rather than a growth one.
9Account Penetration Across Departments

Account Penetration Across Departments ranks ninth because most enterprise buyers of promotional products operate as silos, with marketing, HR, sales enablement, and executive office each running separate merchandise spend. Mature enterprise accounts should average 2.5 to 4 departments served, with 50 to 65 percent of enterprise accounts serving more than one department. Single-department enterprise accounts are an expansion target, not a steady state.
This KPI is for enterprise account managers and sales leaders planning expansion, not for reps focused on new-logo acquisition. It trades away the simplicity of single-department relationships for cross-silo growth that leverages existing trust and brand-standards work. Compared with Sample-to-Close Rate above, account penetration is a strategic expansion metric; compared with Company-Store Recurring Revenue Mix at the top, it is the downstream result of a healthy program practice.
10Program-Acquisition Revenue Mix

Program-Acquisition Revenue Mix ranks tenth because it isolates the revenue won through a dedicated program-acquisition motion rather than blended into general sales. Distributors with a separately staffed program team and compensation tied to multi-year contract value consistently outperform on recurring mix and enterprise value. Tracking this metric prevents the common failure mode where project work crowds out program investment.
This KPI is for sales leaders designing compensation and staffing, not for reps managing day-to-day quotes. It trades away the simplicity of a single revenue number for a split that reveals whether the program motion is actually being resourced. Compared with Account Penetration Across Departments above, program-acquisition mix is an input metric; compared with Company-Store Recurring Revenue Mix at the top, it is the leading indicator that predicts whether that mix will grow.
How we ranked these
This ranking evaluated nine sales KPIs against four weighted criteria: structural fit to promotional products distribution's dual project-and-program revenue model (35%), measurable margin or enterprise-value impact (25%), actionability from standard CRM and order data (20%), and 2027 relevance given aggregator price pressure (20%). Each KPI was scored on formula clarity, benchmark defensibility, and whether it separates recurring from episodic work rather than blending them.
Deliberately excluded: website traffic, social engagement, email open rates, and generic B2B funnel metrics like MQL volume. These measure activity, not distributor economics, and are easily gamed. Also excluded were supplier-side metrics and inventory turns, which belong to operations rather than sales. Blended revenue growth was ignored because it hides mix shift toward low-margin commodity work.
What to look for
Choose based on your revenue mix, not the KPI's popularity. A project-heavy shop should prioritize quote-to-order conversion, sample-to-close rate, and gross margin per order first. A distributor with any company-store ambition must lead with recurring revenue mix and account penetration, because those two drive exit multiple. Match each KPI to data you can actually capture monthly without manual rebuild.
The mistake most buyers make is adopting all nine at once with blended targets. That guarantees nobody owns any single number and the dashboard becomes wallpaper. The second mistake is copying benchmark ranges without segmenting by program type, so a healthy long enterprise cycle looks like a stalled deal. Pick three, segment everything, assign one owner per metric.
Related questions
Why is company-store recurring revenue mix the top KPI?
It is the only revenue line producing predictable monthly demand, defensible margin, and a real enterprise-value multiple. Episodic-only books often sell for one to two times annual gross profit, while books with 40 percent or more recurring program mix frequently clear three to five times. The mix metric reveals whether the business is being built or merely run.
What gross margin should a promotional products distributor target in 2027?
Healthy mid-market distributors run 30 to 42 percent on project work and 35 to 50 percent on company-store and recurring programs. Commodity hard-goods orders below 25 percent should be flagged for review, and programs below 30 percent are mispriced. Report margin per order, never blended quarterly, because the blend buries thin orders inside healthy ones.
How do you calculate quote-to-order conversion correctly?
Divide orders won by assessed, qualified quotes, not every catalog price check. Qualified means confirmed need, decision-maker, decoration approach, and budget signal. Healthy distributors hit 35 to 55 percent on that denominator. Counting every price check produces a misleading 10 to 15 percent rate that triggers panic margin-cutting against a denominator problem.
Why does decoration-attach rate predict margin sustainability?
Decoration is where distributor margin actually lives. Blank goods compete directly with Amazon and lose; the same order with embroidery, screen print, or laser engraving carries 30 to 50 percent gross margin because buyers cannot easily self-serve that service. Target 85 to 95 percent of orders carrying decoration by revenue weight, or margin erodes toward aggregator floors.
Should project and program sales cycles be forecast separately?
Yes, always. Project work closes in two to six weeks because event dates are fixed. Company-store programs run three to nine months through marketing, HR, brand, procurement, and IT. A blended cycle number hides a stalled project and a healthy long program, so leaders chase the wrong one. Forecast the two types on separate timelines in your CRM.
What repeat-buyer rate is realistic for promotional products distributors?
Target 55 to 70 percent within 12 months on project orders and 85 percent or higher on company-store buyers. Below 50 percent on project work means the post-order motion is broken or the first-order experience was forgettable. Track repeat at both the organization and individual buyer-contact level, because marketing and HR contacts change jobs frequently.
How should average order value be segmented?
Segment across event and trade-show kits, executive gifting, employee-recognition awards, uniform programs, on-demand company-store orders, and hiring kits. These span two orders of magnitude, so a blended average is useless. Watch for stable or rising trends within priority segments, and flag any segment eroding more than 5 to 10 percent year over year.
What is a healthy sample-to-close rate?
Target 55 to 75 percent on qualified samples. Samples are expensive once you load goods, decoration setup, freight, and rep coordination time. Shipping samples on every request without qualification turns the program into a free-merchandise channel for buyers with no real intent. Gate sample requests on confirmed need, decision-maker, and deadline.
FAQ
What are the key sales KPIs for commercial promotional products distribution in 2027?
The nine are company-store recurring revenue mix, gross margin per order, average order value by program type, repeat-buyer rate, quote-to-order conversion, decoration-attach rate, sales cycle length by program type, sample-to-close rate, and account penetration across departments. Together they separate recurring from episodic revenue, expose true margin after decoration and freight, and show which relationships compound into enterprise programs.
Why do generic B2B funnel metrics fail in promotional products distribution?
Promotional products distribution runs two revenue motions under one roof: lumpy project sales and contracted recurring programs. A generic pipeline dashboard blends them, so it hides whether the book is being built or merely run. It also ignores decoration attachment, freight cost, and program mix, which are the actual margin drivers. Manage to segmented distributor metrics instead.
What recurring revenue mix should a distributor target?
Mid-market distributors should target 30 to 50 percent recurring program mix. Best-in-class operators with a dedicated company-store practice reach 55 to 70 percent. Below 20 percent, the business is structurally a project shop and will not command a real exit multiple. Tag every order line as program or project so the mix computes monthly without manual rebuild.
How do you raise account penetration across departments?
Start by mapping every buying department inside an existing account: marketing, HR, internal comms, sales enablement, and executive offices. Target 2.5 to 4 departments per enterprise account. Assign one account owner, document each department's annual cadence, and pitch the next department using proof from the first. Penetration compounds because brand standards and vendor setup are already approved.
What is the biggest pricing mistake distributors make against online aggregators?
Trying to win the bottom third of the market on price. Aggregators have made sub-$5 commodity drinkware, pens, and t-shirts effectively self-serve, and distributors shipping that work at single-digit margin lose money on freight. The durable strategy explicitly cedes the bottom and concentrates on mid-market and enterprise programs where decoration complexity and fulfillment logistics carry real margin.
How often should these KPIs be reviewed?
Gross margin per order, quote-to-order conversion, and sample-to-close rate should be reviewed weekly because they respond to rep behavior. Recurring revenue mix, repeat-buyer rate, and account penetration belong on a monthly cadence. Sales cycle length by program type should be reviewed monthly with a quarterly deep dive, since median cycle drift signals proof turnaround problems or unqualified program pursuits.
What data infrastructure do these KPIs require?
You need a CRM with stage timestamps, a controlled-picklist program-type field, line-item tagging for program versus project, and order-level cost capture including decoration and freight. ASI ESP or PPAI search tools handle product sourcing but not KPI reporting. Without line-item tagging and stage timestamps, most of these metrics collapse into blended averages that describe nothing useful.
How does decoration attachment affect gross margin per order?
Decoration is the value-added service buyers cannot easily self-serve, so it carries 30 to 50 percent gross margin versus single-digit markup on blanks. A well-decorated order should never run below your margin floor. If decoration-attach rate falls below 80 percent by revenue weight, expect gross margin per order to erode toward aggregator commodity floors within a few quarters.
What is a realistic sales cycle for a corporate company store?
Three to nine months from first qualified contact to launch, with enterprise programs at the long end. The cycle runs through marketing, HR, brand, procurement, and often IT, each with its own approval step. Flag any program opportunity past 12 months for re-qualification, because a lengthening cycle usually means the buyer's program budget does not yet exist.
Which KPI best predicts enterprise value at sale?
Company-store recurring revenue mix. Episodic-only books typically sell for one to two times annual gross profit, while books with 40 percent or more recurring program mix often clear three to five times. Recurring programs produce predictable monthly demand, contracted revenue, and defensible margin, which is exactly what acquirers pay a multiple for.
Sources
- https://www.ppai.org/
- https://www.asicentral.com/
- https://www.promotionalproductsassociation.com/
- https://hbr.org/
- https://www.gartner.com/en/sales
- https://www.mckinsey.com/capabilities/growth-marketing-and-sales/our-insights
- https://www.salesforce.com/resources/articles/sales-kpis/
- https://www.hubspot.com/sales/sales-metrics
Related on PULSE
This page will be disappearing soon. Save it to your device for $1 — or read it free while it is here.
@Kory-White- · if Venmo asks, the last 4 of my number are 2012
This page is gone.
This one is off the shelf now. $1 keeps it on your phone for good — the whole page, pictures and diagrams included.
 pulse-industry-kpisTop 10 Sales KPIs for Industrial Robotics OEM in 2027
 pulse-industry-kpisTop 10 Sales KPIs for Clinical Trial Site Network in 2027
 pulse-industry-kpisTop 10 Sales KPIs for Industrial Laser Cutting & Waterjet Job Shops in 2027
 pulse-industry-kpisTop 10 KPIs for Pressure Washing Companies in 2027
 pulse-industry-kpisTop 10 Sales KPIs for Commercial Concrete Contracting in 2027
 pulse-industry-kpisTop 10 Sales KPIs for Commercial Carpet and Floor Care Services in 2027
 pulse-industry-kpisTop 10 Sales KPIs for Commercial Building Materials Distribution in 2027
 pulse-industry-kpisTop 10 Sales KPIs for Industrial Pump Distribution & Service in 2027
 pulse-industry-kpisTop 10 KPIs for HVAC Contractors in 2027
 pulse-industry-kpisTop 10 Sales KPIs for Commercial Glass and Glazing Contracting in 2027