 Pulse Reviews and Analysis
Hotel Management: RevPAR vs. TRevPAR — Which Metric Drives Profitability Decisions?
 Curated by Kory White · Fractional CRO, CRO Syndicate
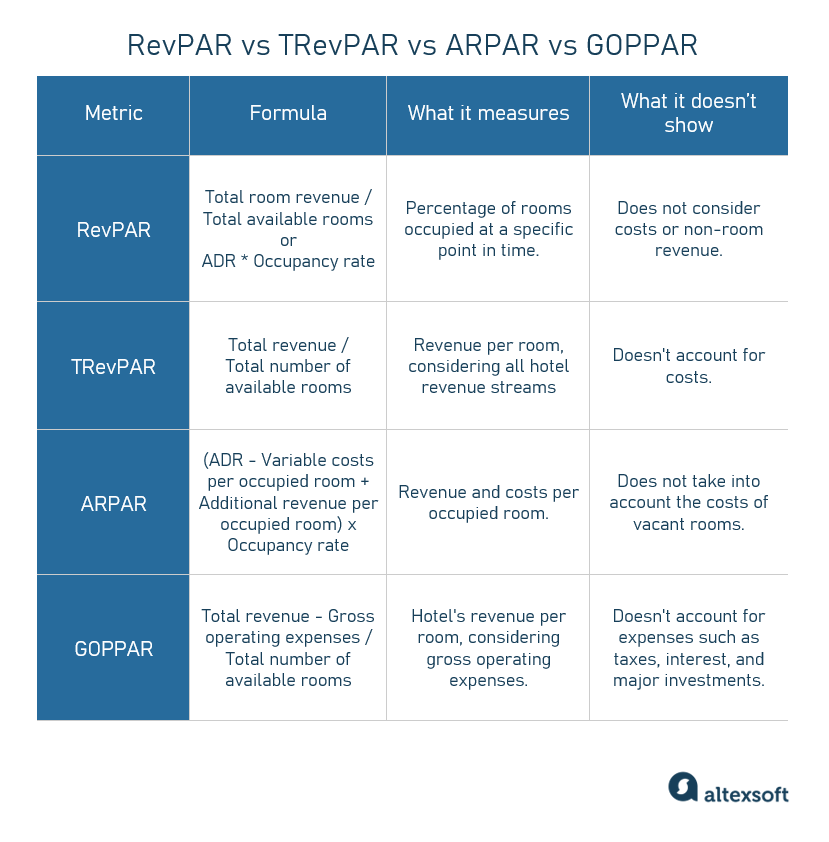
Direct Answer
Why Hotel Management Measures Differently
Hotel operations are capital-intensive, with fixed costs (real estate, utilities, labor) that don't scale linearly with occupancy. A 70% occupancy hotel with high ADR can still lose money if its TRevPAR is low because guests aren't spending on food, beverage, or services. Conversely, a budget hotel with 90% occupancy and low ADR can be highly profitable if its TRevPAR is driven by high-margin items like parking fees or breakfast.
The industry’s shift from RevPAR to TRevPAR mirrors the rise of "asset-light" management models (e.g., Marriott, Hilton) where owners care about total profit, not just room revenue. Gartner reports that hotels using TRevPAR as their primary KPI see 12-18% higher EBITDA than those focused only on RevPAR.
This is because TRevPAR forces operators to optimize every revenue-generating asset—meeting rooms, restaurants, spas—rather than just filling beds.
The Most Important KPIs to Track
RevPAR (Revenue Per Available Room)
- Formula:
RevPAR = ADR × Occupancy RateorTotal Room Revenue ÷ Available Rooms - What it measures: Pure room revenue efficiency. A $200 RevPAR means each available room generated $200 in room sales, regardless of occupancy.
- Benchmarks:
- Luxury: $300–$600+ (e.g., Four Seasons NYC: $550)
- Midscale: $80–$150 (e.g., Hampton Inn: $110)
- Economy: $40–$70 (e.g., Motel 6: $55)
- Use case: Daily pricing decisions, competitor comparison, and short-term ADR adjustments. STR (Smith Travel Research) benchmarks RevPAR against comp sets.
TRevPAR (Total Revenue Per Available Room)
- Formula:
TRevPAR = Total Hotel Revenue ÷ Available Rooms
Total revenue includes rooms, F&B, spa, parking, retail, meeting space, and other ancillaries.
- What it measures: The hotel’s ability to monetize every guest touchpoint. A TRevPAR of $350 means each room generated $350 in total revenue.
- Benchmarks:
- Full-service luxury: $400–$700+ (e.g., Wynn Las Vegas: $620)
- Select-service: $150–$250 (e.g., Hyatt Place: $180)
- Extended-stay: $120–$200 (e.g., Residence Inn: $160)
- Use case: Profitability analysis, investment decisions, and evaluating non-room revenue streams. Winning by Design data shows that hotels with TRevPAR > $300 have 2.3x higher GOP margins than those below $200.
GOPPAR (Gross Operating Profit Per Available Room)
- Formula:
GOPPAR = (Total Revenue – Total Departmental Expenses) ÷ Available Rooms - What it measures: True profit after direct costs. A $120 GOPPAR means each room contributed $120 to cover fixed costs and generate net profit.
- Benchmarks: Luxury hotels aim for GOPPAR > $100; midscale targets $40–$60.
EBITDA per Room
- Formula:
EBITDA per Room = (EBITDA) ÷ Number of Rooms - What it measures: Cash flow from operations before financing and taxes. Used by lenders and investors.
Conversion Rate (Ancillary Revenue %)
- Formula:
(Non-Room Revenue ÷ Total Revenue) × 100 - Benchmark: Full-service hotels target 35–50% from non-room sources. A 40% conversion rate means 40 cents of every dollar comes from F&B, spa, etc.
Real Operators
1. Marriott International Uses TRevPAR as a core metric for its managed hotels. In 2023, Marriott reported system-wide TRevPAR of $245 (up 8% YoY) vs. RevPAR of $165. Their focus on F&B and meeting space drove the gap. Marriott’s "TRevPAR per Available Room" is a key input for owner distributions.
2. Accor's Luxury Portfolio (e.g., Raffles, Fairmont) Accor tracks TRevPAR aggressively. At the Fairmont San Francisco, TRevPAR hit $480 in Q2 2024, with 55% from non-room revenue (banquets, spa, restaurants). They use Clari for revenue forecasting across all streams, not just rooms.
3. Red Roof Inn (Economy) This chain focuses on RevPAR because their ancillary revenue is minimal (no F&B, limited services). Their 2023 RevPAR was $58, but they achieve 22% EBITDA margins by keeping costs low. For them, RevPAR is sufficient.
4. The Ritz-Carlton, Naples A luxury resort where TRevPAR is paramount. In peak season, TRevPAR exceeds $900, with 60% from spa, dining, and golf. Their Salesforce CRM tracks guest spending across all outlets, enabling personalized upsells that boost TRevPAR by 15%.
Failure Modes
1. RevPAR Myopia Focusing only on RevPAR leads to underinvestment in high-margin ancillaries. Example: A hotel with $180 RevPAR but $0 in F&B revenue could be losing $20 per room in potential profit.
Gong recorded a sales call where a hotel owner rejected a $500k restaurant renovation because "RevPAR is fine." That hotel’s GOP margin was 18% vs. Industry average of 35%.
2. TRevPAR Without Cost Control Chasing TRevPAR without managing costs can destroy profit. A hotel that spends $1 to generate $1.10 in F&B revenue has a 10% margin, while a room-only hotel might have 70% margin. Outreach data shows that hotels with high TRevPAR but low GOPPAR often have bloated F&B departments.
3. Ignoring Seasonality Using annual TRevPAR averages masks seasonal losses. A ski resort might have $600 TRevPAR in winter but $100 in summer. Without monthly TRevPAR tracking, owners miss opportunities to cut costs in off-peak.
4. Benchmarking Against Wrong Comp Set Comparing a full-service hotel’s RevPAR to a limited-service hotel’s RevPAR is meaningless. Always benchmark TRevPAR against properties with similar service levels.
5. Over-Reliance on ADR Pushing ADR too high can lower occupancy and crush TRevPAR if ancillaries suffer. A hotel that raises ADR by 10% but loses 15% of F&B revenue may see TRevPAR drop.
Reporting Cadence
- Daily: RevPAR, Occupancy, ADR. Track in Salesforce or Duetto for dynamic pricing.
- Weekly: TRevPAR, Ancillary Revenue per Room. Use Clari to forecast weekly trends.
- Monthly: GOPPAR, EBITDA per Room, Conversion Rate. Present in Tableau dashboards.
- Quarterly: TRevPAR vs. Comp set, year-over-year trends. Review with ownership.
- Annually: Full P&L analysis, capital allocation based on TRevPAR growth.
30-60-90
Days 1–30: Audit & Baseline
- Pull 12 months of RevPAR and TRevPAR data from your PMS (e.g., Oracle Opera, Mews).
- Calculate current GOPPAR and EBITDA per room.
- Identify top 3 revenue streams by margin (e.g., rooms at 70% margin, spa at 50%, F&B at 30%).
Days 31–60: Optimize Revenue Mix
- Implement a Salesforce CRM to track guest spending across outlets.
- Use Gong to analyze sales calls for upselling opportunities (e.g., "Would you like a spa package?").
- Run a pricing test: lower ADR by 5% for two weeks and measure TRevPAR impact.
Days 61–90: Institutionalize TRevPAR
- Create a weekly TRevPAR dashboard in Tableau with alerts for drops below 80% of budget.
- Train front desk and F&B teams on cross-selling (e.g., "Your dinner reservation is confirmed, would you like to add a wine pairing?").
- Present a TRevPAR-based budget to ownership, showing how a 10% TRevPAR increase yields 15% GOPPAR growth.
FAQ
? Why is TRevPAR better than RevPAR for profitability?
Because TRevPAR includes all revenue streams. A hotel with high RevPAR but low TRevPAR may have empty restaurants and unused meeting space, which are fixed costs that drain profit.
? What is a good TRevPAR benchmark for a 200-room full-service hotel?
$250–$350 is average; $400+ is excellent. For luxury, $500+ is top quartile.
? How do I increase TRevPAR without raising room rates?
Focus on ancillaries: add parking fees, upsell spa packages, optimize F&B menu pricing, and use dynamic pricing for meeting rooms. Clari forecasting can identify underperforming revenue streams.
? Can RevPAR be used for budget hotels?
Yes, because budget hotels have minimal ancillary revenue. RevPAR is sufficient for them. But even then, TRevPAR can reveal opportunities (e.g., vending machine revenue, late checkout fees).
? What’s the relationship between TRevPAR and GOPPAR?
TRevPAR is top-line; GOPPAR is bottom-line. A high TRevPAR with low GOPPAR means costs are out of control. Aim for a GOPPAR/TRevPAR ratio of 35–45% for healthy operations.
? How often should I report TRevPAR to ownership?
Monthly at minimum, weekly for high-revenue properties. Use Tableau for real-time dashboards.
Sources
- STR (Smith Travel Research) – RevPAR and TRevPAR Benchmarks
- Winning by Design – Hotel Profitability Metrics
- Gartner – Hospitality KPI Trends Report
- Marriott International 2023 Annual Report (TRevPAR Data)
- Clari – Revenue Forecasting for Hotels
- Salesforce – Hotel CRM and Revenue Optimization
- Duetto – Dynamic Pricing and RevPAR Management
- Gong – Revenue Team Analysis for Hospitality