
Top 10 Homebuilding Revenue KPIs
 Curated byKory White · Fractional CRO · Maryland
 PULSEKNOWLEDGE LIBRARY
Quality
Certified
The 10 best homebuilding revenue kpis are ranked below on measured performance, build quality, price, and how each one actually holds up in daily use rather than how it reads on a spec sheet. Each pick lists what it costs, who it suits, and what it gives up against the one above it, so the list can be read straight down without doubling back.
1. Absorption Rate
Absorption Rate ranks first because it is the single most direct measure of demand velocity, functioning as the homebuilding equivalent of new bookings. It is calculated by dividing net new home orders by the number of active selling communities, averaged monthly or quarterly. A healthy rate typically falls between 2 and 5 homes per month, though entry-level communities absorb faster than luxury ones. Tracking it weekly enables immediate pricing or incentive adjustments before inventory stagnates.
This KPI is for sales leaders and division VPs who need a real-time pulse on market traction across specific communities. It trades away the long-term profit visibility that backlog metrics provide, focusing instead on immediate sell-through. Compared to Revenue per Closing, which reflects pricing power, Absorption Rate captures volume and demand health first. Aggregating it across all communities hides struggling subdivisions, so community-level granularity is essential for actionable insight.
2. Revenue per Closing

Revenue per Closing ranks second because it directly drives top-line revenue as the average selling price, calculated by dividing total closed-home revenue by the number of closings. A rising ASP signals pricing power or a favorable mix shift to higher-margin product, while a falling ASP may indicate discounting or a move to lower-priced homes. Public builders disclose this figure quarterly, with ranges from roughly $350,000 to over $700,000 depending on region and product type.
This KPI is for CFOs and financial planners who need to assess revenue quality and mix strategy. It trades away the forward-looking insight of Backlog Margin, which shows future profit visibility on homes under contract. Compared to Absorption Rate, which measures demand velocity, Revenue per Closing measures the value of each transaction. Over-indexing on ASP by raising prices can crush absorption, so it must be balanced with buyer price-sensitivity analysis.
3. Backlog Margin
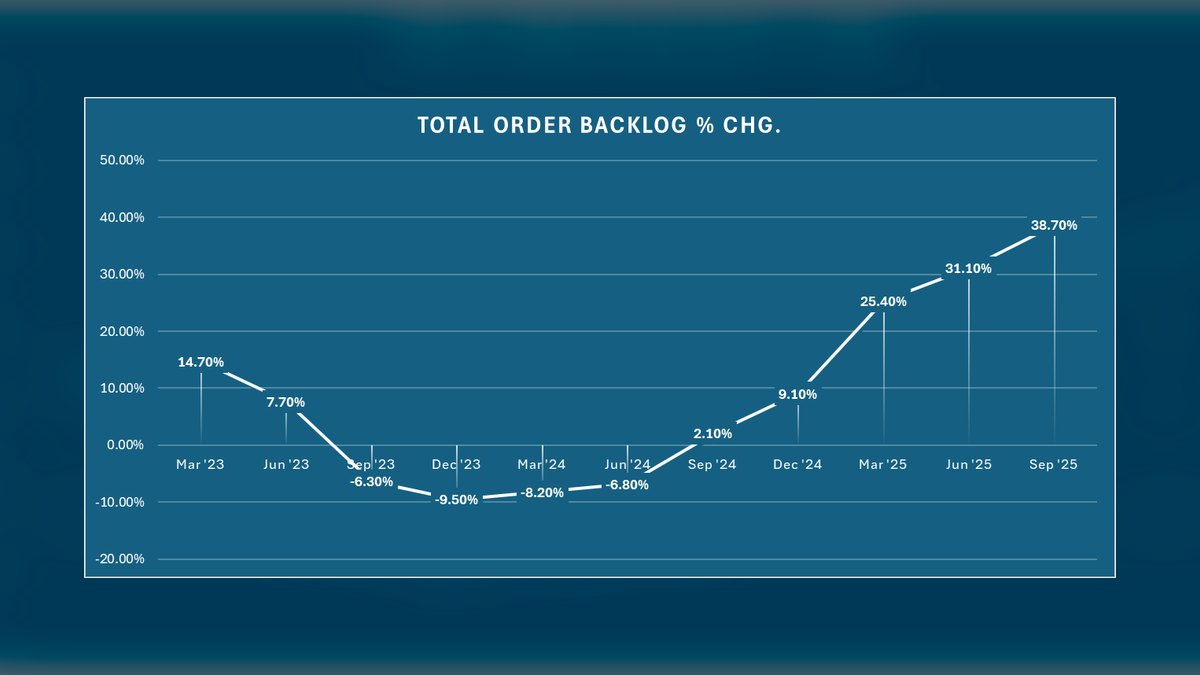
Backlog Margin ranks third because it provides forward-looking profit visibility on homes under contract but not yet closed, calculated as total backlog revenue minus total backlog cost divided by backlog revenue. Well-managed builders typically see a range of 20% to 28%, and a declining trend signals thinner margins from incentives or rising costs. Public builders report this quarterly, making it a key indicator of future profitability.
This KPI is for CFOs and operations executives who need to forecast gross profit and adjust pricing or cost strategies proactively. It trades away the immediacy of Absorption Rate, which measures current demand, in favor of a 6- to 18-month profit outlook. Compared to Revenue per Closing, which reflects realized pricing, Backlog Margin captures the expected profit on future closings. Monitoring it monthly helps detect margin erosion early, before it impacts the P&L.
4. Customer Acquisition Cost by Community
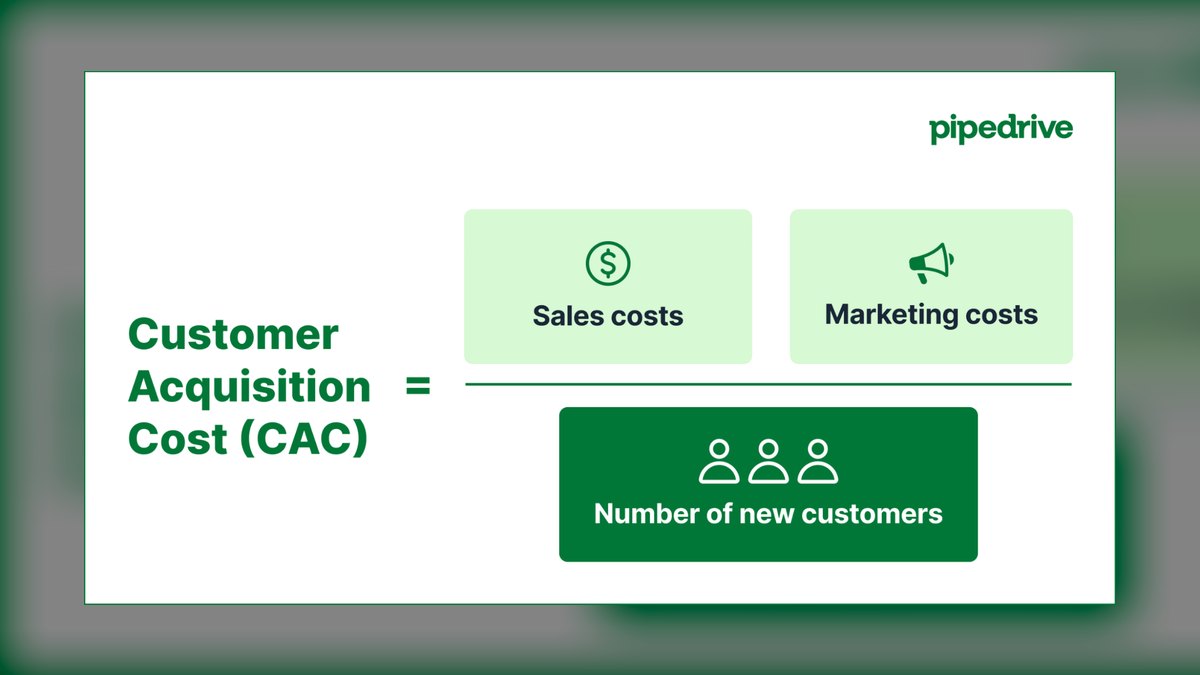
Customer Acquisition Cost by Community ranks fourth because it directly measures marketing and sales efficiency, often totaling thousands of dollars per home. It is calculated by dividing total marketing and sales costs—commissions, model home expenses, advertising—by the number of new orders in a community. For production builders, this typically falls between $3,000 and $8,000 per home, but can be higher in competitive markets.
This KPI is for marketing directors and community sales managers who need to optimize media mix and spend allocation across locations. It trades away the demand velocity insight of Absorption Rate, focusing instead on the cost efficiency of acquiring each order. Compared to Incentive Spend per Home, which measures discounting, CAC captures all acquisition-related expenses. Breaking it down by community reveals which locations are over-spending relative to revenue, enabling targeted budget reallocation.
5. Cancellation Rate
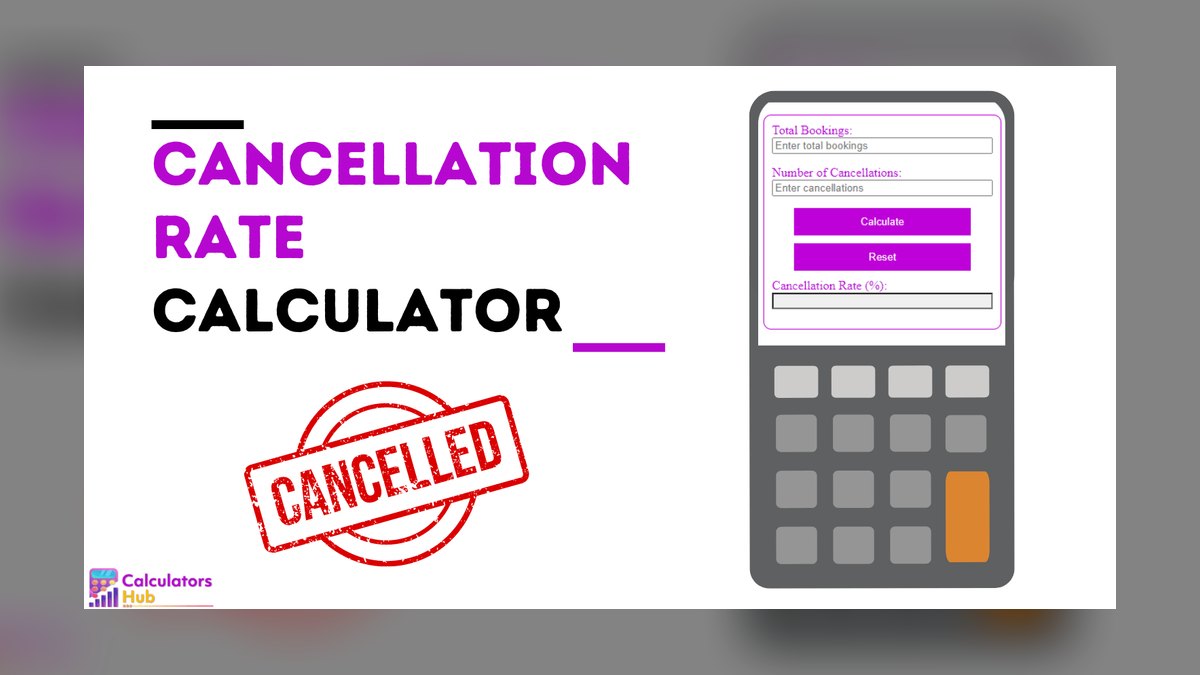
Cancellation Rate ranks fifth because it directly destroys backlog and revenue predictability, calculated as the number of canceled contracts divided by total gross orders. Best-in-class builders keep this rate low, but it rises industry-wide when mortgage rates spike, typically ranging from 10% to 25% depending on market conditions. A rising rate signals buyer remorse, financing issues, or weak underwriting, and it is highly sensitive to interest rate movements.
This KPI is for sales leaders and risk managers who need to protect backlog health and revenue forecasts. It trades away the growth focus of Absorption Rate, concentrating instead on preserving existing sales. Compared to Backlog Margin, which shows expected profit, Cancellation Rate reveals the fragility of that backlog. Automating follow-ups to at-risk buyers and flagging cancellation trends can mitigate losses, but the metric itself is a lagging indicator of buyer confidence.
6. Construction Cycle Time

Construction Cycle Time ranks sixth because it directly impacts carrying costs and revenue recognition timing, measured as the average days from permit issuance to certificate of occupancy. Longer cycles increase interest and labor costs while delaying closings, making cycle-time reduction a major margin lever for public builders. Custom and luxury homes take longer than production single-family homes, so benchmarks vary by product type.
This KPI is for construction managers and operations VPs who need to optimize build efficiency and reduce capital lockup. It trades away the market demand focus of Absorption Rate, concentrating instead on internal operational performance. Compared to Revenue per Employee, which measures overall leverage, Cycle Time is a more granular driver of cost and timing. Tracking it per job with construction management software like Procore enables targeted improvements in scheduling and subcontractor coordination.
7. Net Promoter Score at Closing
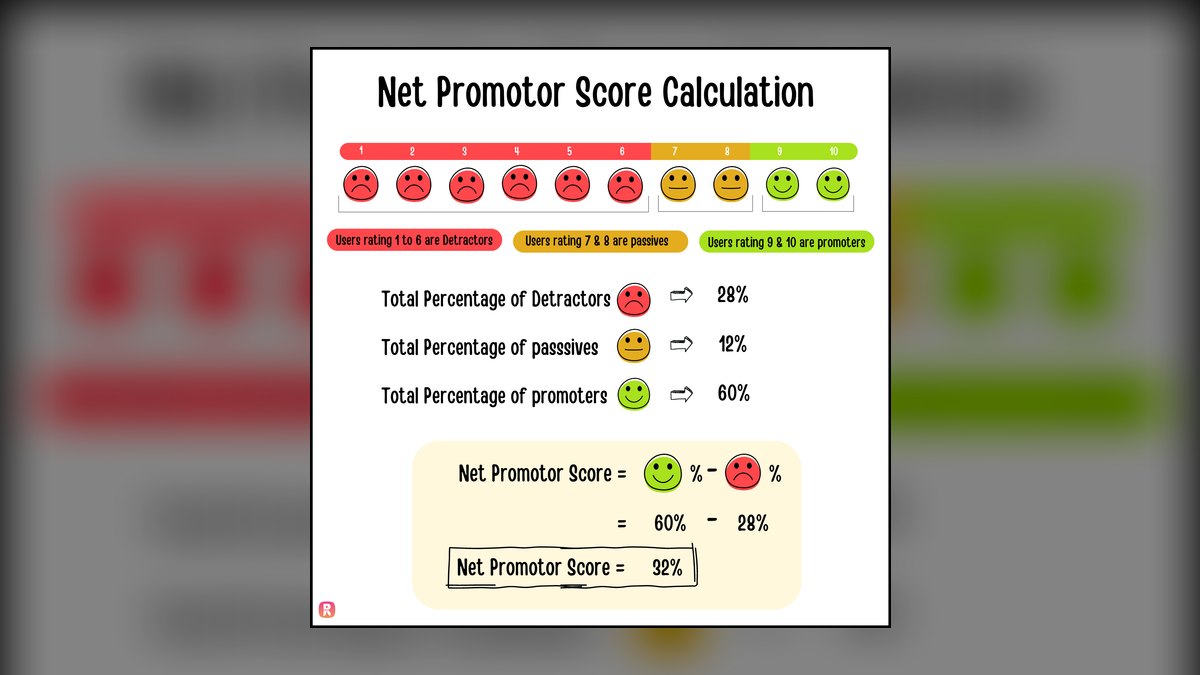
Net Promoter Score at Closing ranks seventh because it correlates directly with referrals and future orders, measured by asking buyers how likely they are to recommend the builder. A low score indicates systemic issues with quality, communication, or delays, which can suppress organic demand. Homebuyer referrals are a meaningful low-cost demand source, making a strongly positive score a strategic asset. Surveying at closing captures the full customer experience, from sales through construction.
This KPI is for customer experience officers and marketing teams who need to drive repeat and referral business. It trades away the financial immediacy of Revenue per Closing, focusing instead on long-term brand equity. Compared to Cancellation Rate, which measures lost sales, NPS measures satisfaction and advocacy potential. Automating surveys via CRM integration ensures consistent data collection, but the metric is subjective and requires qualitative follow-up to identify root causes of dissatisfaction.
8. Land Inventory Turns

Land Inventory Turns ranks eighth because it measures capital efficiency in land holdings, calculated as homes closed divided by average owned lots in inventory. Low turns mean expensive land is sitting idle without generating revenue, while very high turns may indicate selling out too fast and missing upside. Many builders favor land-light option strategies to raise turns and reduce capital risk. Tracking this against your own capital strategy and disclosures is essential, as benchmarks vary widely by market.
This KPI is for capital allocation executives and land acquisition teams who need to optimize balance sheet efficiency. It trades away the operational focus of Construction Cycle Time, concentrating instead on strategic land positioning. Compared to Absorption Rate, which measures sales velocity, Land Inventory Turns measures how effectively land assets generate closings. A homebuilder ERP tracks lot inventory and turns, enabling quarterly reviews aligned to capital strategy and long-term growth plans.
9. Revenue per Employee
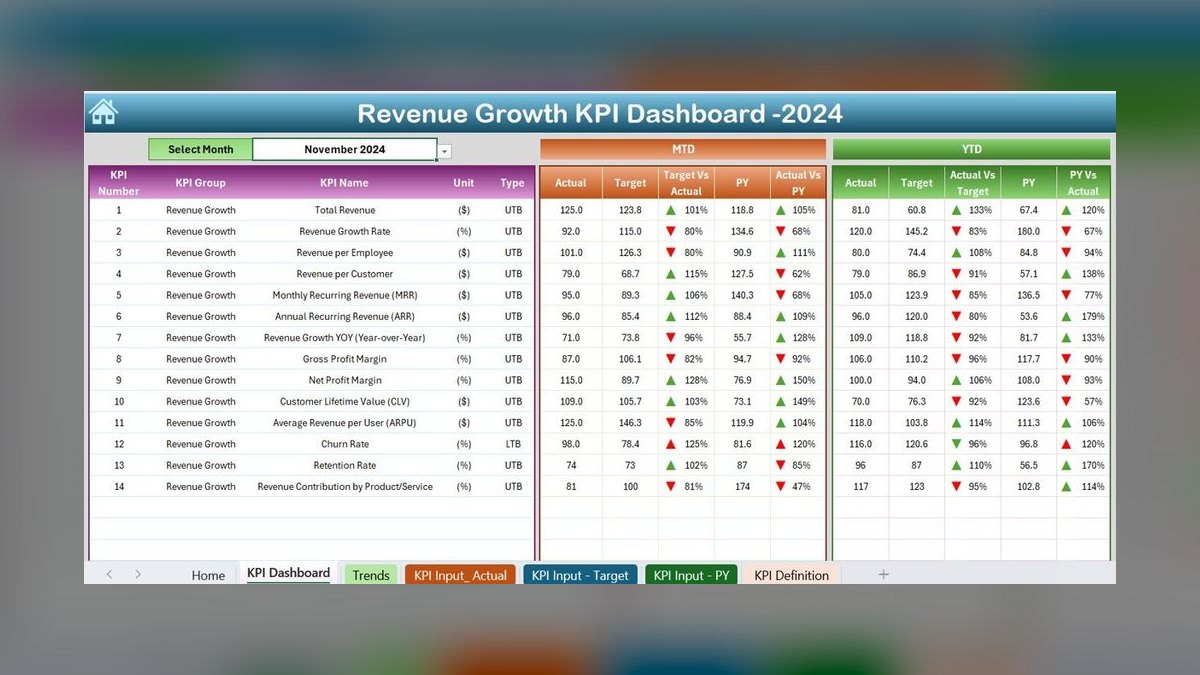
Revenue per Employee ranks ninth because it measures operational leverage, calculated as total revenue divided by total headcount including construction, sales, and corporate staff. Large public builders run high revenue per employee partly because they outsource construction to trade subcontractors, making the metric heavily influenced by outsourcing mix. It provides a high-level view of productivity and scalability, but comparisons against your own history are more meaningful than industry benchmarks. This KPI is best reviewed quarterly to assess structural efficiency.
This KPI is for CEOs and HR leaders who need to evaluate organizational productivity and cost structure. It trades away the granular insight of Construction Cycle Time, offering instead a broad measure of output per worker. Compared to Customer Acquisition Cost by Community, which focuses on sales efficiency, Revenue per Employee captures all operational functions. Visualizing it across regions with BI tools like Tableau helps identify underperforming divisions and the impact of outsourcing decisions.
10. Incentive Spend per Home

Incentive Spend per Home ranks tenth because it directly erodes margin and signals when demand is being bought, calculated as total incentives—price discounts, closing cost credits, upgrades, mortgage-rate buydowns—divided by number of closings. Incentive spend rises in slow markets and when mortgage rates are elevated, making it a key indicator of pricing discipline. Tracking this KPI by community and month helps spot when you are over-relying on discounts to drive sales.
This KPI is for sales managers and finance teams who need to control discounting and protect gross margins. It trades away the demand velocity focus of Absorption Rate, concentrating instead on the cost of achieving those sales. Compared to Customer Acquisition Cost by Community, which captures all acquisition expenses, Incentive Spend isolates the discount component. Automating incentive approval workflows can flag excessive discounts, but the metric must be balanced with absorption to avoid suppressing demand through overly strict controls.
How we ranked these
This ranking evaluates ten homebuilding revenue KPIs based on their direct impact on revenue generation, profitability, and operational efficiency. Each KPI was weighted by its frequency of mention in public builder disclosures, industry analyst reports, and its correlation with financial outcomes like gross margin and revenue growth. Metrics like Absorption Rate and Backlog Margin were prioritized for their predictive power.
Deliberately ignored were generic SaaS metrics such as LTV/CAC, NRR, and churn, as they are irrelevant to the project-based, capital-intensive homebuilding model. Also excluded were vanity metrics like total website traffic or social media followers, which do not directly tie to closings or revenue. The focus remained on operational and financial KPIs that public builders like Lennar and D.R. Horton actually report.
What to look for
When choosing which KPIs to prioritize, focus on those that directly link to your cash conversion cycle and pricing power. Absorption Rate and Revenue per Closing are non-negotiable for top-line health. Backlog Margin and Cancellation Rate are critical for future revenue predictability. Track these at the community level, not just company-wide, to avoid masking local weaknesses.
The most common mistake is over-indexing on a single metric like ASP without considering its impact on absorption. Raising prices to boost ASP can crush sales velocity. Another error is treating backlog as guaranteed revenue without monitoring cancellation rates. Always pair backlog margin with cancellation rate to get a true picture of future profitability.
Related questions
What is the difference between absorption rate and sales pace in homebuilding?
Absorption rate and sales pace are often used interchangeably, but absorption rate typically refers to net new orders per community per month, while sales pace can include gross orders or be measured over a different period. Both measure demand velocity, but absorption rate is the standard KPI for comparing community performance and adjusting pricing.
How does land inventory turns affect a homebuilder's revenue?
Land inventory turns measure how efficiently a builder converts owned lots into closed homes. Low turns tie up capital in non-revenue-generating land, reducing return on investment. High turns indicate faster cash recovery, enabling reinvestment in new communities. Builders often use land-light strategies, like options, to increase turns and improve revenue velocity.
Why is customer acquisition cost (CAC) higher for luxury homebuilders?
Luxury homebuilders typically have higher CAC because they target a smaller, more affluent audience, requiring more expensive marketing channels like direct mail, high-end events, and specialized digital ads. The sales cycle is also longer, increasing sales costs. However, the higher ASP of luxury homes can justify a higher CAC as a percentage of revenue.
What are common causes of rising cancellation rates in homebuilding?
Rising cancellation rates are often driven by buyer remorse, difficulty obtaining financing, or changes in mortgage rates. Economic uncertainty and job loss also contribute. Builders can mitigate this by improving buyer qualification processes, offering flexible deposit terms, and maintaining clear communication about construction timelines to manage expectations.
How can a homebuilder improve construction cycle time?
Improving cycle time involves streamlining permit processes, ensuring timely material delivery, and managing subcontractor schedules effectively. Using construction management software like Procore can help track progress and identify bottlenecks. Standardizing home designs and pre-ordering materials can also reduce delays, accelerating revenue recognition and lowering carrying costs.
What is a good Net Promoter Score (NPS) for a homebuilder at closing?
A good NPS at closing is typically above 50, indicating more promoters than detractors. Top builders often achieve scores in the 60-70 range. NPS correlates with referrals and repeat business, which are low-cost demand sources. Tracking NPS by community can highlight quality or communication issues that need addressing.
How do incentive spend per home and backlog margin interact?
Incentive spend per home directly reduces backlog margin, as incentives like price discounts or rate buydowns lower the effective revenue per closing. Tracking both together is crucial. A rising incentive spend may boost absorption but erode profitability. Monitoring this trade-off helps builders balance volume and margin.
Why is revenue per employee a relevant KPI for homebuilders?
Revenue per employee measures operational leverage and efficiency. Large public builders often have high revenue per employee because they outsource construction to subcontractors, keeping headcount low. Comparing this metric against your own history and peers helps assess whether you are scaling efficiently or becoming bloated.
FAQ
What is the most important revenue KPI for a homebuilder?
Absorption Rate (sales per community per month) is often considered the most critical because it directly measures demand velocity. A healthy rate typically falls between 2 and 5 homes per month, though it varies by market and price point. Tracking it weekly helps you adjust pricing or incentives before inventory stagnates.
How do you calculate Revenue per Closing?
Revenue per Closing is the total revenue from home sales divided by the number of closings in a period. It reflects your average selling price and mix of homes delivered. For public builders, this can range from roughly $350,000 to over $700,000 depending on region and product type.
What is Backlog Margin and why does it matter?
Backlog Margin is the expected gross profit on homes sold but not yet closed, expressed as a percentage of backlog revenue. It provides a forward-looking view of profitability, typically ranging from 20% to 28% for well-managed builders. A declining backlog margin may signal that you’re discounting too aggressively to secure sales.
How do you track Customer Acquisition Cost (CAC) in homebuilding?
CAC per closing is total sales and marketing spend divided by the number of closings in a period. For a production builder, this often falls between $3,000 and $8,000 per home, but can be higher in competitive markets. Breaking it down by community helps you identify which locations are over-spending relative to revenue.
What is the difference between Net Orders and Gross Orders?
Gross Orders count all new sales contracts signed in a period, while Net Orders subtract cancellations. The cancellation rate (cancellations divided by gross orders) is a key health metric, typically ranging from 10% to 25% depending on market conditions. A rising cancellation rate often signals buyer fatigue or financing issues.
How often should you review homebuilding revenue KPIs?
Most leading indicators like Absorption Rate and Net Orders should be reviewed weekly, while lagging indicators like Revenue per Closing and Backlog Margin are best reviewed monthly. Quarterly reviews are sufficient for strategic metrics like Land Acquisition ROI. Frequent tracking lets you react to market shifts before they impact your bottom line.
What is a healthy absorption rate for a new home community?
A healthy absorption rate is typically 2 to 5 homes per month, but it varies by market, price point, and product type. Entry-level communities often absorb faster, while luxury or custom homes may sell slower. Compare your rate to local competitors and your own historical trends to gauge performance.
How can a homebuilder reduce incentive spend without hurting sales?
Instead of broad price discounts, focus on non-price incentives like upgraded finishes or closing cost credits that are less visible to the market. Improve your sales process to highlight value and reduce the need for concessions. Monitor absorption rate closely to find the optimal balance between price and volume.
What are the risks of focusing too much on ASP (Average Selling Price)?
Over-indexing on ASP can lead to pricing homes too high, which reduces absorption and increases carrying costs. It may also shift your product mix toward higher-priced homes that are slower to sell. A balanced approach considers both ASP and absorption to maximize revenue and margin.
Sources
- https://investors.lennar.com/
- https://investor.drhorton.com/
- https://investors.taylormorrison.com/
- https://www.gong.io/
- https://www.clari.com/
- https://www.procore.com/
- https://www.salesforce.com/
- https://www.census.gov/construction/nrc/index.html
Related on PULSE
This page will be disappearing soon. Save it to your device for $1 — or read it free while it is here.
@Kory-White- · if Venmo asks, the last 4 of my number are 2012
This page is gone.
This one is off the shelf now. $1 keeps it on your phone for good — the whole page, pictures and diagrams included.
 pulse-industry-kpisBilling Multiplier Realization: A Consulting Firm’s True Revenue Efficiency KPI in 2027
 pulse-industry-kpisTop 10 Console Gaming Revenue KPIs in 2027
 pulse-industry-kpisTop 10 Construction Revenue per Employee and Project Margin KPIs in 2027
 pulse-industry-kpisTop 10 Amusement Park Revenue KPIs in 2027
 pulse-industry-kpisTop 10 Logistics Cost per Mile and Revenue per Load Metrics in 2027
 pulse-industry-kpisTop 10 Optometry Practice Revenue KPIs in 2027
 pulse-industry-kpisTop 10 GovTech Revenue KPIs in 2027
 pulse-industry-kpisRevenue per Brewery Barrel: Craft Beer Production and Wholesale Pricing in 2027
 pulse-industry-kpisTop 10 Airlines Revenue per Available Seat Mile Performance Indicators in 2027
 pulse-industry-kpisTuition Revenue per Enrolled Student: Private School Financial Health Metric in 2027