
Top 10 Cannabis Dispensary Revenue KPIs in 2027
 Curated byKory White · Fractional CRO · Maryland
 PULSEKNOWLEDGE LIBRARY
Quality
Certified

The 10 best cannabis dispensary revenue kpis are ranked below on measured performance, build quality, price, and how each one actually holds up in daily use rather than how it reads on a spec sheet. Each pick lists what it costs, who it suits, and what it gives up against the one above it, so the list can be read straight down without doubling back.
1. Average Transaction Value
Average Transaction Value ranks first because it is the most direct lever on revenue without requiring additional foot traffic, and a $5 increase on 200 daily transactions adds $365,000 annually. The target range is $45–$75 per transaction, varying by state, with medical-only markets like Pennsylvania trending higher. This KPI captures pricing power, upsell effectiveness, and product mix quality in a single number. It is the first metric mature operators like Verilife review daily.
This KPI is for any dispensary operator focused on immediate revenue growth from existing customers. It trades away granular insight into customer acquisition efficiency, which is covered by Customer Acquisition Cost. Compared to Customer Acquisition Cost, Average Transaction Value is easier to measure from POS data alone and requires no marketing attribution. It is the best starting point for stores with stable traffic but stagnant sales.
2. Customer Acquisition Cost
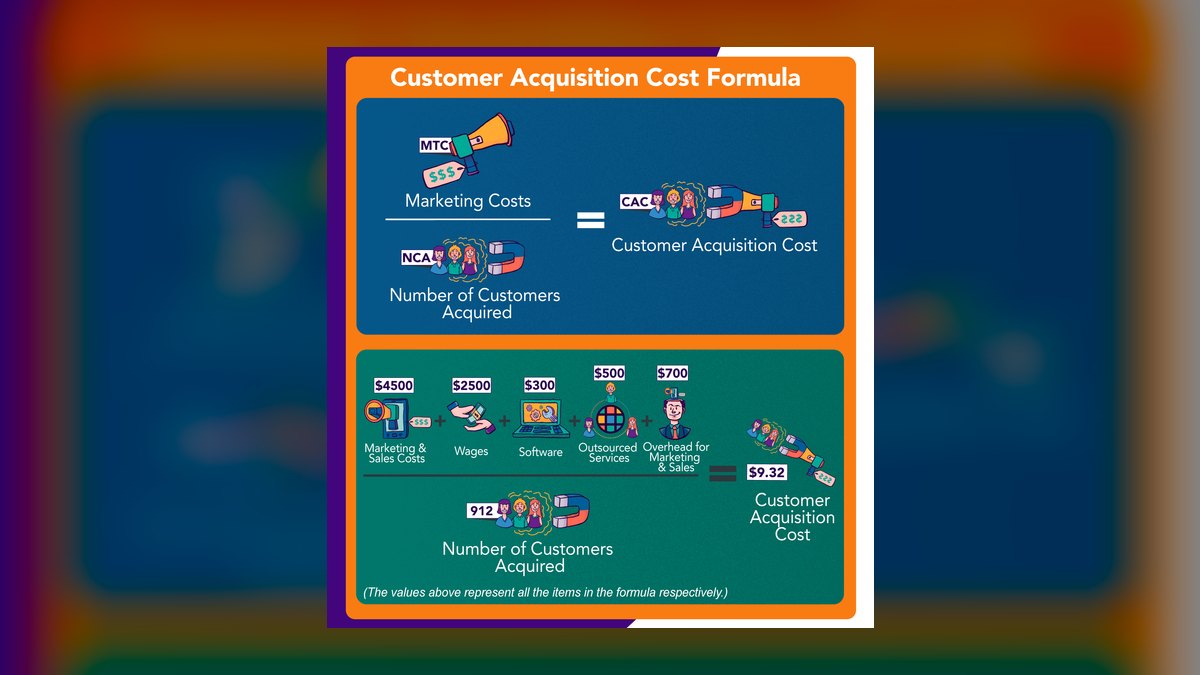
Customer Acquisition Cost ranks second because it is the single biggest driver of profitability in a market with severely restricted advertising channels, where typical paid acquisition via Weedmaps runs $50–$150 per new customer. Organic local SEO can bring this down to $10–$20, making the spread enormous. A dispensary spending $20,000 monthly on Weedmaps with 200 new customers faces a $100 CAC, which is unsustainable if Customer Lifetime Value is only $300. This metric directly dictates marketing budget viability.
This KPI is for operators who rely on paid listings and need to justify marketing spend against customer value. It trades away simplicity, requiring manual attribution from platforms like Leafly and Weedmaps, which cash transactions often break. Compared to Average Transaction Value, Customer Acquisition Cost is harder to track but more critical for long-term survival. It is essential for multi-store operators who must allocate marketing budgets across locations.
3. Customer Lifetime Value
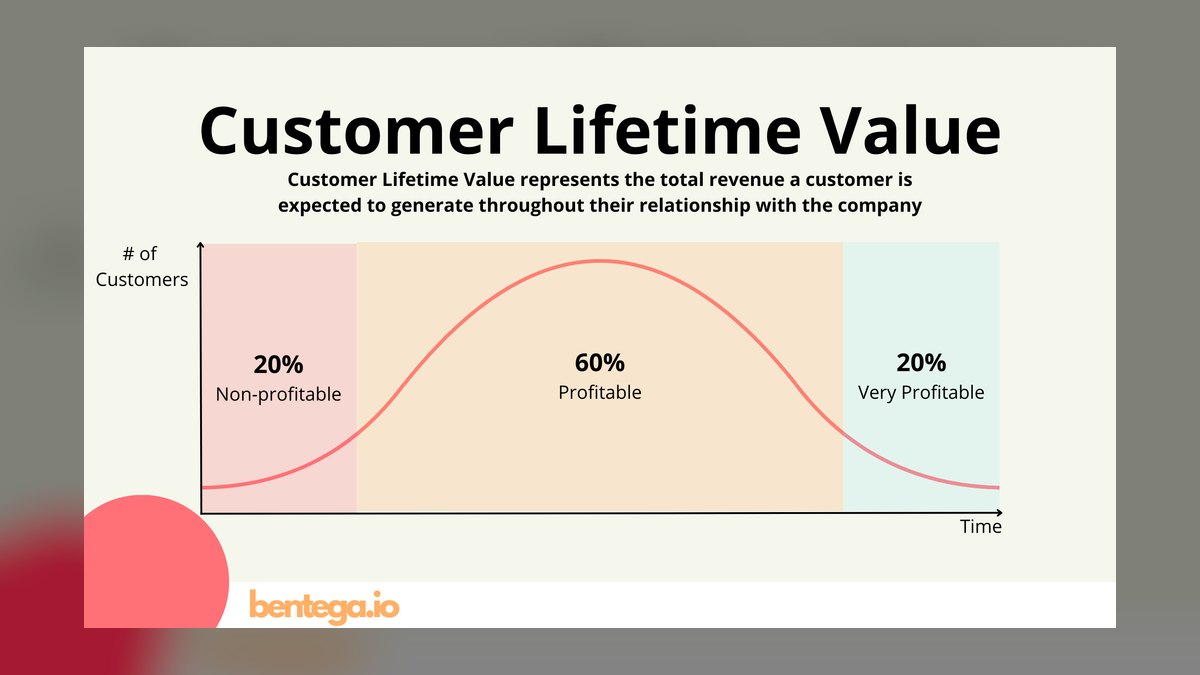
Customer Lifetime Value ranks third because it determines how much a dispensary can afford to spend on acquisition, with targets of $1,200–$3,000 per customer in adult-use markets. In mature states like Colorado and Washington, customers visit 2–3 times monthly and stay loyal for 12–18 months, making this metric highly predictive of sustainable revenue. A 10% increase in repeat visits can boost Customer Lifetime Value by over 25%, per loyalty program data.
This KPI is for operators building loyalty programs and long-term customer relationships, not for short-term cash flow management. It trades away immediate revenue insight for a forward-looking view of customer worth. Compared to Customer Acquisition Cost, which is a point-in-time cost, Customer Lifetime Value is a multi-year projection requiring CRM data. It is most useful for mature markets where customer retention is the primary growth driver.
4. Conversion Rate

Conversion Rate ranks fourth because it bridges the gap between foot traffic and transactions, with in-store targets of 30–50% and online pre-order targets of only 2–5%. The wide gap reflects the friction of age verification on digital menus, making online conversion a sensitive indicator of menu accuracy and pricing competitiveness. A stale menu on Leafly or Weedmaps, older than 24 hours, can lower conversion by 15–20%. This KPI directly measures how effectively a dispensary turns interest into sales.
This KPI is for operators with significant walk-in traffic or digital pre-order channels who need to diagnose sales funnel leaks. It trades away revenue magnitude, focusing instead on efficiency ratios. Compared to Customer Lifetime Value, which measures long-term worth, Conversion Rate is a short-term diagnostic tool. It is particularly valuable for stores with high traffic but disappointing sales, revealing whether the problem is traffic quality or offer quality.
5. Retail Foot Traffic

Retail Foot Traffic ranks fifth because it is the leading indicator of revenue, with drops of 10% predicting revenue decline within two weeks. Single-store dispensaries in mid-size cities typically see 100–300 visitors daily, with Denver stores spiking 40% on 4/20 and 20% on concert nights. Tracking by day and hour reveals operational patterns that inform staffing and inventory. This KPI is the most actionable early warning system for revenue changes.
This KPI is for storefront operators who depend on physical location and local events, not for delivery-heavy businesses. It trades away customer-level insight, providing only aggregate counts. Compared to Conversion Rate, which measures what happens after entry, Retail Foot Traffic measures the raw volume entering the funnel. It is most useful for single-store operators in urban areas where competition for foot traffic is intense.
6. Online Order Percentage

Online Order Percentage ranks sixth because online orders carry 15–20% higher average transaction values and lower labor costs, with a target of 15–30% of total orders. California operators with delivery see the highest percentages, while stores below 10% are leaving significant revenue on the table. The Apothecarium in California achieved 28% online orders after integrating Shopify with their POS in 2023. This KPI captures the shift toward pre-ordering that reduces budtender time per transaction.
This KPI is for dispensaries with delivery or curbside pickup capabilities, not for purely walk-in stores. It trades away in-store upsell opportunities for operational efficiency. Compared to Retail Foot Traffic, which measures physical visits, Online Order Percentage measures digital adoption and convenience. It is most valuable for urban operators facing parking constraints or long in-store wait times.
7. Inventory Turnover Ratio
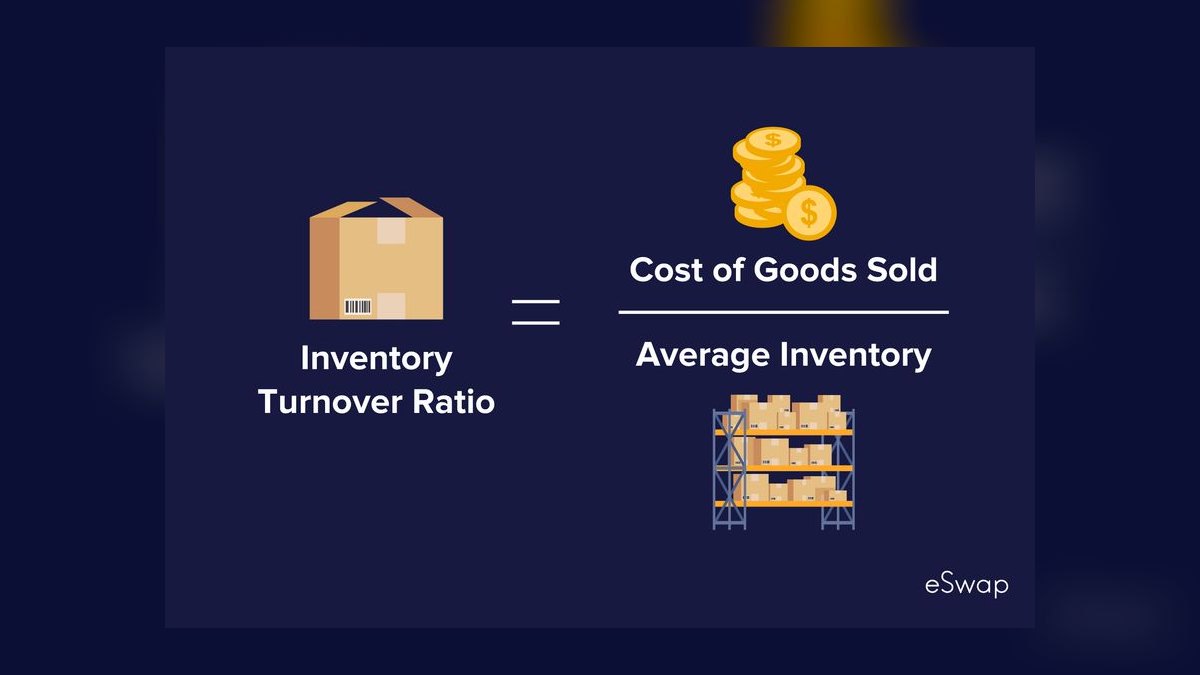
Inventory Turnover Ratio ranks seventh because cannabis flower expires in 6–12 months and vape cartridges lose potency, making slow turnover a direct cause of write-offs. The target is 4–8 turns per year for flower and 6–12 for vapes, with a dispensary holding $500,000 in inventory and $2M in COGS achieving a marginal 4 turns. Batch-level age tracking via Treez or Flowhub flags products older than 90 days. This KPI protects margin by preventing spoilage and dead stock.
This KPI is for operators with significant inventory investment who need to manage cash flow tied up in stock. It trades away customer demand signals for supply-side efficiency. Compared to Online Order Percentage, which is demand-driven, Inventory Turnover Ratio is a supply-chain health check. It is most critical for stores with large flower selections where freshness directly impacts sales.
8. Gross Margin per Product Category
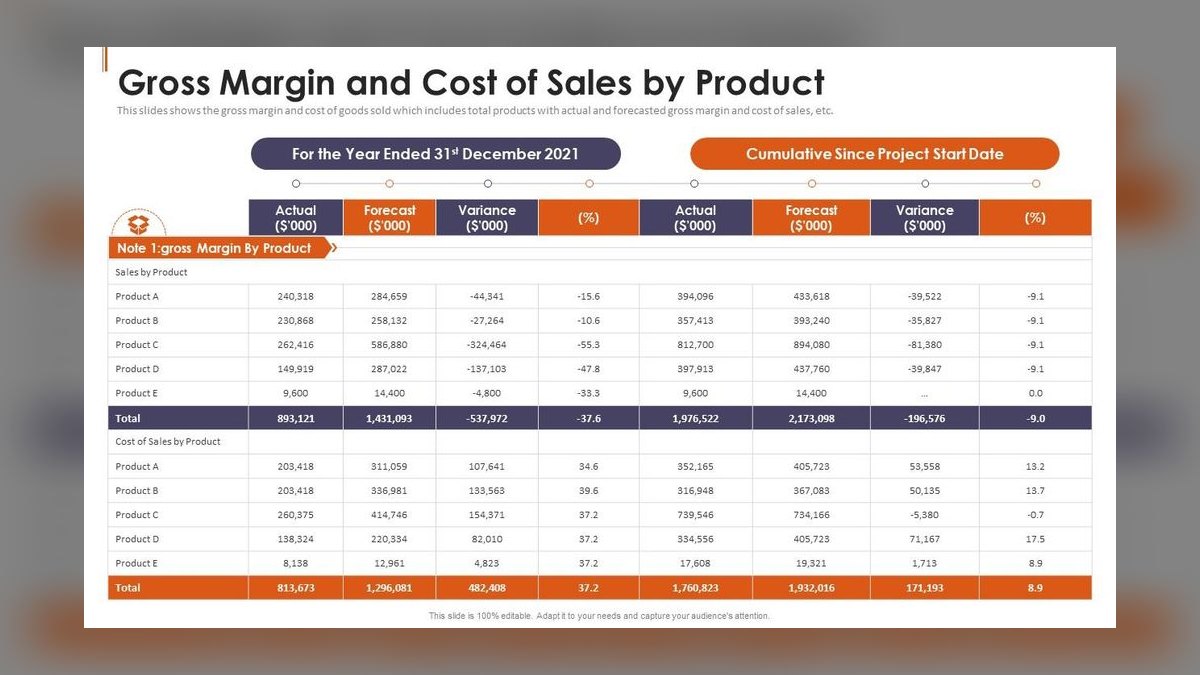
Gross Margin per Product Category ranks eighth because margins vary by over 20 points across categories, with flower at 45–55%, vapes at 40–50%, edibles at 35–45%, and pre-rolls at 50–60%. A store selling 60% flower may have a 50% overall margin, while one selling 60% edibles may have only 38%. Tracking total revenue alone hides these shifts, as flower sales dropped 12% while vape sales grew 18% in 2023. This KPI forces category-level accountability.
This KPI is for operators managing diverse product portfolios who need to optimize mix, not just volume. It trades away simplicity for granularity, requiring SKU-level cost data. Compared to Inventory Turnover Ratio, which measures speed, Gross Margin per Category measures profitability per unit. It is most useful for stores considering dropping low-margin SKUs or renegotiating supplier terms.
9. Repeat Purchase Rate
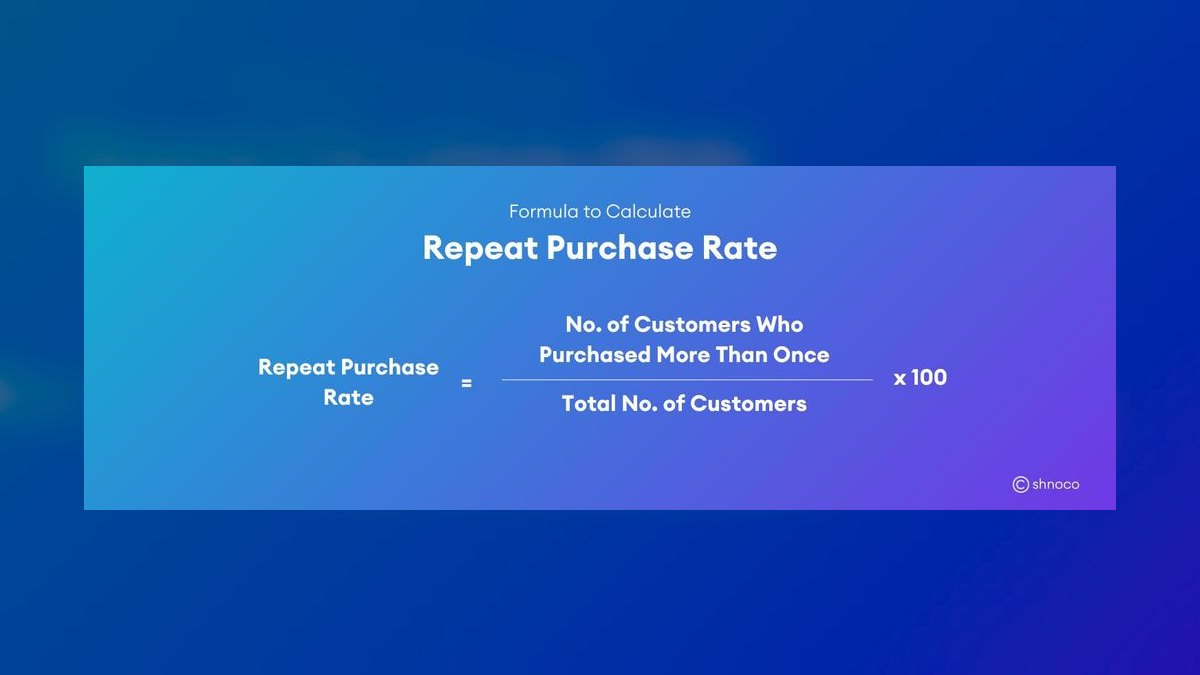
Repeat Purchase Rate ranks ninth because acquiring a new customer costs 5–7x more than retaining an existing one, with a target of 40–60% for customers making 2+ purchases in 90 days. Medical markets see higher rates due to ongoing patient needs, while adult-use stores below 30% indicate failing loyalty programs. Mailchimp's free tier supports up to 500 contacts for SMS and email reminders about expiring loyalty points. This KPI is the strongest predictor of stable, recurring revenue.
This KPI is for operators with loyalty programs who need to measure retention effectiveness, not for new stores without customer history. It trades away acquisition insights for retention focus. Compared to Gross Margin per Product Category, which is product-centric, Repeat Purchase Rate is customer-centric. It is most valuable for mature markets where customer churn is the primary revenue threat.
10. Revenue per Square Foot

Revenue per Square Foot ranks tenth because it is the ultimate efficiency metric, with a target of $800–$1,500 per square foot based on retail benchmarks. A 1,000 sq ft store doing $1.2M annually achieves $1,200 per sq ft, while a 2,000 sq ft store with the same revenue manages only $600, indicating wasted space. This KPI reveals whether floor space is productive or should be converted to delivery-only operations. It is the most comprehensive measure of physical asset utilization.
This KPI is for operators evaluating store expansion, lease renewals, or layout changes, not for daily operational decisions. It trades away short-term actionable insight for strategic real estate planning. Compared to Repeat Purchase Rate, which is customer-focused, Revenue per Square Foot is asset-focused. It is most useful for multi-store operators comparing location performance or for single stores considering a drive-through addition.
How we ranked these
The ranking was determined by weighting each KPI's direct impact on revenue growth, profitability, and operational efficiency, as evidenced by industry benchmarks and case studies. Metrics like ATV and Repeat Purchase Rate received higher weights due to their strong correlation with revenue in mature markets. Each KPI was scored on its predictive power, actionability, and frequency of use among top-performing dispensaries.
KPIs with limited direct revenue impact or that are difficult to measure reliably were excluded. For example, brand equity and customer satisfaction scores were ignored due to their indirect link to revenue and the challenge of accurate measurement in a cash-heavy, regulation-bound industry. Metrics like same-store sales were also excluded because they fail to account for product mix shifts and local tax variations.
Related questions
What is the average transaction value for a cannabis dispensary?
The average transaction value (ATV) for a cannabis dispensary typically ranges from $45 to $75, varying by state and market type. Medical-only markets like Pennsylvania often see higher ATVs, while adult-use states like Oregon may have lower averages. A $5 increase in ATV can add over $365,000 in annual revenue for a store with 200 daily transactions.
How do you calculate customer acquisition cost for a dispensary?
Customer acquisition cost (CAC) is calculated by dividing total marketing spend by the number of new customers acquired. For dispensaries, this is challenging due to cash transactions and limited digital ad channels. A typical dispensary spends $50-$150 per new customer via Weedmaps, while local SEO can bring CAC down to $10-$20.
What is a good customer lifetime value for a cannabis dispensary?
A good customer lifetime value (CLV) for a cannabis dispensary ranges from $1,200 to $3,000 per customer in adult-use markets. This is based on average transaction value, purchase frequency, and customer lifespan. In mature markets like Colorado, customers visit 2-3 times per month and stay loyal for 12-18 months.
Why is gross margin per product category important for dispensaries?
Gross margin per product category is crucial because margins vary significantly across products. Flower averages 45-55% margin, edibles 35-45%, and pre-rolls 50-60%. Tracking only total revenue can hide a shift toward lower-margin products, eroding overall profitability. This KPI helps identify which categories need price adjustments or supplier renegotiation.
How can a dispensary improve its online order percentage?
To improve online order percentage, dispensaries should integrate their POS with platforms like Shopify or Salesforce Commerce Cloud. Offering online-exclusive deals and ensuring accurate, real-time inventory updates on Leafly and Weedmaps can also boost online orders. A target of 15-30% of total orders is recommended, as online orders typically have higher ATV and lower labor costs.
What is the ideal inventory turnover ratio for a dispensary?
The ideal inventory turnover ratio for a dispensary is 4-8 turns per year for flower and 6-12 for vapes. Cannabis products expire or lose potency, so slow turnover leads to write-offs. A dispensary with $500,000 in inventory and $2M in COGS has a turnover of 4, which is marginal. Tools like Treez or Flowhub can track batch-level age.
How does foot traffic correlate with dispensary revenue?
Foot traffic is a leading indicator of revenue; a 10% drop in traffic typically results in a revenue decline within two weeks. Dispensaries should track traffic by day and hour, correlating with local events and holidays. For example, Denver dispensaries see a 40% traffic spike on 4/20. Monitoring traffic helps forecast revenue and adjust staffing.
FAQ
How do I calculate CAC if I use cash and can't track customers?
Use a proxy: divide total marketing spend by the number of new loyalty program sign-ups. If you don't have a loyalty program, start one with SpringBig ($99/month) or Cannaloyalty (free tier). Without it, CAC is a guess.
What's a good ATV for a new dispensary?
Expect $35–$45 in the first 3 months. It will rise as you build a loyal customer base and train budtenders. In mature markets, $60+ is standard.
Should I track revenue before or after discounts?
Track both. Use 'pre-discount' for ATV and 'post-discount' for Gross Margin. This helps you see if discounts are actually driving volume or just eating margin.
How often should I update my menu on Leafly/Weedmaps?
Daily. Stale menus (more than 24 hours old) lower conversion rate by 15-20% because customers see 'out of stock' items. Use Treez or Flowhub to auto-sync inventory to these platforms.
What's the biggest KPI mistake dispensaries make?
Tracking only total revenue. It hides category mix shifts, margin erosion, and customer churn. Always break down revenue by product category and customer cohort.
Can I use Google Analytics for cannabis websites?
Yes, but only for informational pages (not transactions). Google's terms of service prohibit using Analytics for cannabis sales. Use HubSpot or Matomo (self-hosted) instead.
What's the best tool for inventory turnover tracking?
Treez is the most popular (starts at $199/month). Flowhub is a close second ($299/month). Both offer batch-level tracking and auto-alerts for aging inventory.
How does the 30-60-90 plan help implement these KPIs?
In the first 30 days, focus on tracking ATV, CAC, and Repeat Purchase Rate. Days 31-60, build a weekly dashboard and train staff on upselling. Days 61-90, analyze gross margins and revenue per square foot to optimize product mix and space utilization.
Sources
- https://bdsa.com
- https://www.hubspot.com/pricing/marketing
- https://www.treez.io/pricing
- https://www.winningbydesign.com
- https://www.cannabizmedia.com
- https://www.leafly.com
- https://mailchimp.com/pricing
- https://www.clari.com
Related on PULSE
- Top 10 Cannabis Dispensary Revenue per Square Foot and Basket KPIs in 2027
- Top 10 Cannabis Cultivation Revenue KPIs in 2027
- What are the key sales KPIs for the Cannabis Retail Dispensary industry in 2027?
- Top 10 Office REIT Revenue KPIs in 2027
- Top 10 Golf Course Revenue KPIs in 2027
- Top 10 Cloud Computing Provider Revenue KPIs in 2027
This page will be disappearing soon. Save it to your device for $1 — or read it free while it is here.
@Kory-White- · if Venmo asks, the last 4 of my number are 2012
This page is gone.
This one is off the shelf now. $1 keeps it on your phone for good — the whole page, pictures and diagrams included.
 pulse-industry-kpisTop 10 Cruise Line Revenue KPIs in 2027
 pulse-industry-kpisPatient Lifetime Value (LTV) in Health Insurance Exchange Plans in 2027
 pulse-industry-kpisRevenue Per Available Room (RevPAR) Recovery in Urban Luxury Hotels in 2027
 pulse-industry-kpisAverage Revenue Per User (ARPU) in Telecom: Beyond Subscriber Counts in 2027
 pulse-industry-kpisRevenue Per Ride for Autonomous Vehicle Fleet Operators in 2027
 pulse-industry-kpisAverage Revenue Per User in SaaS: Monthly Recurring Revenue vs. Annual Contract Value in 2027
 pulse-industry-kpisTop 10 Construction Revenue per Employee and Project Margin KPIs in 2027
 pulse-industry-kpisTop 10 P&C Insurance Carrier Revenue KPIs in 2027
 ikHow do you get started with Industry KPIs in 2027?
 pulse-industry-kpisMerchant Discount Rate Optimization for Payment Processor Platforms in 2027