

How do you benchmark fuel cost per revenue passenger mile for a low-cost carrier in 2027?
 Curated byKory White · Fractional CRO · Maryland
Quality
Certified
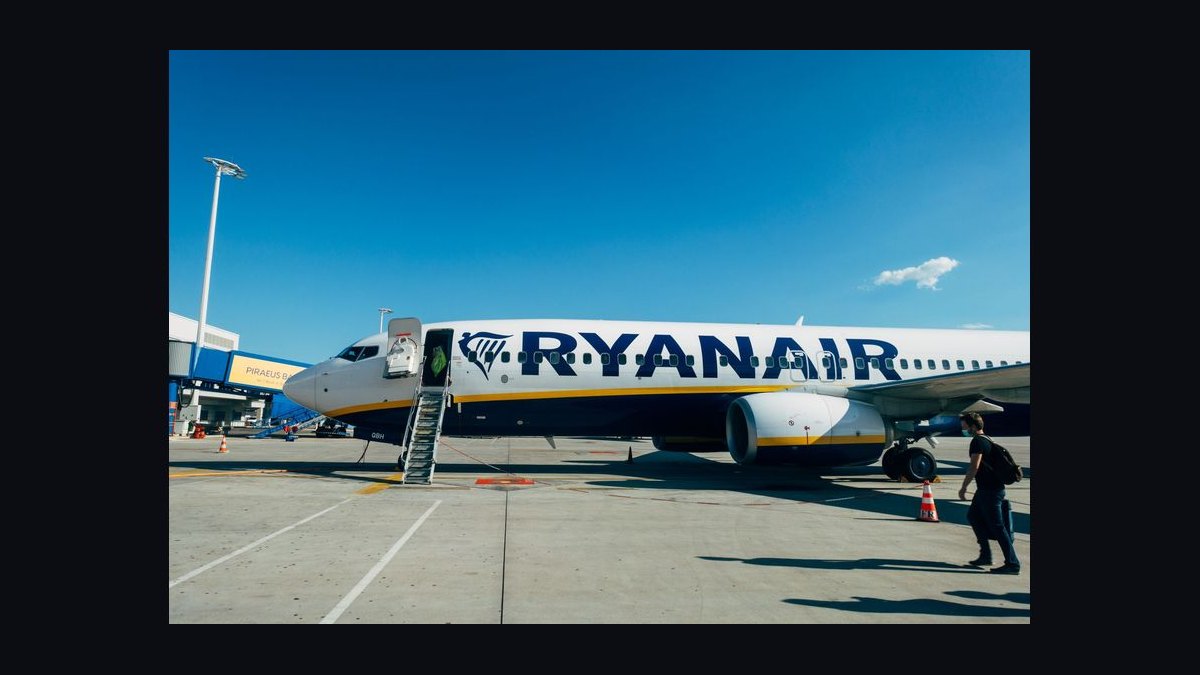
To benchmark fuel cost per revenue passenger mile (CASM-fuel) for a low-cost carrier in 2027, divide total fuel expense by total revenue passenger miles (RPMs) for a given period, then compare against LCC peers using publicly reported unit costs, adjusting for fuel hedging positions, stage length, and aircraft generation. A typical LCC target falls between $0.02 and $0.04 per RPM, with the exact figure depending on oil prices, fleet efficiency, and load factor.
A concrete scenario: why this benchmark matters in 2027
Imagine you are the head of FP&A at a newly launched low-cost carrier operating a fleet of Airbus A321neos on transcontinental routes across the United States. Your CEO has just returned from an industry conference where a competitor boasted a fuel cost per revenue passenger mile of $0.025. You need to determine whether that figure is realistic, how your own operation compares, and what levers you can pull to close any gap. Without a rigorous benchmarking framework, you risk either chasing an unattainable target or missing a genuine competitive threat.
The first step is understanding what goes into the numerator and denominator of this metric. Fuel cost includes all jet fuel purchases, hedging gains or losses, fuel tankering expenses, and any carbon offset or emissions trading costs that apply in the jurisdictions you serve. The denominator—revenue passenger miles—is the sum of each paying passenger's journey distance. For example, if you fly 180 passengers an average of 1,500 miles, that flight generates 270,000 RPMs. If that flight consumed $8,100 in fuel, your fuel cost per RPM would be $0.03.
In 2027, the operating environment will be shaped by several factors that did not exist a decade ago. The International Civil Aviation Organization's Carbon Offsetting and Reduction Scheme for International Aviation (CORSIA) will be in its second phase, requiring carriers on international routes to offset emissions above 2024 baseline levels. Sustainable aviation fuel (SAF) blending mandates in the European Union and California will force some carriers to pay premiums of two to three times conventional jet fuel prices for a portion of their uplift. These costs must be captured in the fuel expense line for benchmarking to be meaningful.

A practical scenario: suppose your carrier operates 100 daily departures with an average stage length of 1,200 miles and a load factor of 85 percent. With 189 seats per A321neo, you carry roughly 161 passengers per flight. Daily RPMs would be approximately 19.3 million (100 flights × 161 passengers × 1,200 miles). If jet fuel averages $2.80 per gallon in 2027 and your fleet burns 2.5 gallons per seat-mile at that stage length, daily fuel consumption would be roughly 567,000 gallons, costing about $1.59 million. Your daily fuel cost per RPM would be $0.082—far above the competitor's claim, suggesting either their figure uses a different calculation method, they benefit from favorable hedging, or they operate much longer stage lengths.
This scenario illustrates why benchmarking fuel cost per revenue passenger mile requires careful normalization. You cannot simply compare raw figures across carriers without adjusting for stage length, seat density, load factor, fuel hedging positions, and the carbon compliance costs each carrier faces. The remainder of this page provides a systematic framework for making those adjustments and arriving at a defensible benchmark for 2027.
How the mechanism actually works
The fuel cost per revenue passenger mile metric is deceptively simple in construction but complex in practice. At its core, it decomposes into three multiplicative factors: fuel price per gallon, gallons burned per available seat mile (ASM), and the inverse of load factor. Understanding this decomposition is essential for benchmarking because each component has different drivers and different degrees of carrier control.

Fuel price per gallon is largely exogenous to the carrier, determined by global crude oil prices, refining capacity, regional taxes, and the carrier's hedging program. In 2027, the Energy Information Administration projects jet fuel prices will range between $2.50 and $3.50 per gallon depending on crude oil trajectories and refining margins. A carrier that hedged 50 percent of its fuel at $2.40 per gallon when spot prices were $2.20 will show a different fuel expense than a competitor that remained unhedged, even if both burn identical quantities of fuel.
Gallons burned per ASM is the technical efficiency component. This is driven by aircraft type, engine configuration, winglets or sharklets, weight reduction measures, and operational practices such as optimal cruising altitude and direct routing. A modern A321neo burns approximately 2.3 to 2.6 gallons per seat-mile at typical LCC stage lengths, while an older 737-800 burns 2.8 to 3.2 gallons per seat-mile. Fleet age and composition therefore create structural differences in this component that no amount of operational optimization can fully overcome.
Load factor converts ASM-based fuel burn into RPM-based fuel cost. A carrier operating at 80 percent load factor spreads its fuel cost over fewer revenue passenger miles than one operating at 92 percent load factor, all else equal. For LCCs in 2027, load factors typically range from 84 to 93 percent, with ultra-low-cost carriers like Spirit and Frontier historically operating at the higher end due to aggressive ancillary revenue strategies that allow them to sell base seats at very low fares.
The calculation chain works as follows: total fuel expense divided by total ASMs gives fuel cost per ASM. Dividing that by load factor yields fuel cost per RPM. For benchmarking purposes, you can work backward from a target fuel cost per RPM to determine what fuel price, aircraft efficiency, and load factor combination would be required to achieve it.
For example, if your target fuel cost per RPM is $0.03 and your projected load factor is 88 percent, your fuel cost per ASM must be $0.0264. If your fleet averages 2.5 gallons per ASM, your effective fuel price per gallon must be $0.01056—clearly impossible, which reveals that $0.03 per RPM is only achievable at much longer stage lengths or with significantly higher load factors. This arithmetic check is the first step in any credible benchmarking exercise.
The mechanism also involves seasonal and cyclical adjustments. Fuel prices spike during summer driving season and winter heating season, while RPMs fluctuate with travel demand. A quarterly benchmark must account for these patterns, ideally comparing the same quarter year-over-year rather than comparing a peak summer quarter to a shoulder season quarter. Most LCCs report fuel cost per ASM (CASM-fuel) in their quarterly earnings releases, which you can convert to fuel cost per RPM by dividing by load factor—or you can compute it directly from DOT Form 41 data for US carriers.
Real numbers, ranges, and benchmarks

Establishing credible benchmark ranges for fuel cost per revenue passenger mile in 2027 requires triangulating across multiple data sources. Publicly traded LCCs report fuel expense and traffic figures quarterly, providing the most reliable basis for comparison. For US carriers, the Department of Transportation's Bureau of Transportation Statistics publishes Form 41 financial data and T-100 traffic data, which together allow precise calculation of fuel cost per RPM for every domestic carrier.
Based on pre-2025 trends and reasonable projections for 2027, a typical US LCC operating a modern fleet of A320neo family aircraft with average stage lengths of 1,000 to 1,500 miles should expect fuel cost per RPM between $0.025 and $0.045. The lower end of this range corresponds to $2.50 per gallon fuel, 90 percent load factors, and stage lengths above 1,400 miles. The higher end corresponds to $3.50 per gallon fuel, 84 percent load factors, and stage lengths below 900 miles.
For context, in 2023-2024, when jet fuel averaged approximately $2.70 to $3.00 per gallon, several LCCs reported fuel cost per ASM between $0.035 and $0.045. With load factors in the 85 to 90 percent range, this translated to fuel cost per RPM of approximately $0.039 to $0.053. By 2027, continued fleet modernization and higher load factors should push these figures down, assuming fuel prices remain in the $2.50 to $3.50 range.
Stage length is the single largest driver of variation in this metric. A 500-mile flight incurs disproportionate fuel burn during climb and descent, while a 2,000-mile flight spends most of its time in efficient cruise. The relationship is not linear: doubling stage length from 500 to 1,000 miles reduces fuel per ASM by roughly 15 to 20 percent, while extending from 1,500 to 2,000 miles yields only another 5 to 8 percent improvement. This is why ultra-long-haul LCCs like Norse Atlantic can achieve fuel costs per RPM below $0.02 while short-haul carriers in Southeast Asia may exceed $0.05.

Load factor also creates meaningful variation. A carrier operating at 92 percent load factor versus 85 percent load factor reduces fuel cost per RPM by approximately 8 percent, all else equal. This explains why Spirit and Frontier, which consistently operate at load factors above 90 percent, report lower fuel costs per RPM than network carriers despite similar fuel burn per ASM. For benchmarking purposes, you should always compare fuel cost per RPM at a normalized load factor, or at minimum, note the load factor differential when comparing carriers.
Fleet composition matters enormously. The following table illustrates approximate fuel burn per ASM for aircraft types commonly operated by LCCs in 2027:
- Airbus A321neo with 240 seats: 2.3 to 2.5 gallons per ASM at 1,200-mile stage length
- Airbus A320neo with 186 seats: 2.6 to 2.9 gallons per ASM at 1,200-mile stage length
- Boeing 737 MAX 8 with 189 seats: 2.7 to 3.0 gallons per ASM at 1,200-mile stage length
- Boeing 737-800 with 189 seats: 3.0 to 3.4 gallons per ASM at 1,200-mile stage length
- Airbus A321ceo with 220 seats: 2.8 to 3.1 gallons per ASM at 1,200-mile stage length
These figures translate directly into fuel cost per RPM differences. At $3.00 per gallon and 88 percent load factor, the A321neo would achieve approximately $0.028 per RPM, while the 737-800 would achieve approximately $0.037 per RPM—a 32 percent difference driven entirely by fleet choice.
Fuel hedging creates another layer of variation. In 2027, some LCCs will have hedged 30 to 50 percent of their fuel at prices set in 2025 or 2026, while others will remain fully unhedged. If spot prices rise from $2.80 to $3.20 per gallon, a carrier that hedged at $2.60 will show a fuel cost per RPM advantage of roughly 12 percent. Conversely, if spot prices fall, hedged carriers will underperform unhedged competitors. When benchmarking, you should strip out hedging effects by using current spot prices for all carriers, then separately evaluate each carrier's hedging strategy as a risk management consideration.
Carbon costs are increasingly material. In 2027, EU carriers face SAF blending mandates requiring 2 percent SAF in 2025, rising to 5 percent by 2030. SAF currently costs $5 to $8 per gallon versus $2.50 to $3.50 for conventional jet fuel. A carrier complying with a 2 percent mandate would see fuel costs increase by approximately 3 to 4 percent. California's Low Carbon Fuel Standard adds additional compliance costs for flights operating within the state. These costs must be included in the fuel expense line for accurate benchmarking, but they also create comparability issues when comparing carriers operating in different regulatory environments.
Trade-offs and alternatives

Benchmarking fuel cost per revenue passenger mile involves several trade-offs that require careful consideration. The most fundamental trade-off is between stage length and network coverage. A carrier can achieve exceptionally low fuel cost per RPM by focusing exclusively on long-haul routes, but this sacrifices the frequency and connectivity that many passengers value. Conversely, a short-haul carrier will have higher fuel cost per RPM but can offer more daily frequencies and attract business travelers willing to pay premium fares.
The trade-off between seat density and passenger comfort is equally important. Adding seats to an aircraft reduces fuel cost per ASM by spreading fixed fuel burn across more seats, but it reduces legroom, increases boarding and deplaning time, and may reduce customer satisfaction. Frontier and Spirit have pushed seat density to extremes—up to 240 seats on A321neos—while Allegiant has historically used older aircraft with lower density. The optimal density depends on the carrier's business model and target customer segment.
Fuel hedging presents a classic risk-return trade-off. A carrier that hedges heavily sacrifices upside when fuel prices fall but protects against downside when prices rise. In 2027, with significant uncertainty about crude oil supply and demand, some LCCs will choose to remain unhedged to maintain flexibility, while others will hedge 30 to 50 percent to stabilize cash flows. The benchmark should account for this by using spot prices for comparison, while separately evaluating hedging strategies as risk management decisions.
Another trade-off involves aircraft utilization versus fuel efficiency. Flying an aircraft more hours per day spreads fixed costs over more ASMs, but it may require faster cruise speeds or less direct routing to maintain schedules, both of which increase fuel burn. The optimal utilization rate balances fuel efficiency against capital costs. Most LCCs target 11 to 13 block hours per day for narrowbody aircraft, compared to 9 to 11 for network carriers. Pushing beyond 13 hours typically requires sacrificing fuel efficiency through higher speeds or reduced turnaround buffers.

The choice between operating newer, more fuel-efficient aircraft versus older, fully depreciated aircraft is another critical trade-off. A new A321neo costs approximately $50 million but burns 20 percent less fuel than an A321ceo. An older aircraft may have zero capital cost but higher fuel burn and maintenance expenses. The breakeven point depends on fuel prices, utilization rates, and the carrier's cost of capital. In 2027, with fuel prices projected in the $2.50 to $3.50 range, the payback period for new aircraft is typically four to seven years, making fleet renewal attractive for carriers with access to capital.
Finally, there is a trade-off between fuel cost per RPM and total cost per RPM. A carrier might achieve low fuel costs by operating very long stage lengths, but this could increase other costs such as crew expenses (due to longer duty days), maintenance costs (due to higher cycle counts), and airport fees (due to fewer departures). The benchmark should therefore be used in conjunction with total unit cost benchmarks, not in isolation.
For benchmarking purposes, the most practical approach is to normalize all carriers to a common stage length and load factor using industry-standard adjustment factors. The US DOT publishes stage length adjustment factors that can be applied to fuel cost per ASM figures. Similarly, load factor adjustment is straightforward: divide fuel cost per ASM by the target load factor to get fuel cost per RPM. These adjustments allow fair comparison across carriers with different network structures.
Common pitfalls and how to avoid them
Several pitfalls frequently undermine fuel cost per revenue passenger mile benchmarking efforts. The most common is comparing carriers with different stage lengths without adjustment. A carrier operating 2,000-mile average stage lengths will naturally show lower fuel cost per RPM than one operating 600-mile average stage lengths, even if both are equally efficient. Always normalize for stage length before drawing conclusions.
Another pitfall is using total fuel expense that includes non-operating items. Some carriers include fuel tankering costs, which involve carrying extra fuel to avoid expensive airport fuel prices, in their fuel expense. Others exclude carbon offset costs or SAF premiums. When comparing across carriers, verify that the fuel expense definition is consistent. The US DOT Form 41 provides standardized definitions that facilitate comparison for US carriers, but international carriers may use different accounting treatments.
Load factor distortion is also common. A carrier that reports exceptionally low fuel cost per RPM may simply be operating at very high load factors, which is not sustainable if it requires deep discounting that destroys revenue per available seat mile. Always examine load factor alongside fuel cost per RPM to understand the full picture. A better approach is to benchmark fuel cost per ASM separately and then evaluate load factor as a separate revenue management metric.
Seasonal and cyclical distortions can mislead benchmarking efforts. Fuel prices vary significantly by season, and traffic patterns create seasonal load factor variations. Compare the same quarter year-over-year rather than sequential quarters. Also be aware of one-time events such as fuel price spikes following geopolitical events or supply disruptions. Using trailing twelve-month averages smooths out these distortions and provides a more stable benchmark.
Fleet composition differences are another source of confusion. A carrier with an all-A321neo fleet will show structurally lower fuel cost per RPM than one operating a mix of A320ceo and 737-800 aircraft. This is not an operational inefficiency but a fleet planning decision. When benchmarking, either compare carriers with similar fleet types or adjust for fleet age and type using published fuel burn data from manufacturers or the International Council on Clean Transportation.
Hedging gains and losses can create misleading comparisons. A carrier that locked in low fuel prices through hedging will show lower fuel costs than competitors, but this is a financial decision, not an operational achievement. Strip out hedging effects by using current spot prices for all carriers, then evaluate hedging strategies separately. The same logic applies to carriers that have entered into long-term fuel supply agreements at favorable prices.
Ignoring carbon costs is increasingly problematic. In 2027, carriers operating in jurisdictions with carbon pricing or SAF mandates will show higher fuel costs than those without such requirements. This is not an inefficiency but a regulatory cost. When benchmarking across jurisdictions, either exclude carbon costs and note the difference, or add estimated carbon costs to carriers that do not currently bear them to create a level playing field.
Finally, avoid the pitfall of using a single benchmark figure without understanding its context. A fuel cost per RPM of $0.03 might be excellent for a short-haul carrier in a high fuel price environment but poor for a long-haul carrier in a low fuel price environment. Always benchmark against a relevant peer group with similar network characteristics, and track the metric over time to identify trends rather than focusing on a single period.

To avoid these pitfalls, establish a clear benchmarking methodology before collecting data. Define the exact components of fuel expense, specify the traffic metric (RPMs should include only revenue passengers, not free or reduced-fare passengers), determine the normalization approach for stage length and load factor, and decide how to handle hedging and carbon costs. Document these decisions so that comparisons are consistent across periods and carriers.
Related questions
How does fuel cost per revenue passenger mile differ from fuel cost per available seat mile?
Fuel cost per ASM divides fuel expense by available seat miles, ignoring load factor. Fuel cost per RPM divides by revenue passenger miles, incorporating load factor. A carrier with 90 percent load factor will have fuel cost per RPM approximately 11 percent higher than fuel cost per ASM. Both metrics are useful, but they answer different questions.
What is a realistic fuel cost per revenue passenger mile target for a new LCC in 2027?
A realistic target for a new LCC operating A321neo aircraft with 88 percent load factor and 1,200-mile average stage length is $0.028 to $0.035 per RPM, assuming fuel prices between $2.50 and $3.50 per gallon. New entrants should expect higher costs initially due to lower utilization and less favorable airport agreements.
How do fuel hedging strategies affect fuel cost per revenue passenger mile comparisons?
Hedging can create deviations of 10 to 15 percent from spot-price-based benchmarks. A carrier hedged at $2.60 per gallon when spot prices are $3.20 will show significantly lower fuel costs per RPM. For fair comparison, use spot prices for all carriers and evaluate hedging as a separate risk management metric.
What operational factors can reduce fuel cost per revenue passenger mile without changing the fleet?
Weight reduction, optimized flight planning, continuous descent approaches, single-engine taxiing, and washing engines regularly can reduce fuel burn by 3 to 7 percent. Increasing load factor through better revenue management is the most impactful operational lever, potentially reducing fuel cost per RPM by 5 to 10 percent.
How does stage length impact fuel cost per revenue passenger mile for low-cost carriers?
Stage length has a nonlinear effect. Extending average stage length from 500 to 1,000 miles reduces fuel cost per RPM by roughly 20 percent due to proportionally less time in climb and descent. Extending from 1,500 to 2,000 miles yields only 5 to 8 percent improvement, as cruise efficiency gains diminish.
FAQ
What exactly counts as fuel cost in this benchmark?
Fuel cost includes all jet fuel purchases, fuel tankering expenses, hedging gains or losses realized during the period, carbon offset costs under CORSIA or regional schemes, and SAF premiums above conventional fuel prices. Exclude fuel taxes that are refundable and any fuel-related surcharges collected from passengers, which are revenue items rather than cost items.
How do I calculate revenue passenger miles for my carrier?
Revenue passenger miles equal the sum of each paying passenger's journey distance. For a flight with 180 passengers traveling 1,200 miles, that flight generates 216,000 RPMs. Multiply the number of passengers by the great-circle distance between origin and destination, or use the actual flight distance if it differs significantly due to routing constraints.
What is the difference between fuel cost per RPM and total cost per RPM?
Fuel cost per RPM isolates only fuel expense, while total cost per RPM includes all operating expenses—crew, maintenance, airport fees, navigation charges, aircraft ownership, and overhead. For LCCs, fuel typically represents 25 to 35 percent of total unit costs. Total cost per RPM for LCCs in 2027 typically ranges from $0.08 to $0.12, depending on the same factors that affect fuel costs.
How often should I benchmark fuel cost per revenue passenger mile?
Monthly internal benchmarking is useful for operational monitoring, but external peer comparisons should be done quarterly to align with earnings reporting cycles. Use trailing twelve-month averages for strategic planning and annual comparisons to smooth out seasonal and cyclical variations. Adjust benchmarks whenever fuel prices shift by more than 10 percent from the baseline.
Which carriers are the best benchmarks for a low-cost carrier in 2027?
For US carriers, Southwest Airlines, Spirit Airlines, Frontier Airlines, Allegiant Air, and Breeze Airways provide relevant benchmarks. Internationally, Ryanair, Wizz Air, IndiGo, and AirAsia offer comparable LCC models. Select peers with similar stage lengths, fleet types, and geographic operating environments for the most meaningful comparisons.
How do I account for sustainable aviation fuel costs in this benchmark?
SAF premiums should be included in fuel expense for benchmarking purposes, but note that carriers with SAF mandates will show higher costs than those without. If comparing carriers across jurisdictions, either exclude SAF costs and add a note, or apply a standardized SAF cost adjustment to all carriers based on their regulatory requirements.
What is the impact of aircraft age on fuel cost per revenue passenger mile?
Aircraft age affects fuel burn through engine degradation, increased weight from accumulated modifications, and less efficient aerodynamic configurations. A 10-year-old aircraft typically burns 3 to 6 percent more fuel than a new aircraft of the same type. Engine washing and performance restoration programs can recover some of this degradation.
How should I handle fuel cost per RPM for cargo or charter operations?
This benchmark applies specifically to passenger operations. For cargo operations, use fuel cost per available ton mile or per revenue ton mile. For charter operations, calculate fuel cost per RPM using the same formula but recognize that charter load factors and stage lengths may differ significantly from scheduled operations.
Can I use fuel cost per RPM to compare my carrier to a legacy carrier?
Yes, but with caution. Legacy carriers typically have higher fuel costs per RPM due to shorter average stage lengths, lower load factors, and more fuel-intensive aircraft configurations with premium cabins. A fair comparison requires normalizing for these differences. The metric is most meaningful when comparing carriers with similar business models.
What is the relationship between fuel cost per RPM and fuel cost per gallon?
Fuel cost per gallon is the price component, while fuel cost per RPM combines price with efficiency and capacity utilization. A carrier paying $3.50 per gallon but operating very efficiently with high load factors could have lower fuel cost per RPM than a carrier paying $2.80 per gallon with poor efficiency and low load factors. Both metrics are important for different purposes.
Sources
https://www.eia.gov/outlooks/steo/ https://www.bts.gov/topics/airlines-and-airports/form-41-air-carrier-financial-data https://www.iata.org/en/publications/economics/fuel-monitor/ https://www.icao.int/environmental-protection/CORSIA/Pages/default.aspx https://www.energy.gov/eere/bioenergy/sustainable-aviation-fuel https://www.transportation.gov/briefing-room https://www.airlines.org/ https://www.icao.int/sustainability/Pages/default.aspx https://www.easa.europa.eu/en/domains/environment https://www.spirit.com/company/investor-relations
Related on PULSE
- How to model fuel hedging strategies for an LCC fleet plan
- Stage length normalization techniques for airline unit cost comparison
- Load factor optimization and its impact on unit economics
- Fleet renewal decisions: A321neo versus 737 MAX for LCCs
- Carbon compliance costs in airline financial planning
- Building a peer comparison dashboard for airline operating metrics
This page will be disappearing soon. Save it to your device for $1 — or read it free while it is here.
@Kory-White- · if Venmo asks, the last 4 of my number are 2012
This page is gone.
This one is off the shelf now. $1 keeps it on your phone for good — the whole page, pictures and diagrams included.
 pulse-industry-kpisTop 10 KPIs for Independent Bakeries in 2027
 pulse-industry-kpisWhat are the most important KPIs every garden center should track in 2027?
 pulse-industry-kpisTop 10 Sales KPIs for Theme Park and Attraction Operations in 2027
 pulse-industry-kpisWhat are the most important KPIs every HVAC company should track in 2027?
 pulse-industry-kpisTop 10 Sales KPIs for Print and Copy Services in 2027
 pulse-industry-kpisTop 10 Sales KPIs for Cannabis Retail Dispensary in 2027
 pulse-industry-kpisTop 10 Sales KPIs for Professional Sports Team Operations (NFL/NBA/MLB/NHL) in 2027
 pulse-industry-kpisTop 10 Sales KPIs for Commercial Electrical Distribution in 2027
 pulse-industry-kpisTop 10 Sales KPIs for Fraud Detection and AML Software in 2027
 pulse-industry-kpisTop 10 Sales KPIs for Biotech Therapeutics in 2027