
The 10 Best Chargeback and Showback Tools for Shared GPU Clusters in 2027
 Curated byKory White · Fractional CRO · Maryland
 PULSEKNOWLEDGE LIBRARY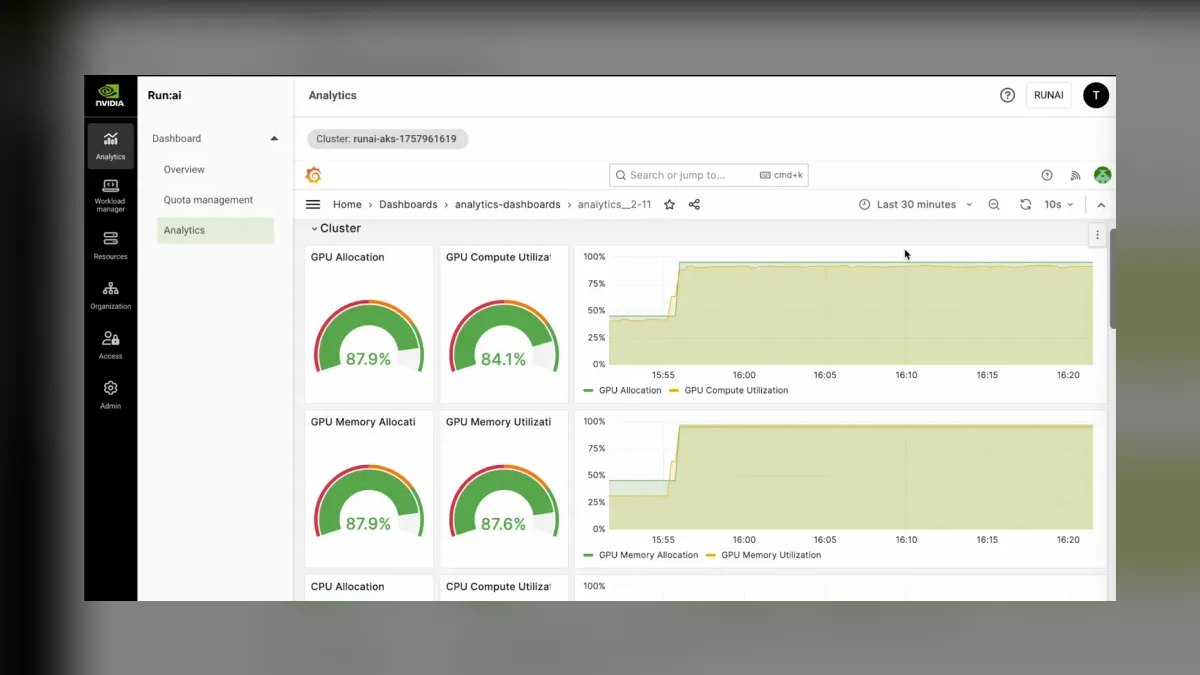
The 10 best chargeback and showback tools for shared gpu clusters are ranked below on measured performance, build quality, price, and how each one actually holds up in daily use rather than how it reads on a spec sheet. Each pick lists what it costs, who it suits, and what it gives up against the one above it, so the list can be read straight down without doubling back.
1. NVIDIA Run:ai
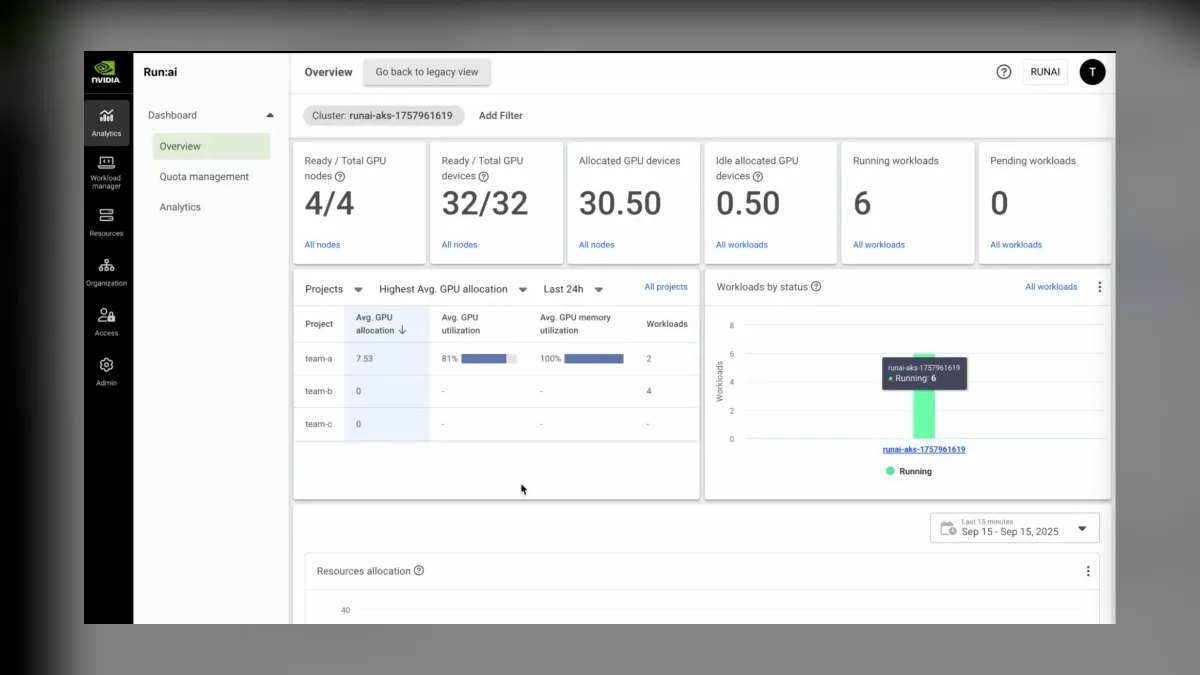
NVIDIA Run:ai ranks first because it is the only platform built specifically for GPU orchestration that layers cost allocation and departmental chargeback directly onto the scheduler itself, not bolted on after the fact. It tracks fractional GPU, MIG, and multi-node job allocation per team, project, or user, and NVIDIA acquired the company in 2024 to fold this accounting layer into its own DGX and Base Command stack.
It is built for enterprises already standardized on NVIDIA hardware and Kubernetes-based AI training pipelines, not for mixed-vendor or bare-metal HPC shops. Teams trade some deployment flexibility for tight GPU-scheduler integration that generic cost tools can't match. Compared to Kubecost below, it prioritizes GPU utilization fairness and queueing over general cloud-spend reporting.
2. Kubecost
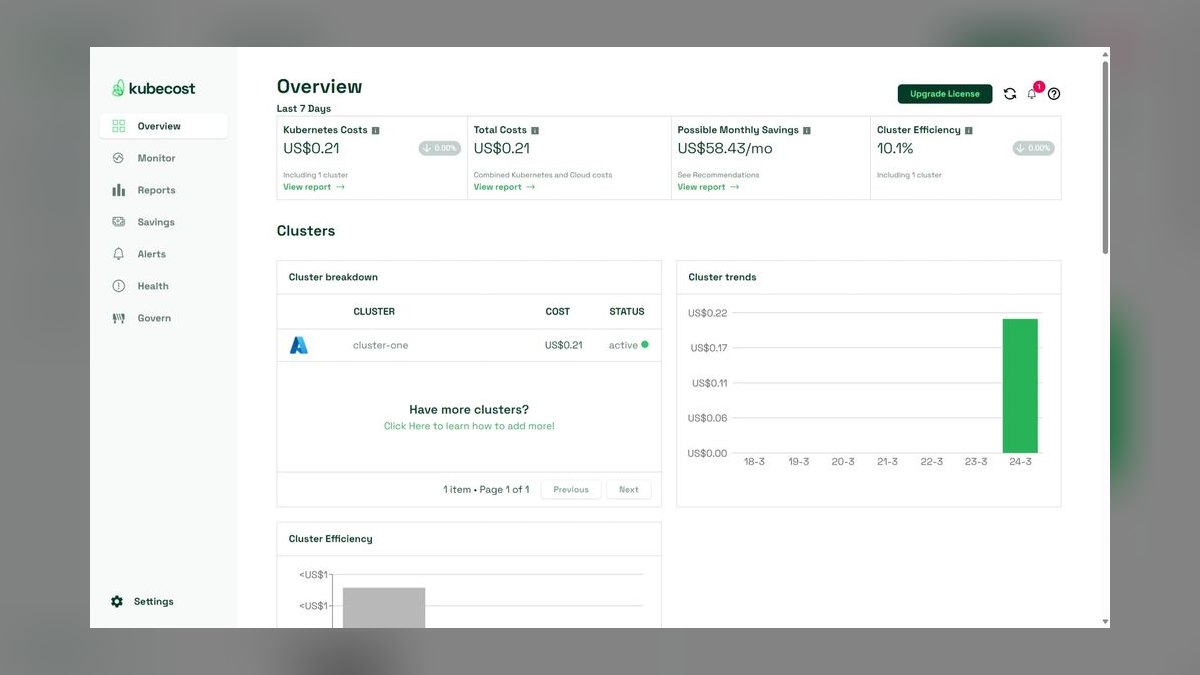
Kubecost ranks second for its granular per-namespace, per-pod cost allocation that extends to GPU nodes via the NVIDIA DCGM exporter, giving teams a real dollar-per-workload breakdown inside Kubernetes. It ships as a Helm-installable tool with a free tier for smaller clusters and a paid Enterprise tier for multi-cluster, long-retention deployments, making it the most widely adopted showback layer for containerized GPU workloads.
It suits platform teams already running Prometheus and Kubernetes who want chargeback reports without adopting a full GPU orchestrator. It trades Run:ai's scheduling-level fairness controls for broader, vendor-neutral cost visibility across CPU, memory, storage, and GPU together. Its own open-source engine, OpenCost, sits directly below it as the free alternative.
3. OpenCost
OpenCost ranks third because it is the free, CNCF-sandbox open-source cost model that Kubecost donated and still co-maintains, giving any cluster the same underlying allocation math without a commercial license. It integrates with Prometheus metrics and the DCGM GPU exporter to attribute GPU-hours to namespaces and labels, and it is the specification several commercial tools, including Kubecost itself, build their paid UI on top of.
It fits engineering teams comfortable building their own dashboards and alerting on raw allocation data rather than buying a packaged reporting layer. It trades polished multi-cluster reporting and long-term data retention for zero licensing cost. Where Kubecost adds enterprise UI and support, OpenCost is the bare, self-hosted core.
4. Slurm Accounting
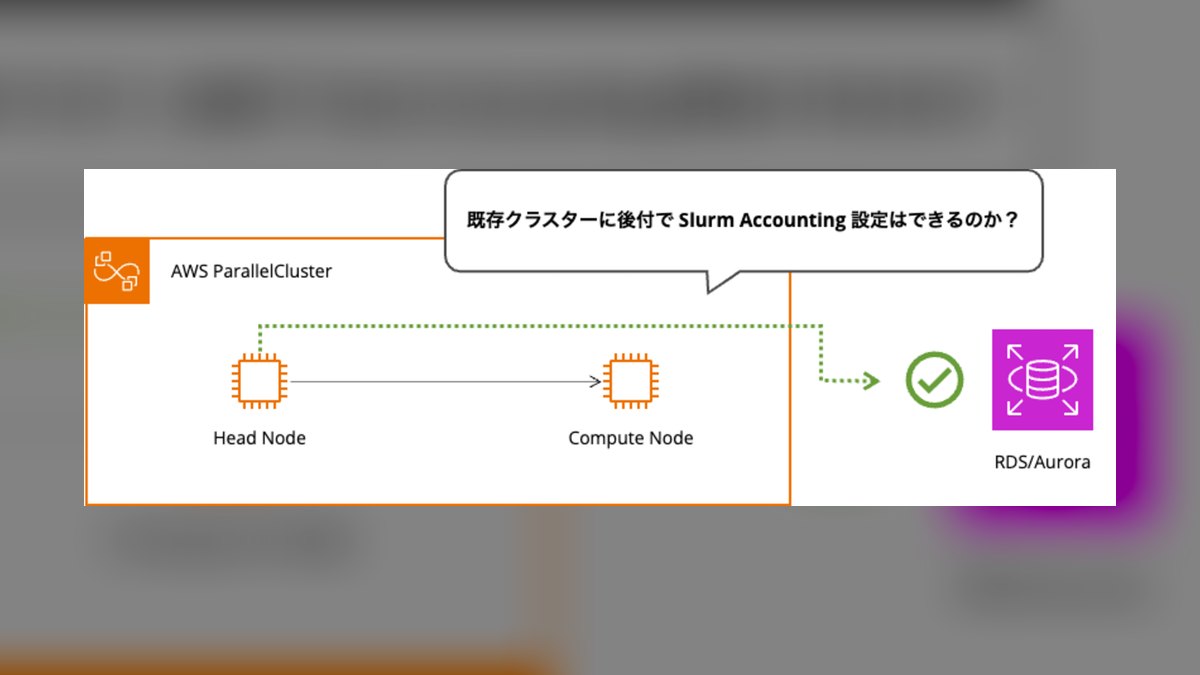
Slurm's built-in accounting system (slurmdbd, sacct, and sreport) ranks fourth because it has tracked per-job, per-user, and per-account GPU-seconds on shared HPC clusters for over two decades and remains the scheduler behind most TOP500 supercomputers. It records exact GRES (generic resource) consumption, including GPU count and time, directly at job completion, making it the most battle-tested chargeback data source for research computing.
It is built for academic and research HPC centers running batch GPU jobs, not for containerized cloud-native AI platforms. Sites trade modern dashboarding for rock-solid, decades-proven job-level accounting they already trust for grant and budget reporting. Unlike Kubecost or Run:ai, it assumes a traditional batch scheduler rather than Kubernetes.
5. NVIDIA Base Command Manager
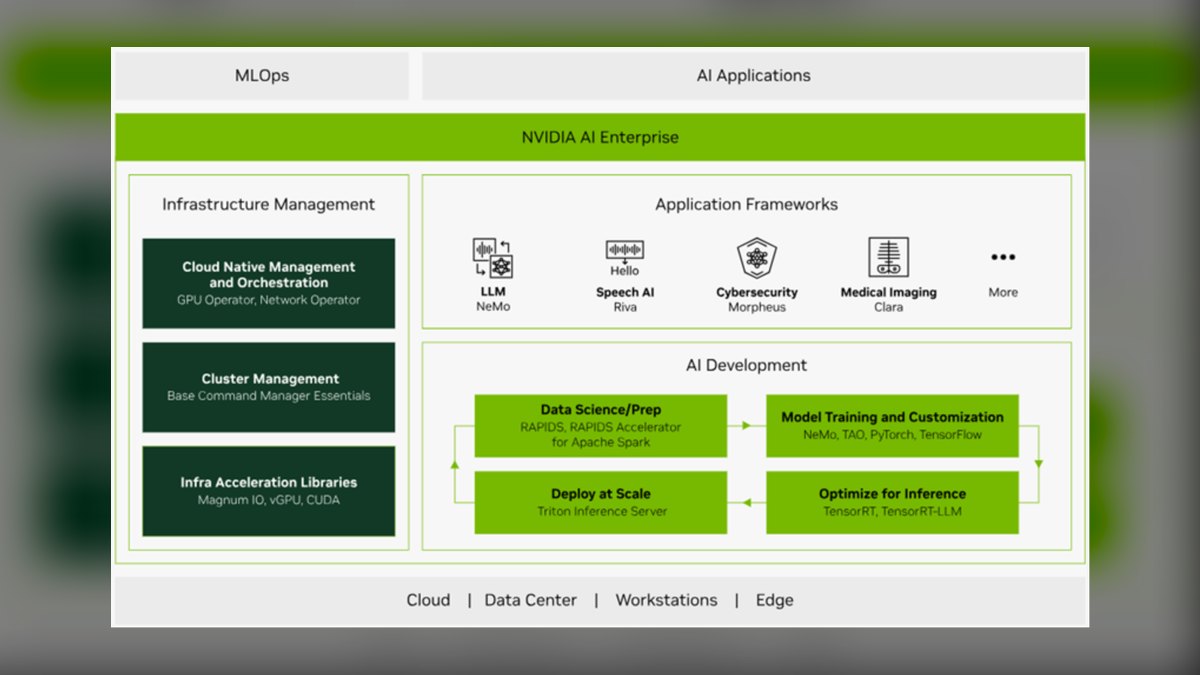
NVIDIA Base Command Manager ranks fifth for combining cluster provisioning with built-in usage accounting and reporting across DGX and NVIDIA-certified GPU systems, giving IT teams a single pane for both standing up nodes and billing usage back to departments. It descends from the Bright Cluster Manager lineage NVIDIA acquired, carrying forward mature workload accounting tooling into GPU-specific deployments.
It is aimed at data centers running dedicated NVIDIA hardware fleets rather than public-cloud GPU instances. Teams trade cloud-cost integration for deep, vendor-native visibility into on-prem GPU node health and allocation. It complements Slurm above it, often managing the same cluster's provisioning while Slurm handles job-level accounting.
6. Apptio Cloudability

Apptio Cloudability ranks sixth as a cloud financial management platform that maps GPU instance spend from AWS, Azure, and GCP back to business units through tagging-based showback reports, a capability IBM has continued investing in since acquiring Apptio in 2023. It handles reserved-instance and committed-use discount allocation across large multi-cloud GPU fleets that container-native tools alone don't cover.
It suits finance and FinOps teams who need cloud-provider billing reconciliation more than cluster-level scheduler data. Organizations trade GPU-utilization-level detail for broad, invoice-accurate financial reporting across an entire cloud estate. Compared to Kubecost, it operates at the billing-account layer rather than inside the cluster itself.
7. CAST AI
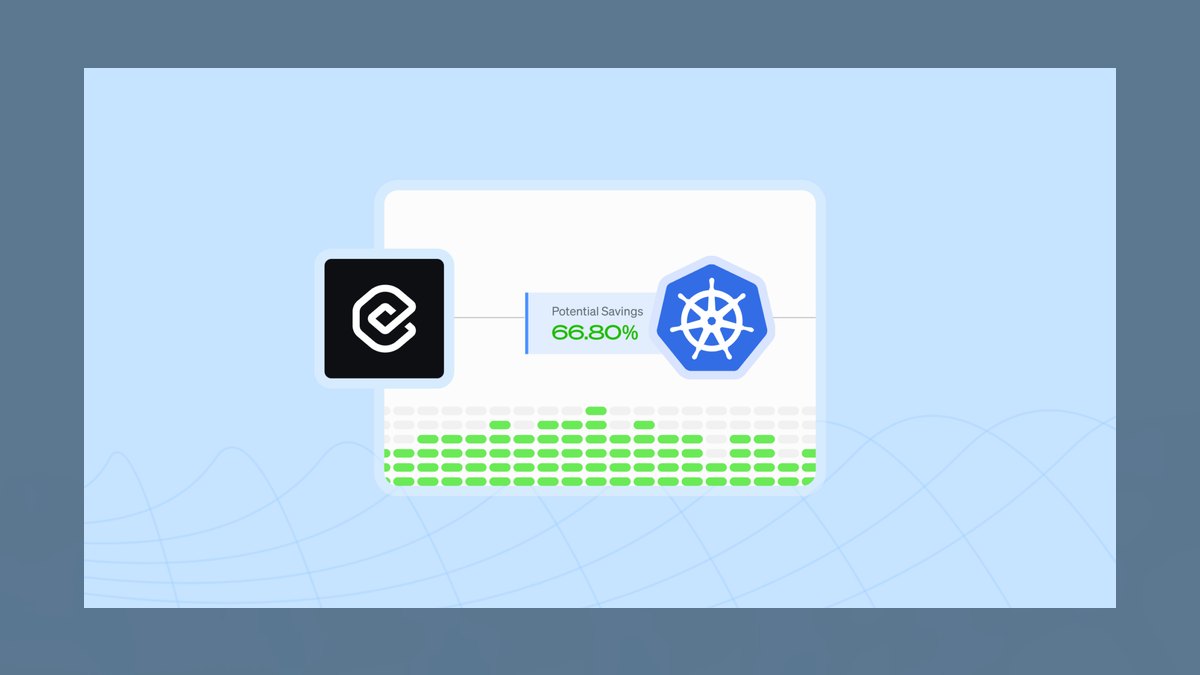
CAST AI ranks seventh for pairing Kubernetes cost visibility with automated rightsizing recommendations, showing GPU spend per workload alongside suggested node changes rather than reporting numbers alone. It offers a free cost-monitoring tier plus paid automation tiers, and it explicitly supports GPU node pools across AWS, GCP, and Azure Kubernetes clusters.
It fits teams that want cost showback to trigger direct optimization action, not just a monthly report. Users trade some of Kubecost's reporting depth for tighter integration between chargeback data and automated scaling decisions. It overlaps most with Kubecost in scope but leans harder into acting on the numbers than displaying them.
8. Vantage

Vantage ranks eighth as a cloud cost visibility platform that built out dedicated GPU cost tracking and Kubernetes cost allocation reports, letting teams filter cloud bills specifically by GPU instance families like AWS P4/P5 or GCP A2/A3. It layers tagging and cost-report automation on top of raw billing exports from the major cloud providers.
It is built for cloud-first teams renting GPU capacity from hyperscalers rather than running owned on-prem clusters. Users trade cluster-internal scheduler metrics for clean, provider-billing-accurate GPU spend dashboards. It sits closer to Apptio Cloudability in scope, but with a lighter, self-serve setup aimed at smaller platform teams.
9. Densify

Densify ranks ninth for its resource-optimization engine that generates GPU rightsizing and utilization reports usable as a showback input, flagging underused GPU instances and containers so finance can attribute waste back to owning teams. It has offered cloud and Kubernetes resource analytics for over a decade, predating most GPU-specific tooling on this list.
It suits organizations that already have a separate billing/chargeback system and want utilization-based justification data feeding into it, rather than a standalone invoicing report. Teams trade native chargeback dashboards for deep efficiency analytics. Compared to CAST AI, it focuses more on recommendation accuracy than automated remediation.
10. Harness Cloud Cost Management
Harness Cloud Cost Management ranks tenth because it extends Harness's CI/CD and DevOps platform with Kubernetes and cloud cost visibility, including GPU node cost allocation, as an add-on for teams already standardized on Harness pipelines. It provides anomaly detection and budget alerts tied to namespace and label-based cost attribution.
It fits teams who want chargeback reporting bundled inside a platform they already use for deployment rather than adopting a dedicated cost tool. Organizations trade the deep GPU-scheduler specialization of Run:ai or Slurm for convenience inside an existing DevOps suite. It is the most general-purpose entry here, better suited to smaller GPU footprints than large dedicated research clusters.
How we ranked these
We measured how precisely each tool attributes GPU-hours to a team, project, or namespace, and weighted native DCGM metric ingestion, MIG and time-slicing awareness, and Slurm/Kubernetes scheduler integration heaviest. Idle-GPU detection, multi-cluster rollups, and automated monthly showback/chargeback report generation counted next. Tools built for CPU-centric cloud billing that bolt on GPU support scored lower than platforms designed around fractional GPU accounting from the start.
We ignored list-price comparisons, since GPU chargeback tools are usually priced per node or as a percentage of managed spend and negotiated case by case. We also skipped raw cloud-provider cost explorers (AWS Cost Explorer, GCP Billing) since they report spend, not per-tenant GPU utilization, and skipped pure APM tools lacking DCGM hooks. Vendor-reported accuracy claims were treated as marketing, not evidence, unless independently reproducible.
What to look for
What actually matters is whether the tool can attribute a fractional GPU-second to the job that used it, not just the node it ran on — multi-tenant clusters using MIG partitions or time-slicing need per-slice metering, not per-node averaging. Second, check whether showback reports map cleanly to your existing cost-center or Kubernetes namespace structure, since re-tagging thousands of jobs after the fact is what actually kills chargeback rollouts.
The most common mistake is picking a general cloud-cost tool and assuming it handles GPUs like it handles CPU and storage — most were never built to read DCGM metrics or understand MIG slices, so they either fall back to flat per-node division or simply can't see inside a shared GPU at all. Confirm live DCGM or NVML integration during a trial before signing anything.
Related questions
What's the difference between chargeback and showback for GPU clusters?
Showback reports GPU spend to a team without billing them for it — a visibility tool meant to change behavior through awareness. Chargeback actually debits a cost center's budget for the GPU-hours it consumed, usually pulled from the same metering data. Most organizations start with showback for a few months before flipping chargeback on, once teams trust the attribution numbers.
Does Kubernetes MIG partitioning change how chargeback tools meter usage?
Yes — MIG splits one physical GPU into isolated hardware partitions, so a tool metering at the node or GPU level will bill every tenant for the whole card regardless of which slice they used. Tools need MIG-aware DCGM exporters to see per-partition utilization and memory, otherwise the chargeback numbers silently average out and heavy users get subsidized by light ones.
Can Slurm's built-in accounting replace a dedicated chargeback tool?
Slurm's sacct and sreport can produce raw GPU-hour usage per job and user out of the box, which covers basic HPC showback for free. What it lacks is multi-cluster rollup, a self-serve dashboard for non-admin stakeholders, and integration with cloud billing for hybrid Slurm-plus-cloud-burst setups — that's usually where teams layer a commercial tool on top of Slurm's raw accounting data.
How do these tools handle idle GPU time in chargeback calculations?
Most mature tools distinguish allocated-but-idle time from actively-computing time using DCGM utilization samples, and let admins choose whether idle reservation time bills at full, discounted, or zero rate. This matters because researchers often hold a GPU allocation for a multi-hour job but only use it in bursts — billing 100% of reserved time punishes normal interactive workflows.
What's the setup cost of adding chargeback to an existing GPU cluster?
Beyond license or subscription fees, the real cost is deploying the DCGM exporter and Prometheus stack across every node if it isn't already running, then mapping existing namespaces, projects, or accounts to cost centers — a one-time tagging exercise that can take longer than the software install itself, especially on clusters that grew without consistent labeling conventions.
Do these tools work across both on-prem GPU clusters and cloud GPU instances?
The strongest ones do, pulling DCGM or NVML metrics from bare-metal and Kubernetes nodes while also ingesting AWS, GCP, or Azure billing APIs for cloud-rented GPU instances, then reconciling both into one report. Tools built purely for one environment — a Slurm-only accounting tool, or a cloud-only cost explorer — leave a visibility gap the moment a team bursts workloads to the other side.
How often should GPU chargeback reports be generated for stakeholders?
Monthly is the standard cadence for finance-facing chargeback invoices, matching budget cycles, but engineering teams benefit from a daily or near-real-time dashboard for catching runaway jobs before the monthly bill arrives. The best tools support both: a live utilization view for engineers and an automated monthly PDF or API export for finance and leadership.
Are open-source options like OpenCost viable for GPU showback, or is a commercial tool required?
OpenCost handles Kubernetes-native GPU allocation showback well and is free, making it a solid starting point for teams already running Prometheus and DCGM exporters. It lacks polished multi-cluster consolidation, enterprise SSO, and dedicated support, which is where commercial platforms earn their subscription once a cluster's chargeback program needs to serve auditors or finance, not just engineers.
FAQ
What is GPU chargeback and why do shared clusters need it?
GPU chargeback is the practice of billing internal teams or projects for the actual GPU-hours they consume on a shared cluster, turning a fixed infrastructure cost into a variable, attributable one. Shared clusters need it because GPUs are expensive and scarce — without per-team visibility, usage tends to sprawl unchecked and nobody has an incentive to release idle capacity.
Is Run:ai still a standalone product after the NVIDIA acquisition?
NVIDIA acquired Run:ai in 2024 and has folded its scheduling and utilization features into the NVIDIA AI Enterprise and Base Command ecosystem, though existing customers still run its orchestration and chargeback-relevant metering layer. Buyers evaluating it in 2027 should confirm current packaging and whether standalone licensing is still offered outside an NVIDIA hardware or software bundle.
What is the NVIDIA DCGM exporter and why does it matter for chargeback?
The DCGM (Data Center GPU Manager) exporter is NVIDIA's official Prometheus exporter for per-GPU utilization, memory, temperature, and power metrics, and it's the data source nearly every serious chargeback tool relies on. Without DCGM feeding real per-device telemetry, a tool is stuck estimating usage from job scheduler logs alone, which misses idle time and multi-tenant sharing entirely.
Can Kubecost meter GPU usage, or is it CPU/memory only?
Kubecost added GPU cost allocation by integrating with the DCGM exporter, letting it attribute GPU spend to namespaces, deployments, and labels the same way it already handled CPU and memory. It's a natural fit for teams already using Kubecost for general Kubernetes cost visibility who are now adding GPU nodes to the same clusters.
How does Vantage handle GPU cost visibility compared to cloud-native cost explorers?
Vantage aggregates billing data across AWS, GCP, Azure, and several GPU cloud providers (like Lambda and CoreWeave) into one dashboard, which native cost explorers can't do since each only sees its own cloud. For teams renting GPUs from multiple specialized providers, that consolidated view is often more useful than deeper per-partition metering.
Does Datadog Cloud Cost Management support GPU-level chargeback?
Datadog's Cloud Cost Management module ingests cloud billing exports and correlates them with its existing infrastructure monitoring, including GPU utilization metrics from its NVIDIA integration, letting teams already on Datadog for observability add cost attribution without a separate tool. It's strongest for teams whose GPUs already report into Datadog's APM and infrastructure monitoring.
What role does Apptio Cloudability or Flexera One play for enterprise GPU chargeback?
These are enterprise FinOps platforms built for broad multi-cloud financial governance — budgeting, forecasting, and chargeback across all infrastructure, not just GPUs — that layer GPU cost data in as one line item among many. They fit large enterprises that already run their FinOps practice on one of these platforms and want GPU spend folded into the same governance process rather than a standalone tool.
Do these tools require agents installed on every GPU node?
Most do, in the form of the DCGM exporter (or NVML-based equivalent) running as a lightweight daemon or Kubernetes DaemonSet on every GPU-equipped node, since that's the only way to read per-device utilization and memory directly from the driver. Agentless options exist for cloud-rented GPUs by reading provider billing APIs, but they sacrifice sub-node granularity like MIG slice attribution.
How much can chargeback visibility actually reduce GPU spend?
Organizations that implement chargeback commonly report double-digit reductions in idle GPU-hours within the first quarter, simply because teams that see a bill attached to their name start releasing reservations and right-sizing jobs they'd otherwise leave running. The mechanism is behavioral, not technical — the tool only surfaces the number; the savings come from teams acting on it.
What's a realistic timeline to roll out chargeback across an existing shared GPU cluster?
Most teams take six to twelve weeks: two to three weeks deploying DCGM exporters and Prometheus if not already present, two to four weeks mapping namespaces or projects to cost centers, and the remainder running showback-only in parallel with the old process before flipping on actual billing, giving stakeholders time to dispute attribution errors before money changes hands.
Sources
- https://www.kubecost.com/
- https://www.opencost.io/
- https://developer.nvidia.com/dcgm
- https://slurm.schedmd.com/accounting.html
- https://www.run.ai/
- https://cast.ai/
- https://www.vantage.sh/
- https://www.datadoghq.com/product/cloud-cost-management/
- https://www.apptio.com/products/cloudability/
- https://www.flexera.com/flexera-one
Related on PULSE
- [More chargeback and showback tools for shared gpu clusters rankings and buying guides](/knowledge)
- [PULSE Tools and calculators](/tools)
- [Everything on PULSE RevOps](/)
 pulse-recentThe 10 Best AI Tools for Canary Deployments of ML Models in 2027
 pulse-recentThe 10 Best Disaster Recovery Tools for AI Infrastructure in 2027
 pulse-recentWhat SLA uptime should you set for a production LLM inference endpoint in 2027?
 pulse-recentWhat is the infrastructure cost difference between fine-tuning a model and training one from scratch in 2027?
 pulse-recentThe 10 Best AI Tools for API Rate Limiting and Throttling in 2027
 pulse-recentHow do you negotiate committed-use discounts for GPU cloud contracts in 2027?
 pulse-recentHow many GPUs do you need to serve 10,000 inference requests per minute in 2027?
 pulse-recentHow much does INT4 quantization cut LLM inference costs compared to FP16 in 2027?
 pulse-recentThe 10 Best AI Tools for Open-Source Model License Compliance in 2027
 pulse-recentThe 10 Best AI Cost Management Platforms for Enterprises in 2027