
How Do I Score Reps at My Multi-Unit Retail Chain in 2027?
 Curated byKory White · Fractional CRO · Maryland
 PULSEKNOWLEDGE LIBRARY
Quality
Certified

Score reps at a multi-unit retail chain with one weighted multi-KPI composite applied identically at every door. Rate each associate 1–5 on units, attach rate, warranty penetration, loyalty enrollments, credit applications, basket size, and conversion, multiply by weights, and sum. One number, published chain-wide, tied to coaching and pay.
What a chain-wide rep score is and why single-metric ranking fails
A rep score is a single composite number that summarizes how completely one associate sells the basket your chain actually makes money on. It is not a sales report. A sales report tells you what happened at the register; a score tells you whether the person behind the register is doing the whole job. The distinction matters more in a multi-unit environment than in a single store, because in a single store the owner watches the floor and fills in the gaps by eye. Across ten, forty, or two hundred doors, nobody watches. The only thing that travels between locations is a number, and if that number is "sales volume," the number is lying to you.
Here is the failure mode that shows up in almost every chain that ranks on one metric. An associate posts the highest revenue in the district. They are celebrated at the district call. Then someone pulls the margin detail and finds a warranty attach rate near zero, no loyalty enrollments in six weeks, and a basket that is essentially one big-ticket item per transaction. They are not selling. They are taking orders from customers who walked in already decided on the most expensive thing in the store. Meanwhile an associate two doors over posts 20% less revenue but attaches protection plans on a third of eligible transactions, enrolls loyalty on most of them, and moves accessories on nearly every unit. On gross profit dollars, the second associate is worth more. On the leaderboard your chain publishes, they are invisible.
Single-metric ranking also creates predictable, rational gaming. People optimize what you measure. Rank on units and associates cherry-pick the fast, easy transactions and let the complicated ones drift to whoever is nearby. Rank on revenue and they hover near the premium fixtures and let the entry-price customer wander. Rank on conversion alone and they stop greeting anyone who looks like a browser, which quietly kills traffic-to-transaction over a season. None of this is bad behavior — it is your scoreboard working exactly as designed. The fix is not more discipline. It is a scoreboard with enough dimensions that there is no single easy lane to camp in.
The second reason a composite matters in a multi-unit chain is comparability. Store A sits in a high-income trade area and does twice the volume of Store B with the same headcount. Rank raw output and every associate at Store B looks mediocre forever, which destroys any incentive value the ranking had. A weighted rate-based composite — attach *rate*, warranty *penetration*, conversion *percentage*, loyalty enrollments per eligible transaction — largely neutralizes trade-area advantage, because rates measure what the associate did with the traffic they got rather than how much traffic walked through the door. You still normalize for a few structural differences, but you start from a metric family that is far more portable across locations than dollars.

The third reason is operational: a published composite gives store managers something concrete to coach. "Sell more" is not coachable. "Your warranty penetration is a 2 and everything else is a 4, so this week we're role-playing the protection-plan conversation at the counter" is coachable in a ten-minute huddle. The score's real product is not the ranking. It is the specific, narrow coaching instruction that falls out of the lowest line on each person's card.
Building the KPI matrix: lines, weights, and levels
Start by listing every behavior a complete associate at your chain should produce. Most retail chains land on seven to nine lines. A typical matrix for a specialty or big-ticket retailer:
- Core units or transactions — raw selling volume, the floor of the job
- Big-ticket or premium conversion — share of transactions that include a step-up product
- Attach and accessories rate — accessory units per primary unit, or attach dollars per transaction
- Warranty / protection plan penetration — plans sold divided by eligible transactions
- Loyalty enrollments — sign-ups per eligible transaction, not raw count
- Store card or credit applications — applications per eligible transaction, where you offer one
- Average basket size — dollars per transaction
- Conversion rate — transactions divided by traffic, if you have door counters
- Operational or service quality — a manager-observed line covering standards, availability, survey scores
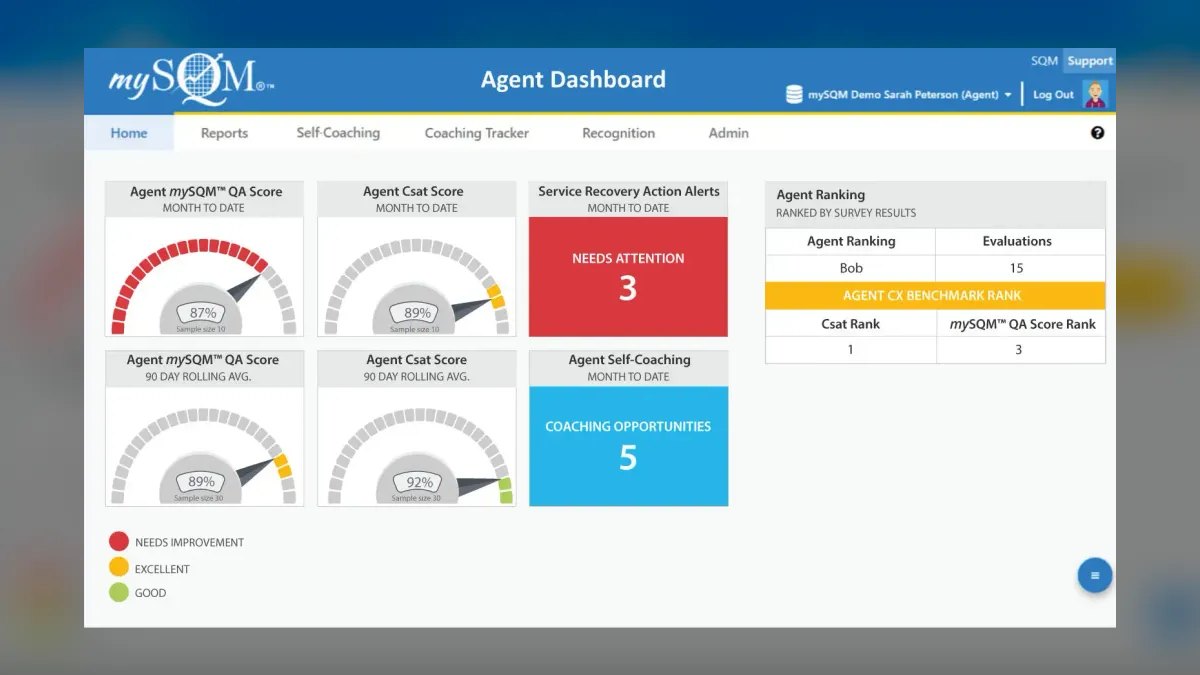
Rate-based lines are the backbone. Volume lines exist so the matrix does not reward a person who attaches beautifully on four transactions a day. Keep at least one raw-volume line and let the weights do the balancing.
Next, weight the lines. Weights should follow gross-profit contribution and strategic priority, not tradition. Protection plans and credit programs usually carry far richer margin than the unit itself, which is why chains that weight them at parity with units almost always under-sell them. A defensible starting distribution for a big-ticket specialty chain:
| Line | Weight |
|---|---|
| Core units / transactions | 25% |
| Attach and accessories rate | 20% |
| Warranty / protection penetration | 20% |
| Loyalty enrollments | 12% |
| Credit or store-card applications | 10% |
| Average basket | 8% |
| Conversion rate | 5% |
Weights must sum to 100%. Keep no line under about 5% — a 2% line is noise that nobody will chase, and it dilutes the signal of everything else. Keep no line over roughly 30% either, or you have quietly rebuilt single-metric ranking with extra steps.

Then set the 1-to-5 levels. This is the step most chains botch, because they anchor levels on opinion. Anchor them on your own distribution instead. Pull twelve weeks of data per line across the whole chain, then cut it: level 1 is roughly the bottom 10–15%, level 2 the next band up to about the 35th percentile, level 3 straddles the median, level 4 runs to about the 85th percentile, level 5 is the top 10–15%. Write the resulting thresholds down as absolute numbers — "warranty penetration: L1 under 8%, L2 8–14%, L3 15–22%, L4 23–32%, L5 above 32%" — so the score is a fixed standard rather than a rank that shuffles every month. Fixed thresholds mean an associate can improve without someone else having to get worse, which is essential for morale.
The composite is then simply the sum of weight × level across all lines. With 1–5 levels and weights summing to 100%, every score lands between 1.00 and 5.00, and 3.00 is by construction chain-average. That readability is worth a lot: any store manager can look at a 2.6 and know it is below the middle without a decoder ring.
Two calibration details. First, exclude tiny denominators — a rep with six eligible warranty transactions in a month should have that line suppressed and their weight redistributed proportionally across the remaining lines, or you will score noise. Set a floor of roughly 20–30 eligible transactions per line per period. Second, re-cut the thresholds no more than twice a year. Recutting monthly turns fixed standards back into a rolling curve and destroys the improvement narrative.
The step-by-step rollout process
Rolling out a chain-wide score is a data project, a change-management project, and a comp project stacked on top of each other. Sequence matters. The order below has the property that you never publish a number you cannot defend.

Step one — audit your data plumbing (week 1–2). Every line on the matrix has to be attributable to a single associate at the transaction level. This is where most rollouts die. Warranty sales frequently post to the store rather than the seller. Loyalty enrollments may be captured at the terminal with no employee ID. Credit applications often live in the finance partner's portal, disconnected from the POS. Walk each line and answer: can I get this per associate, per week, without manual entry? Any line that fails that test either gets fixed at the POS or gets dropped from version one. Never ask store managers to hand-key numbers into a sheet — the data will be late, wrong, and quietly self-serving within a quarter.
Step two — pull the baseline and cut the levels (week 2–3). Twelve weeks of history, all doors, every line. Cut the percentile bands, write down the absolute thresholds, and then sanity-check them against people you already know. Your three best associates should land at 4.2 or better. Your known problem performers should land under 2.5. If the matrix disagrees with what every district manager already knows, the weights or thresholds are wrong — fix them before anyone sees a score.
Step three — shadow-run for four to six weeks (week 4–9). Calculate and distribute scores to district and store managers only. Associates see nothing. This is where you find that Store 22's conversion looks impossible because its door counter double-counts the vestibule, and that one associate's attach rate is inflated because returns are not netting out. Every rollout produces a list like this. Finding it in the shadow window costs you a spreadsheet fix; finding it after go-live costs you the credibility of the entire program.
Step four — publish the matrix, not just the scores (week 10). Every associate should be able to see the lines, the weights, the thresholds, and their own levels. Transparency is not a nicety here; it is the mechanism. A hidden score is experienced as surveillance and produces resentment. A published one is a game with visible rules, and people play games.

Step five — run coaching cycles before touching pay (week 10–18). For the first two months the score drives conversation only. Weekly, each store manager takes each associate's lowest-weighted line and runs one specific intervention on it. Monthly, district managers review the bottom decile chain-wide with store managers to separate skill gaps from schedule or fixture problems.
Step six — wire the composite to money (month 5+). Only after the score has proven stable and defensible. Details in the next section.
Costs, timelines, and what the numbers typically look like
Budget for this in two buckets: the reporting build and the incentive dollars. They are very different sizes.

The reporting build. If your POS already attributes every line to an employee ID, version one is a spreadsheet or a BI dashboard, and the real cost is analyst time — realistically 40 to 80 hours to build the extract, cut the thresholds, and produce a per-associate view, plus a few hours a week to maintain. Chains that already run Power BI, Looker, Tableau, or a POS-native analytics module can usually stand this up inside a month with existing licenses. If attribution is broken on two or three lines, add a POS configuration project; that is where timelines stretch from weeks to a quarter, because it usually means retraining every register on capturing an employee ID at a step where they currently do not.
Purpose-built sales-performance and gamification platforms exist in this space — Ambition and Spinify both build multi-metric scorecards and push leaderboards to floor displays and messaging tools; commission-automation tools such as QuotaPath, CaptivateIQ, and Xactly specialize in calculating and paying multi-component plans; and general CRM platforms like Salesforce can host a custom scorecard if your POS and loyalty data already land there. Most of these price per user per month and many quote rather than publish, and the meaningful cost driver in retail is headcount: paying per seat across 400 associates is a very different bill than paying across a 30-person inside-sales team. Get a quote against your real associate count before assuming the software route is cheaper than the analyst route. Verify current pricing directly with each vendor — it moves.
The incentive dollars. This is the larger and more sensitive number. Most retail chains already spend something on spiffs; the score usually redirects that spend rather than adding to it. A common structure puts variable pay somewhere in the range of 5–20% of an associate's total compensation depending on format, with big-ticket and commission-heavy formats far higher. The change you are making is to the *shape* of that spend, not necessarily the size: instead of paying a flat dollar amount per protection plan, you pay against composite tiers. Model the new plan against the last two quarters of actual performance before launching. The number you are looking for is total payout under the new plan versus total payout under the old on identical historical data. If the new plan costs 15% more on identical results, you either intended that as an investment or you have a math problem — decide which before go-live, not after the first payroll.
Timelines. A realistic end-to-end schedule for a 10–50 door chain with reasonable data: two weeks of data audit, one week to baseline and cut, four to six weeks shadow, then publication, then eight weeks of coaching-only, then comp integration — roughly four to five months from kickoff to money. Chains with broken attribution should add a quarter. Chains over about 100 doors should add time for a piloted regional rollout rather than a chain-wide big bang, because the coordination cost of retraining every store manager simultaneously is real.

Behavioral timelines. Expect three to four weeks of confusion and complaint after publication, regardless of how well you communicate it. Expect the first visible movement in the lowest-weighted lines around week six to eight — attach and loyalty typically respond fastest because they are the most coachable. Expect warranty penetration to move slower, because it depends on a conversation people are uncomfortable having. Expect some attrition in months three through six among associates who were riding one metric; plan the staffing for it rather than being surprised by it.
Where multi-unit chains get this wrong
Weighting what is easy to count instead of what makes money. Units and dollars are trivially available from any POS, so they get weighted heavily by default. Protection plans and credit programs are harder to attribute, so they get 5% or get left off entirely — and then leadership wonders why penetration is flat. If a line drives real gross profit, fix the attribution rather than under-weighting it into irrelevance.
Ranking raw output across unlike stores. Publishing a chain-wide leaderboard on revenue guarantees the same three high-traffic doors occupy the top ten forever. Everyone else stops reading it inside a month. Rate-based lines fix most of this, and where structural differences remain — a store with no financing offer, or a location where the product mix genuinely excludes a category — suppress that line for those associates and redistribute its weight rather than scoring them against something they cannot sell.
Changing weights constantly. Re-weighting is a powerful lever precisely because it is rare. A chain that shifts weights every month teaches its floor that the score is arbitrary, and associates stop responding to it entirely. Re-weight when strategy genuinely changes — a vendor protection-plan push, a holiday loyalty campaign — announce it a full period ahead, and hold it for at least a quarter.

Launching with pay attached on day one. The single most common cause of a failed rollout. Every data defect in your first month becomes an argument about someone's paycheck, and once associates believe the score can cost them money unfairly, no amount of later accuracy wins them back. Coach on it for two months first.
Skipping the store manager. The score is calculated centrally but it lives or dies with the store manager, who has to run the weekly conversation. If the store manager does not understand the weights, cannot explain why someone's composite dropped, or quietly tells their team to ignore it, the program is dead in that door regardless of how good the math is. Train managers before associates, and score managers on their team's composite movement.
Treating the composite as a firing document. The score identifies gaps. Gaps are usually coachable, and sometimes they are structural — an associate stuck on the back wall all quarter cannot post the same conversion as someone at the front. Investigate schedule, zone assignment, and fixture placement before concluding it is a people problem. A score used primarily as termination evidence will be met with quiet, effective sabotage of the data that feeds it.
Ignoring returns and cancellations. Warranty plans that cancel in the cooling-off window and units that come back the following week both need to net out of the score, ideally on a 30- to 60-day lag. A composite that only counts the sale rewards high-pressure selling that generates returns and damages the customer relationship, which is the exact opposite of what you built it for.

Under-communicating the math. If an associate cannot reconstruct their own score from their own numbers, they will not trust it. Publish the levels, the thresholds, and the weights, and give every person a card that shows the arithmetic on their own composite.
Decision framework: which scoring model fits your chain
Not every chain needs the same instrument. Match the model to your door count and data maturity.
Under 10 doors with clean POS attribution: a weighted composite in a spreadsheet, refreshed weekly, is genuinely sufficient. Do not buy software. The owner or ops lead can maintain it in an hour a week, and the flexibility is worth more than automation at this scale.

10 to 50 doors: a BI-hosted composite with automated refresh and a per-associate view every store manager can pull. This is the scale where manual maintenance breaks and where a dedicated scorecard or gamification platform starts to earn its cost, mainly by removing the analyst from the weekly loop and putting the leaderboard where associates actually see it.
50 to 200+ doors: you need automated calculation, automated distribution, and automated payout. At this scale the comp calculation itself becomes the bottleneck — multi-component plans across hundreds of associates paid monthly is exactly the problem commission-automation software exists to solve. Piloting by region is mandatory; a simultaneous chain-wide launch at this size produces more manager confusion than the program can survive.
Broken attribution at any size: fix the POS first. Do not build a score on lines you cannot attribute, and do not paper over it with manager-entered numbers.
Formats where the associate does not control the sale — high-volume convenience, quick-service, self-checkout-heavy grocery — should weight the service and operational lines much more heavily and the transactional lines much less, or skip the individual composite entirely in favor of a store-level score. Scoring an individual on conversion when the customer chose the item before entering the store measures traffic, not the person.
Related questions
How many KPIs should be on the scorecard?
Seven to nine. Fewer than five and associates can camp on one lane; more than ten and no line carries enough weight to change behavior. Every line should be worth at least 5% and no line more than about 30%.
Should store managers be scored on the same matrix?
No — score them on their team's composite movement, staffing coverage, and store-level rate performance. Managers influence outcomes through coaching and scheduling, not personal transactions, so scoring them on their own units rewards the wrong behavior.
How do I compare an associate at a high-traffic store to one at a slow store?
Use rate-based lines — attach rate, warranty penetration, conversion percentage, enrollments per eligible transaction — instead of raw dollars or units. Rates measure what someone did with the traffic they received rather than how much traffic the trade area delivered.
How often should scores be published to the floor?
Weekly for visibility, monthly for consequences. Weekly keeps behavior top of mind; monthly is a large enough sample to be statistically fair and matches most spiff cycles. Daily leaderboards create noise and reward luck.
What if an associate refuses to sell credit applications?
Investigate first — some associates decline because they have watched customers get into trouble. If it is a conviction, that line's weight can be redistributed for them; if it is discomfort with the conversation, it is a training problem, not a scoring problem.
FAQ
What exactly is a weighted multi-KPI scorecard?
It is a system that rates each associate 1 to 5 on several selling behaviors — units, attach rate, warranty penetration, loyalty enrollments, credit applications, basket size, conversion — assigns each behavior a percentage weight, and sums weight times level into one composite between 1.00 and 5.00. It rewards balanced performance across the full basket instead of volume in one category.
Will associates game the system once they know the weights?
They will optimize toward the weights, which is the point. Gaming becomes hard when six or seven lines each carry meaningful weight, because coasting on one drags the composite down through the others. The real risks to watch are returns and canceled protection plans — net those out on a 30- to 60-day lag and the incentive to force sales disappears.
How long before the score changes behavior on the floor?
Expect three to four weeks of adjustment and complaint, first movement in attach and loyalty around week six to eight, and slower movement in warranty penetration because it depends on a conversation people avoid. Meaningful chain-wide change typically shows in the second full quarter, not the first month.
Should the composite drive pay immediately?
No. Run it coaching-only for about eight weeks after publication. Every data defect surfaced early becomes a paycheck argument if money is attached from day one, and once associates believe the score can unfairly cost them, accuracy later will not restore trust. Wire it to spiffs and bonus around month five.
How do I handle a store with a product mix that excludes one KPI?
Suppress that line for those associates and redistribute its weight proportionally across their remaining lines so their composite still lands on the same 1.00–5.00 scale. Apply the same rule to anyone whose eligible-transaction count for a line falls below roughly 20 to 30 in the period.
How often should I re-cut the 1-to-5 thresholds?
Twice a year at most. Fixed absolute thresholds let an associate improve without someone else declining, which is what makes the score motivating. Re-cutting monthly turns it back into a rolling curve where half your team is below average no matter how much better they get.
Sources
- https://nrf.com/ — National Retail Federation research on retail operations, staffing, and store performance
- https://www.bls.gov/ooh/sales/retail-sales-workers.htm — U.S. Bureau of Labor Statistics occupational data for retail sales workers
- https://hbr.org/topic/subject/sales — Harvard Business Review coverage of sales compensation and performance management
- https://www.retaildive.com/ — Retail Dive news and analysis on retail operations and store performance
- https://www.mckinsey.com/industries/retail/our-insights — McKinsey retail practice insights on store productivity and workforce
- https://www.shrm.org/ — Society for Human Resource Management guidance on performance management and incentive pay
- https://www.consumerfinance.gov/ — Consumer Financial Protection Bureau guidance relevant to retail store-card and credit application practices
- https://www.gartner.com/en/sales — Gartner research on sales performance management and scorecard software categories
Related on PULSE
- How Do I Score My Retail Managers Across Stores?
- How Do I Decide How Many Reps to Schedule at Each Store in My Mattress Retail Chain?
- Do I Need a Fractional CRO for My Multi-Unit Retail Business?
- How Do I Know Where, When, and How Many People to Schedule at Each of My Multi-Unit Retail Locations?
- How Many Cashiers Should I Schedule Each Shift at My Convenience Store Chain?
- How Do I Figure Out How Many Reps to Schedule at Each of My Multi-Unit Cell Phone Stores?
This page will be disappearing soon. Save it to your device for $1 — or read it free while it is here.
@Kory-White- · if Venmo asks, the last 4 of my number are 2012
This page is gone.
This one is off the shelf now. $1 keeps it on your phone for good — the whole page, pictures and diagrams included.
 pulse-qHow Do I Set Attach Rates for My Service Fees in 2026?
 pulse-qHow Many Sales Reps Do I Need to Hire for My Dental Equipment Company in 2026?
 pulse-qHow Many Employees Should I Schedule Each Shift at My Tutoring Center in 2026?
 pulse-qHow Do I Make a Service Fee Tangible So It Adds Real Value in 2026?
 pulse-qHow Many Sales Reps Do I Need to Hire for My Pharmaceutical Company in 2026?
 pulse-qHow Many Sales Reps Do I Need to Hire for My Smart Home Integration Company in 2027?
 pulse-qHow Many Stylists Should I Schedule Each Day at My Hair Salon in 2026?
 pulse-qHow Many Sales Reps Do I Need to Hire for My Hot Tub and Spa Retailer in 2026?
 pulse-qWhat Service Fees Should a Locksmith Charge in 2026?
 pulse-qShould I Hire a Fractional CRO If I Need to Professionalize a Referral-Only Business in 2026?