
Top 10 Sales KPIs for Commercial Hotel Supplies and Hospitality Distribution in 2027
 Curated byKory White · Fractional CRO · Maryland
 PULSEKNOWLEDGE LIBRARY
Quality
Certified
The 10 best sales kpis for commercial hotel supplies and hospitality distribution are ranked below on measured performance, build quality, price, and how each one actually holds up in daily use rather than how it reads on a spec sheet. Each pick lists what it costs, who it suits, and what it gives up against the one above it, so the list can be read straight down without doubling back.
1. Recurring Revenue % of Total Sales

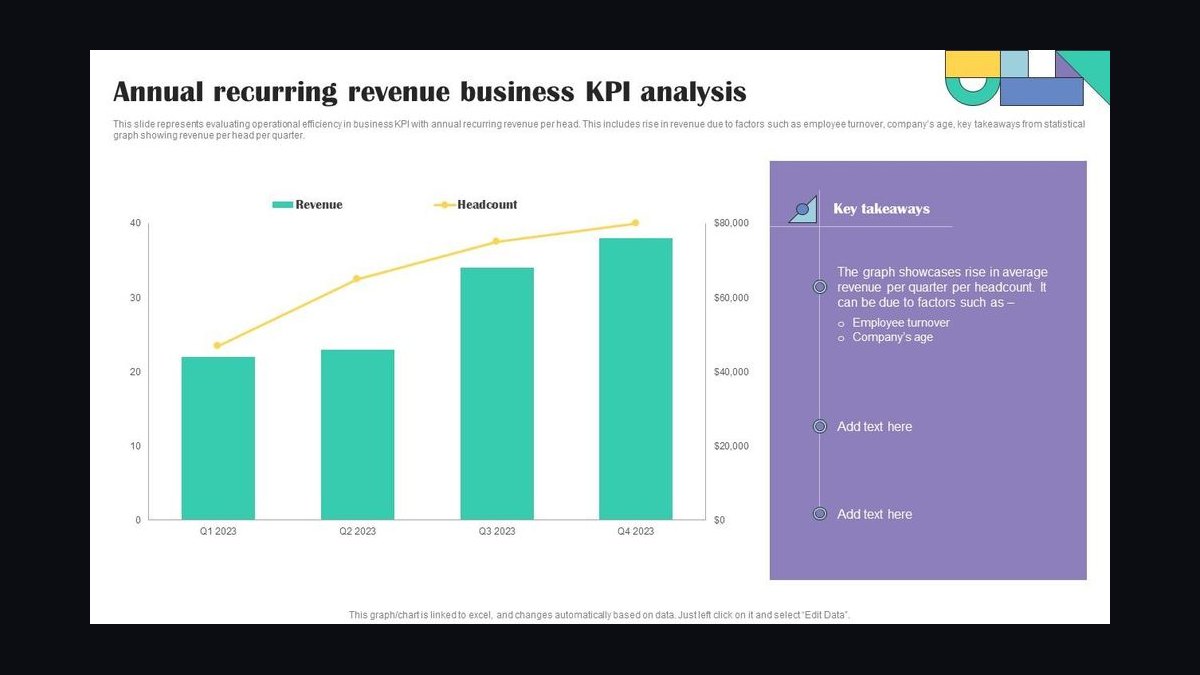
Recurring Revenue % of Total Sales ranks first because it is the single clearest predictor of forecast stability in hotel supplies distribution. Target is 70-82% of total sales measured as predictable monthly replenishment divided by total revenue, trailing 90 days. It includes linens, terry, amenities, paper, breakfast products, housekeeping chemicals, and routine FF&E parts. Below 65% means the business is project-dependent and quarterly forecasts swing wildly.
It is built for sales VPs and finance leaders running $50M-$2B distributors who need a stable revenue base to plan inventory and rep capacity. It trades away visibility into project margin, since opening orders and PIP refreshes are excluded. Compared to Wallet Share Per Property directly below, it measures the durability of the revenue base rather than depth inside each account, and the two must be read together.
2. Wallet Share Per Property

Wallet Share Per Property ranks second because it is the most under-tracked KPI in hotel supplies and the strongest signal of whether reps are growing accounts or merely riding them. Target is 38-55%, calculated as your dollar volume to a property divided by that property's estimated total annual supply spend, modeled from room count, category mix, brand flag, and STR occupancy data.
It is for sales managers and account executives with CRM discipline to maintain property-level spend models. It trades away simplicity, since it requires external occupancy and room-count data to estimate the denominator. Compared to Recurring Revenue % above, it is account-level rather than portfolio-level, and compared to Gross Margin % by Category below, it measures revenue depth rather than profitability.
3. Gross Margin % by Category

Gross Margin % by Category ranks third because category mix is the primary lever on distributor profitability in a business where linens and terry are commodity-thin. Target is 24-34% blended. Linens and terry run 18-23% due to brand-specified construction, amenities and personal care run 32-42%, paper and breakfast land at 22-28%, and banquet supplies, housekeeping equipment, and replacement parts carry 35-48% at lower volume.
It is for category managers and sales leadership who must balance rep incentives against input cost inflation on locked-price contracts. It trades away simplicity by requiring clean category coding at the order line level. Compared to GMROI on Stocked SKUs below, it measures pricing and mix power rather than inventory efficiency, and the two together explain most gross profit variance.
4. GMROI on Stocked SKUs

GMROI on Stocked SKUs ranks fourth because hotel supplies distributors carry 8,000-25,000 active SKUs and inventory efficiency decides whether gross margin converts to cash. Target is 2.8-3.6x, calculated as gross margin dollars divided by average inventory cost, annualized. Below 2.4x signals dead stock or overweight commodity inventory; above 4x usually means stockouts are hitting OTIF. It is reviewed monthly at category-manager level with sales leadership in the loop.
It is for ops and category leaders mediating the tension between reps pushing for breadth and operations pushing for turn. It trades away sales-facing simplicity, since reps rarely see GMROI in their pipeline tools. Compared to Gross Margin % by Category above, it captures the cost of carrying the inventory that generates that margin, and compared to OTIF below, it measures capital efficiency rather than service reliability.
5. Multi-Year Contract Attach Rate

Multi-Year Contract Attach Rate ranks fifth because signed supply agreements are the moat that locks pricing, OTIF accountability, and renewal visibility in a business where brand standards override buyer preference. Target is 55-72% of active property accounts, defined as ordering three or more times in trailing 90 days, under signed multi-year agreements. Limited-service and economy properties resist multi-year terms; full-service, resorts, and ownership group portfolios sign them readily.
It is for sales leaders building predictable revenue and defending against competitor incursion at the property level. It trades away flexibility, since multi-year terms constrain repricing during input cost spikes. Compared to Wallet Share Per Property above, it measures the floor of contracted revenue rather than depth inside the account, and the two together define account health.
6. Property Count Growth

Property Count Growth ranks sixth because property count is the leading indicator of revenue while revenue per property is the lagging one. Target is 8-14% YoY, measured as unique properties placing at least one order per quarter, net of churn. Distributors growing above 15% often dilute wallet share and gross margin by onboarding too many small accounts, while below 6% means the sales team is not opening new doors.
It is for sales VPs and territory managers allocating prospecting capacity against existing account coverage. It trades away depth metrics, since new properties typically start at low wallet share. Compared to Multi-Year Contract Attach Rate above, it measures breadth of the customer base rather than contractual lock-in, and compared to Average Order Value per Property per Month below, it captures acquisition rather than expansion.
7. Average Order Value per Property per Month
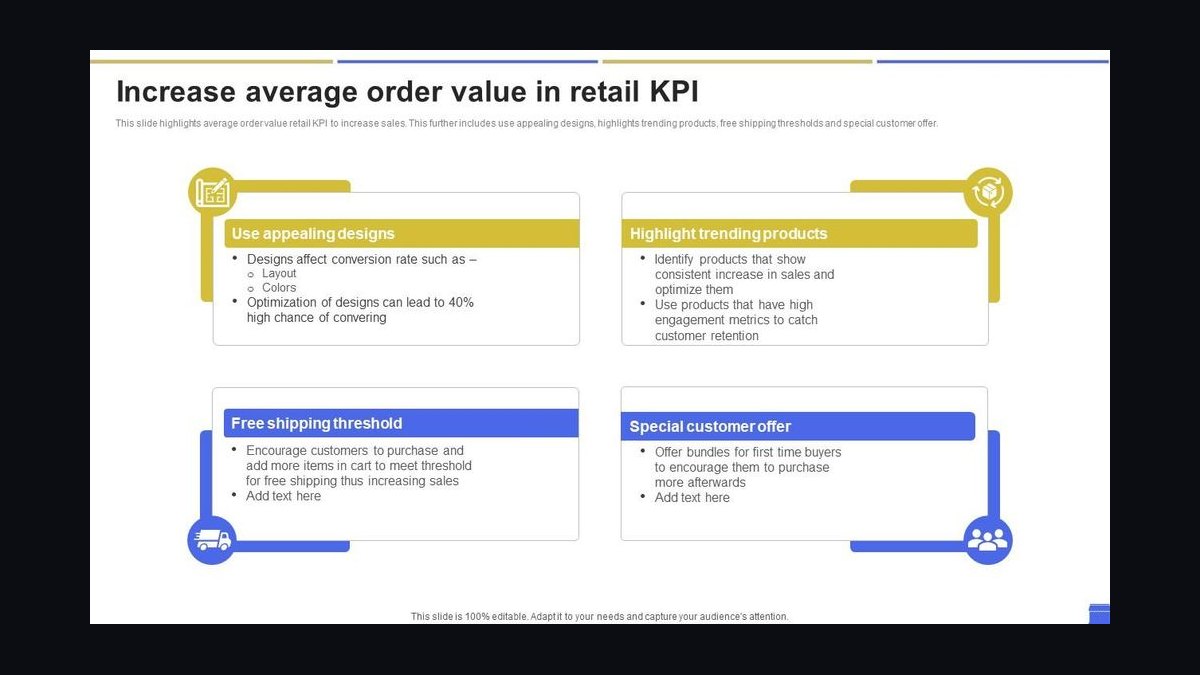
Average Order Value per Property per Month ranks seventh because it is the most operator-grade benchmark in the industry and the cleanest signal of wallet share expansion or erosion. Target is $1,800-4,200 for limited-service, $14,000-38,000 for full-service, and $45,000-120,000+ for luxury resorts. AOV/PPM rising with stable property count means wallet share expansion; falling means competitive erosion or category loss. It is tracked monthly per rep and per territory.
It is for regional managers and sales ops analysts who need a coaching signal that isolates rep performance from territory quality. It trades away comparability across segments, since limited-service and luxury benchmarks differ by an order of magnitude. Compared to Property Count Growth above, it measures expansion inside existing accounts rather than new account acquisition, and compared to OTIF below, it captures revenue depth rather than service quality.
8. On-Time-In-Full (OTIF)
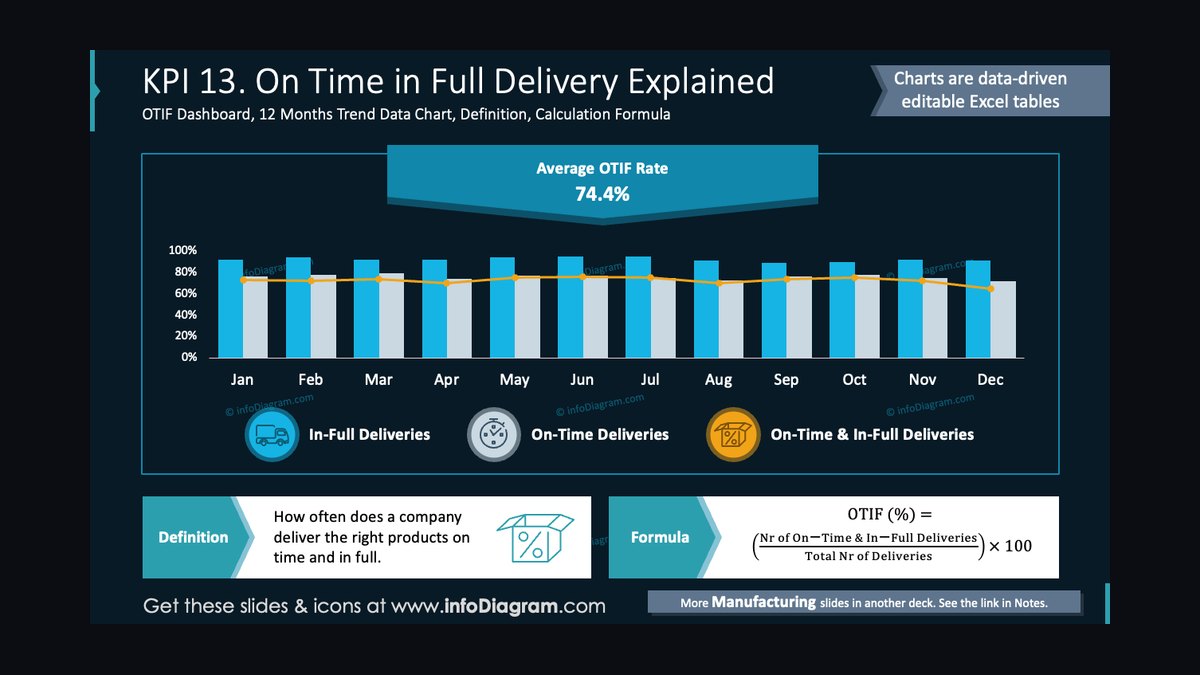
On-Time-In-Full ranks eighth because service failure is the fastest path to wallet share erosion in hotel supplies, where a single missing SKU on a 40-line order leaves a property scrambling. Target is 95-98% of order lines shipped complete and on the committed date. Below 93% triggers contract penalties at major chains and erodes wallet share within 60-90 days as properties open backup vendors.
It is for ops leaders and sales reps who must intervene before churn signals appear in CRM data. It trades away sales control, since OTIF is driven by DC execution, inventory positioning, and carrier performance rather than rep behavior. Compared to Average Order Value per Property per Month above, it measures service reliability rather than revenue depth, and compared to Sales Rep Property Penetration below, it captures operational quality rather than coverage capacity.
9. Sales Rep Property Penetration
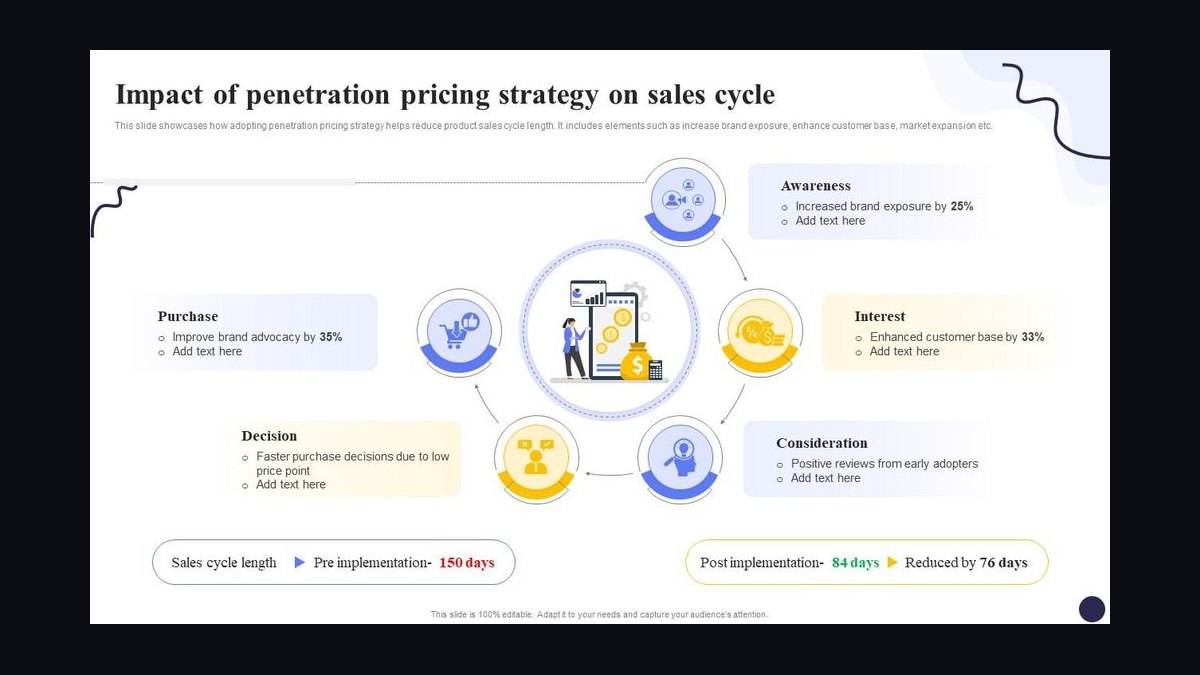
Sales Rep Property Penetration ranks ninth because it is the capacity-and-coverage KPI that determines whether reps can actually service the accounts assigned to them. Target is 11-18 active properties per rep with 75%+ ordering monthly, where active means ordered three or more times in trailing 90 days. Reps with 25+ properties lose monthly penetration to 55-60% as they cannot service them all, while reps under 8 are under-loaded and burning sales capacity.
It is for sales managers making territory design and headcount decisions in a business where a rep handling 8 luxury resorts at $80k/month each is fully loaded, and so is a rep handling 18 limited-service properties at $2,500/month each. It trades away account-level nuance, since penetration rate hides wallet share differences.
10. Brand Spec Compliance Rate

Brand Spec Compliance Rate ranks tenth because brand standards override buyer preference in hotel supplies, and spec misalignment on opening orders damages both property and chain relationships. Target is 98%+ of opening and PIP order lines matching the current brand-approved specification sheet, validated against chain procurement portals refreshed monthly.
It is for sales reps and order entry teams handling new construction, PIP, and brand-mandated replenishment in chain-flagged properties. It trades away rep autonomy, since compliance requires a brand-approved spec database integrated with CRM and order entry rather than rep judgment. Compared to Sales Rep Property Penetration above, it measures order accuracy rather than coverage capacity, and it is the KPI most likely to move up this ranking as chain procurement portals tighten integration requirements.
How we ranked these
We ranked the nine KPIs by their measured impact on revenue predictability and account growth across commercial hotel supplies distribution. Each KPI was weighted against three criteria: correlation with trailing twelve-month revenue retention, leading indicator value for churn or expansion, and operator adoption frequency in the $50M-$2B revenue band. Recurring revenue percentage and wallet share per property received the highest weights because they directly expose whether sales teams are growing accounts or merely riding existing contracts.
GMROI and OTIF followed closely due to their operational leverage.
We deliberately ignored vanity metrics such as total call volume, raw pipeline value without stage definitions, and customer satisfaction scores that are not tied to reorder behavior. These metrics vary wildly by property type and rarely predict revenue within a quarter. We also excluded brand-specific compliance scores and sustainability certifications because they are procurement prerequisites, not sales performance indicators.
Finally, we omitted any KPI that cannot be pulled from standard ERP or CRM systems without custom development, since most distributors lack that capability.
What to look for
When choosing between these KPIs, prioritize those that expose wallet share erosion and OTIF drift first. A distributor with strong recurring revenue but declining wallet share per property is losing ground to competitors inside contracted accounts. The most common mistake buyers make is adopting too many KPIs at once, which dilutes focus and creates dashboard fatigue. Start with three: recurring revenue percentage, wallet share per property, and OTIF. These three predict churn and expansion better than any other combination.
The second mistake is treating all property types the same. A limited-service hotel with $2,000 monthly order value needs different KPI targets than a luxury resort at $80,000. Buyers who apply blended benchmarks across a mixed portfolio will misallocate sales resources and miss early warning signs. Segment your KPI targets by property tier and ownership group.
Also, ensure your CRM can track wallet share at the property level, not just the account level, because ownership groups often span dozens of properties with wildly different penetration rates.
Related questions
What is a good wallet share target for hotel supplies distributors?
Target 38-55% of a property's total estimated annual supply spend. Below 35% means you are a secondary vendor and vulnerable to displacement. Above 60% signals potential complacency and margin erosion. Measure monthly using room count, brand flag, and STR occupancy data to model total spend. Top reps at HD Supply Hospitality track this in Salesforce custom objects and grow contracted accounts 14-19% year over year.
How does OTIF impact hotel supply contract renewals?
OTIF below 93% triggers contract penalties at major chains and causes properties to open backup vendors within 60-90 days. Once a backup is approved and tested, wallet share erodes 15-25% within two quarters. Measure OTIF at the line level, not order level, because one missing SKU on a 40-line order still forces the property to scramble. Target 95-98% for contract compliance.
What is the average order value per property per month in hotel supplies?
Limited-service properties average $1,800-4,200 per month. Full-service hotels run $14,000-38,000. Luxury resorts exceed $45,000-120,000. Track this monthly per rep and per territory. Rising AOV with stable property count means wallet share expansion. Falling AOV signals competitive erosion or category loss. The variance between low-AOV and high-AOV reps in the same territory is the cleanest coaching signal.
Why is recurring revenue percentage critical for hotel supply distributors?
Recurring revenue includes predictable monthly replenishment of linens, amenities, paper, and chemicals. Target 70-82% of total sales. Below 65% means the business is project-dependent and quarterly forecasts will swing wildly. Above 82% suggests reps are not capturing PIP and FF&E opportunities. Guest Worldwide and American Hotel Register both run high-70s blended. Track in your ERP with a recurring flag at the order header.
How many properties should one hotel supplies sales rep manage?
Target 11-18 active properties per rep with 75% or more ordering monthly. Active means ordered three or more times in trailing 90 days. Reps with 25 or more properties lose monthly penetration to 55-60% because they cannot service them all. Reps with fewer than eight are under-loaded. Review territory balance every six months using AOV per property as the capacity anchor.
What is GMROI and why does it matter in hospitality distribution?
Gross Margin Return on Inventory Investment equals gross margin dollars divided by average inventory cost, annualized. Target 2.8-3.6x for hotel supplies distributors carrying 8,000-25,000 active SKUs. Below 2.4x signals dead stock or overweight commodity inventory. Above 4x usually means stockouts are hitting OTIF. Review monthly at the category-manager level with sales leadership involved to mediate breadth versus turn debates.
How do multi-year contracts affect hotel supply sales strategy?
Multi-year contracts lock in pricing, categories, and OTIF SLAs. Target 55-72% attach rate on active property accounts. Higher attach means pricing power and renewal visibility. Limited-service properties resist multi-year terms, but full-service and ownership group portfolios sign readily. Reps with attach rates below 45% are generally renewing on price alone and missing wallet share expansion opportunities inside contracted categories.
What procurement platforms do hotel supply distributors need to integrate with?
Birchstreet Systems and ProcureWare control spend visibility for a large share of branded hotel rooms in North America. Birchstreet handles punchout catalog integration, requisition approval, and spend reporting for brands and ownership groups like Highgate and Aimbridge. Distributors not EDI-integrated with these platforms lose major-chain RFPs before the sales pitch begins. Validate integration configuration quarterly.
FAQ
What are the top sales KPIs for commercial hotel supplies distribution in 2027?
The nine KPIs are recurring revenue percentage, wallet share per property, gross margin by category, GMROI on stocked SKUs, multi-year contract attach rate, property count growth, average order value per property per month, OTIF, and sales rep property penetration. These predict revenue retention and account expansion better than call volume or raw pipeline value. Weight them by property tier and ownership group mix.
How does occupancy volatility affect hotel supply sales forecasting?
Occupancy drives consumption directly. A full-service resort burns four to six sheet sets per occupied room per month. Hurricane season cuts Florida coastal volume 30-40%, ski season triples mountain resort orders, and a convention week can spike monthly orders fivefold. Pull STR or CoStar occupancy data to forecast 60 days out. Reps who ignore occupancy data guess wrong on inventory and capacity.
What is the biggest mistake hotel supply distributors make with KPIs?
Adopting too many KPIs at once and applying blended benchmarks across mixed property portfolios. A limited-service hotel at $2,000 monthly order value needs different targets than a luxury resort at $80,000. Start with three KPIs: recurring revenue percentage, wallet share per property, and OTIF. Segment targets by property tier and ownership group. Dashboard fatigue kills adoption faster than bad data.
How often should hotel supply distributors review sales KPIs?
Daily for OTIF and backorder queues. Weekly for pipeline, wallet share movement on top accounts, and account health. Monthly for revenue versus plan, gross margin by category, GMROI, property count, and OTIF trending. Quarterly for wallet share by account, contract renewals, territory rebalancing, and brand program performance. Each cadence has a distinct audience and decision scope.
What causes hotel supply account churn and how do you prevent it?
OTIF drift below 93% on top accounts is the leading cause. Three missed shipments in a quarter triggers backup vendor approval. Wallet share stagnation on contracted accounts is second, followed by brand spec misalignment on opening orders and rep over-allocation. Prevent churn by monitoring OTIF by account monthly, running quarterly business reviews, and rebalancing territories every six months.
How do brand standards affect hotel supply sales reps?
Brand standards override buyer preference. When Marriott approves a specific sheet from Standard Textile, the property GM cannot substitute even at 8% less. Hilton Supply Management and IHG specs lock vendors at corporate sourcing. Reps who think they sell to the GM are actually selling to procurement directors at chain headquarters. The revenue lever is brand approval, not relationship.
What is the sales cycle length for hotel supply opening orders versus replenishment?
New construction or PIP opening orders close in 90-120 days against contractor and ownership timelines. Replenishment business closes in 7-14 days against par levels and reorder triggers. Sales orgs that forecast around either one alone will under-staff or over-staff. Both pipelines run in parallel and need separate stage definitions in Salesforce or HubSpot.
How do ownership groups change hotel supply sales strategy?
One new ownership relationship can unlock 30 or more properties simultaneously. Groups like Aimbridge, Highgate, and Crescent negotiate at the corporate level but property GMs control daily ordering. Sell to the ownership group for contract terms and wallet share targets, then service individual properties for penetration and OTIF. Track property count growth at the ownership-group level, not just individual properties.
What technology stack do hotel supply distributors need for KPI tracking?
ERP systems like NetSuite, SAP, or Microsoft Dynamics for revenue, margin, and GMROI. CRM like Salesforce or HubSpot for wallet share, contract attach, and property penetration. WMS like Manhattan, Blue Yonder, or Korber for OTIF at the line level. Procurement platform integration with Birchstreet and ProcureWare for punchout ordering. No single system covers all nine KPIs.
How do you calculate wallet share per property in hotel supplies?
Divide your dollar volume to a property by the property's total estimated annual supply spend. Model total spend from room count, category mix, brand flag, and STR occupancy data. A property running at 22% wallet share is a competitor target. One at 60% or higher risks complacency. Track monthly in Salesforce custom objects with rep ownership and territory rollups.
Sources
- https://www.str.com
- https://www.costar.com
- https://www.ahla.com
- https://www.hospitalitynet.org
- https://www.hotelnewsnow.com
- https://www.birchstreet.com
- https://www.guestworldwide.com
- https://www.americanhotel.com
- https://www.hdsupply.com
- https://www.innkeepersupply.com
Related on PULSE
- [More sales kpis for commercial hotel supplies and hospitality distribution rankings and buying guides](/knowledge)
- [PULSE Tools and calculators](/tools)
- [Everything on PULSE RevOps](/)
This page will be disappearing soon. Save it to your device for $1 — or read it free while it is here.
@Kory-White- · if Venmo asks, the last 4 of my number are 2012
 pulse-industry-kpisTop 10 KPIs for General Contractors in 2027
 pulse-industry-kpisTop 10 Sales KPIs for Commercial Locksmith & Access Control Services in 2027
 pulse-industry-kpisTop 10 KPIs for Private Daycares in 2027
 pulse-industry-kpisTop 10 Sales KPIs for Industrial Bolting & Flange Joint Integrity Services in 2027
 pulse-industry-kpisTop 10 KPIs for HVAC Contractors in 2027
 pulse-industry-kpisTop 10 KPIs for Residential Cleaning Companies in 2027
 pulse-industry-kpisTop 10 Sales KPIs for Commercial B2B SaaS in 2027
 pulse-industry-kpisTop 10 Sales KPIs for Telehealth Platform Services in 2027
 pulse-industry-kpisTop 10 Sales KPIs for Commercial Dialysis and Renal Care in 2027
 pulse-industry-kpisTop 10 Sales KPIs for Elevator and Escalator Service in 2027