
Top 10 KPIs for HVAC Contractors in 2027
 Curated byKory White · Fractional CRO · Maryland
 PULSEKNOWLEDGE LIBRARY
Quality
Certified

The 10 best kpis for hvac contractors are ranked below on measured performance, build quality, price, and how each one actually holds up in daily use rather than how it reads on a spec sheet. Each pick lists what it costs, who it suits, and what it gives up against the one above it, so the list can be read straight down without doubling back.
1. HVAC Contractor Department Gross Margin KPI

Department gross margin ranks first because it is the only metric that exposes whether install or service is subsidizing the other. Reported separately for install, service and repair, maintenance, and IAQ accessories, workable targets run high thirties to low forties for install, mid-fifties to mid-sixties for service, and low fifties for maintenance after plan cost allocation. A single blended margin line hides a service department running above sixty percent masking an install department losing money.
This metric is for owners and general managers willing to restructure their chart of accounts, splitting revenue and cost of goods sold across four departments. It trades away simplicity for accuracy, and the restructure typically takes thirty to sixty days with a bookkeeper. Compared directly below, install-to-service revenue mix is faster to calculate but tells you the shape of revenue, not whether each department actually earns.
2. HVAC Install-to-Service Revenue Mix KPI

Install-to-service mix ranks second because revenue mix, not revenue total, decides the P&L. A residential target near 55/45 keeps install volume absorbing overhead while service funds the off-season. Below roughly 40% service you are one mild summer from a cash crisis, and above about 65% service you rarely generate capital to replace trucks and tooling. Total revenue is a vanity metric; mix is the operating metric.
This is for contractors who track install and service revenue monthly and on a rolling twelve, splitting install further into heat pump fuel-switch, straight changeouts, and new construction. It trades away the comfort of a single growth number for an honest read on fragility. Compared to the department margin metric above it, mix is easier to compute but does not reveal which department is profitable.
3. HVAC Maintenance Plan Attach Rate KPI

Maintenance plan attach rate ranks third because it is the highest-leverage residential metric. Active plan members divided by total active customers times one hundred; industry floors sit in the low twenties, healthy residential contractors run 35-50%, and the strongest operators push past that. Plan members generate materially more annual revenue, call you first instead of shopping three bids, and convert to replacement at a much higher rate.
This is for residential contractors whose binding constraint is demand, with trucks holding open capacity and thin shoulder-season schedules. It trades away quick wins, because plans sold as discounted tune-up coupons do not renew and break the number. Compared to install-to-service mix above, attach rate is narrower in scope but compounds faster, since plan members generate the scheduled calls that fill spring and fall.
4. HVAC Service Agreement Renewal Rate KPI

Service agreement renewal rate ranks fourth because it determines whether attach rate compounds or leaks. Agreements renewed at term divided by agreements eligible that month; target the mid-seventies at minimum, and the best operators run into the mid-eighties. Two habits drive most variance: a proactive outreach call roughly sixty days before term, and active monitoring of failed auto-billing, since expired cards silently destroy several points of renewal in most shops.
This is for contractors who already sell maintenance plans and now need to retain them, with someone explicitly owning the dunning queue. It trades away the acquisition focus that drove attach in the first place, because renewal is an operations discipline, not a sales one. Compared to attach rate directly above, renewal is less visible but protects the same revenue base from eroding silently.
5. HVAC Average Repair Order KPI

Average repair order ranks fifth because it converts dispatch volume into ticket economics. Total realized repair revenue divided by repair invoice count, diagnostic fee included, lands in the $475-$700 range in most residential markets. Diagnostic-only visits realize far less, often around the trip charge, so the ratio underneath ARO is what share of diagnostics convert same-day into a priced repair. A $1,200 blended ARO may simply mean more compressor and coil replacements.
This is for service managers who report ARO by job class, minor repair, major component, and accessory, rather than blending everything into one number. It trades away easy peer comparison, because unsegmented ARO against another shop is close to meaningless. Compared to renewal rate above, ARO moves faster and responds directly to pricing method and option presentation at the truck.
6. HVAC Technician Billable Hour Ratio KPI
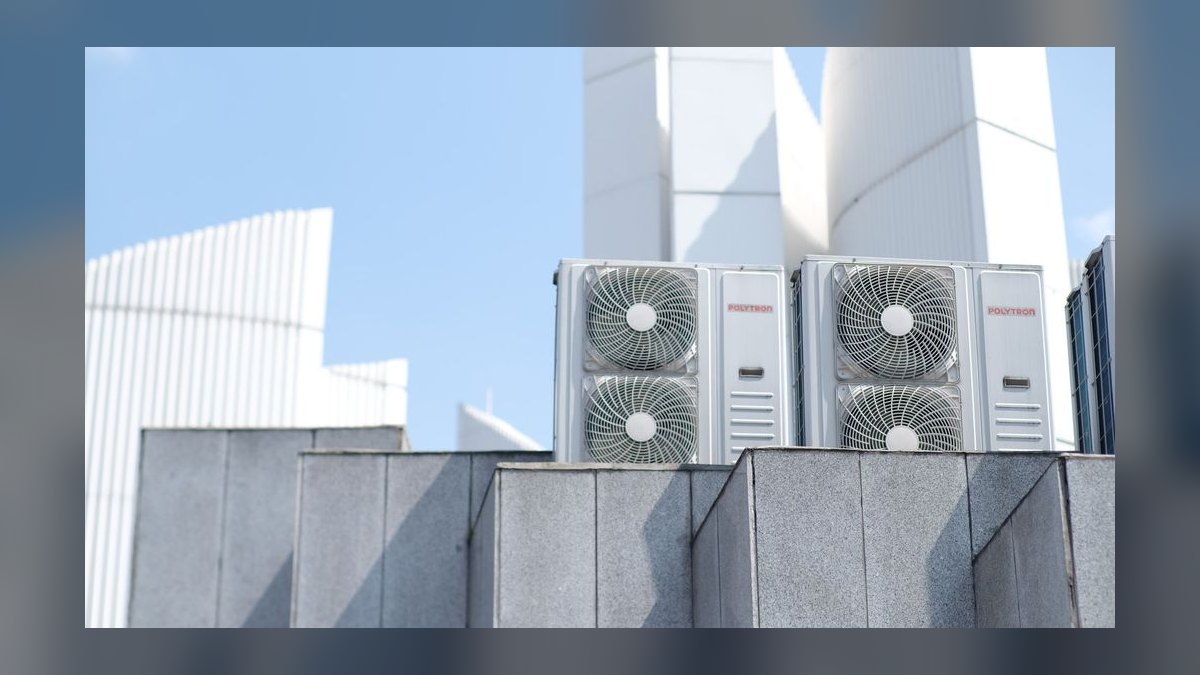
Technician billable hour ratio ranks sixth because fixed cost travels on wheels, making productivity the direct lever on contribution margin. Billable customer-facing hours divided by total paid technician hours; strong shops land in the 70-80% band, and the industry generally runs below that. At a $125 effective billable rate, one additional billable hour per tech per week is roughly $6,000 of annual revenue per technician at near-full contribution margin.
This is for shops whose constraint is capacity, with calls stacking up and next-available three days out, because it proves whether the existing fleet is underused before adding a truck. It trades away the temptation to count drive time as billable, which inflates the ratio by ten points or more. Compared to ARO above, billable ratio is harder to move but addresses labor supply rather than ticket size.
7. HVAC Revenue Per Technician KPI
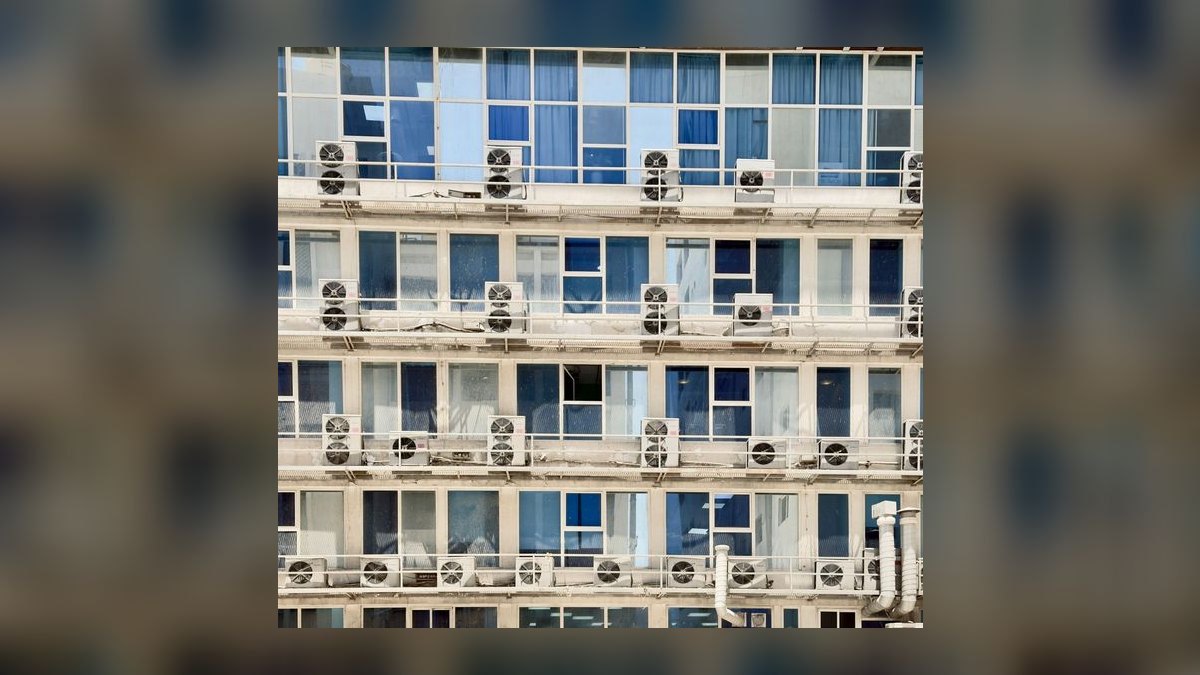
Revenue per technician ranks seventh because it normalizes field output against headcount. Annualized field revenue divided by field technician FTE; roughly $250K-$325K per residential service technician is a workable planning range, higher per install technician and in high-labor-rate metros. Define FTE strictly as someone whose name appears on billable invoice lines, write the definition down, and never change it mid-year.
This is for owners planning headcount and truck additions, since it converts productivity into a hiring decision. It trades away precision across shops, because padding the denominator with apprentices makes the number look worse and excluding a helper who runs calls makes it look better. Compared to billable hour ratio above, revenue per technician is a lagging annual read rather than a weekly operating lever.
8. HVAC First-Call Close Rate KPI
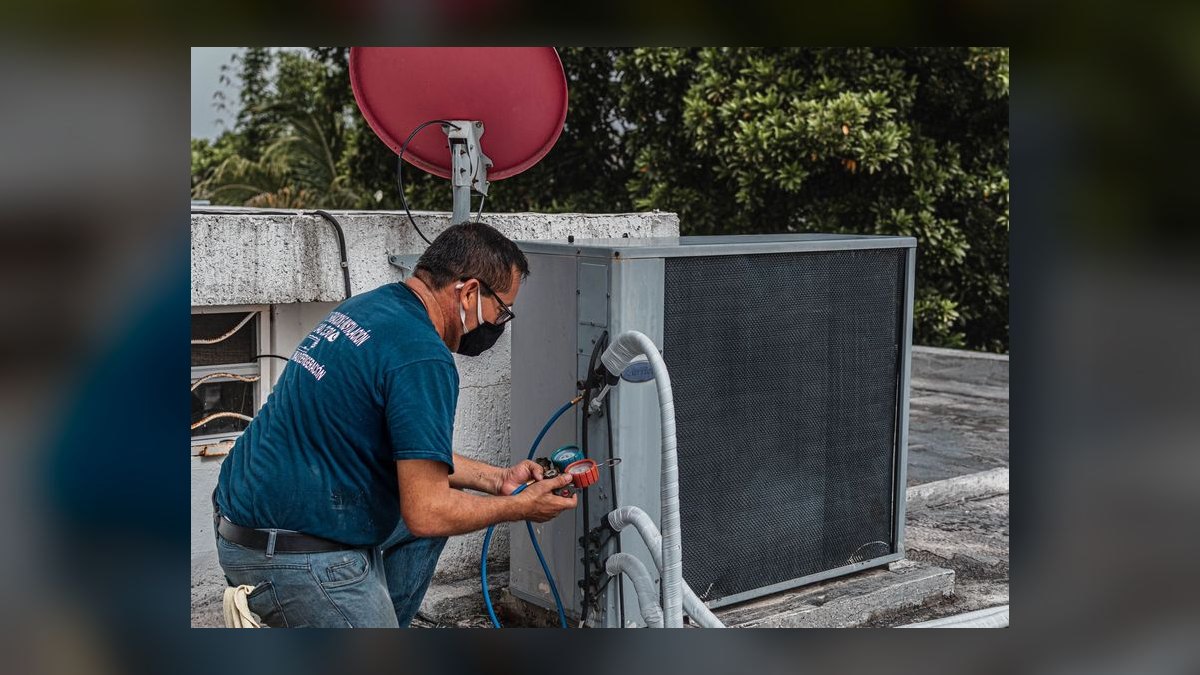
First-call close rate ranks eighth because it is the fastest metric to improve in ninety days. Service calls converted to a paid repair or replacement on the same visit, divided by total dispatched service calls; residential shops should target 55-70%, while light commercial runs lower because of approval chains and purchase orders. The biggest structural driver is pricing method, since a tablet-delivered flat-rate price book with good/better/best options closes materially higher than emailed quotes.
This is for contractors with plenty of leads and dispatches but weak revenue per opportunity, where the constraint sits in the sales process at the truck. It trades away the option to keep quoting by email, because that workflow hands the customer a shopping window. Compared to revenue per technician above, close rate is a daily peak-season number rather than an annualized planning figure.
9. HVAC Rebate-Attached Install Revenue Share KPI
Rebate-attached install revenue share ranks ninth because 2027 incentive exposure is invisible without it. Revenue from installs carrying a state rebate or utility incentive divided by total install revenue, tracked as a percentage with the underlying state program fund balance next to it. The federal 25C credit ended for property placed in service after December 31, 2025, while state-administered Home Electrification and Appliance Rebate programs continue unevenly.
This is for contractors in states with active electrification programs, treating the metric as revenue concentration rather than marketing. It trades away the simplicity of folding rebate jobs into general install revenue, which turns a program pause into an unexplained forecast miss. Compared to first-call close rate above, rebate share is slower-moving but warns of pipeline gaps with almost no notice.
10. HVAC Calls Per Technician Per Day KPI

Calls per technician per day ranks tenth because it is the daily pulse of dispatch during peak season. Typically in the mid single digits during the June-to-September cooling window and lower in shoulder season, it pairs with dispatched call count and billable hours for the morning huddle. In most warm-weather markets that window delivers close to half of annual service revenue, so a monthly-only read is blind during the weeks that determine the year.
This is for dispatchers and service managers running a daily huddle, not for owners setting annual bonuses. It trades away strategic depth, since a high call count with poor routing or low ARO can still lose money. Compared to rebate-attached revenue share above, calls per tech is tactical and immediate, best used to catch a sliding schedule within days rather than months.
How we ranked these
We ranked KPIs by how directly each one moves contribution margin in an HVAC business, weighting revenue mix, recurring-revenue attach and renewal, ticket economics, labor productivity, close rate, and department-level gross margin most heavily. Each metric was scored on actionability, sensitivity to seasonality, and whether a small shop can compute it from existing field-service data without new systems.
We deliberately ignored total revenue, fleet size, headcount, social following, and lead volume. Those flatter growth without revealing profitability, and several are lagging outputs of the metrics above. We also excluded blended margin and unsegmented average repair order, because both hide which department or job class is actually losing money.
What to look for
What matters is whether a metric maps to a lever you can pull this quarter. A shop with open truck capacity should weight maintenance plan attach and renewal; a shop turning away calls should weight billable hour ratio and revenue per technician. Match the KPI to your binding constraint, not to whatever a peer posted in a forum.
The mistake most buyers make is adopting all nine at once and bonusing on them before the chart of accounts is clean. Miscoded job types and late ticket closes produce gamed numbers within one pay period. Restructure revenue and cost of goods sold across install, service, maintenance, and IAQ first, then add compensation.
Related questions
How many KPIs should a small HVAC shop actually track?
Four daily during peak season — dispatched calls, first-call close rate, average repair order, and billable hours — plus mix, attach, renewal, revenue per tech, and department margin at weekly or monthly cadence. That is nine total. More than that and none of them get owned by a specific person with a specific target.
Do commercial HVAC contractors use the same metrics?
Mostly, with adjusted targets. First-call close runs lower because of purchase orders and approval chains, contract renewal replaces residential plan attach, and backlog coverage plus change-order margin become primary. Install-to-service mix and department-level gross margin still apply unchanged, and both remain the fastest way to spot a losing department.
What is the fastest KPI to improve in the first ninety days?
First-call close rate. Moving from emailed quotes to tablet-delivered flat-rate pricing with good, better, best options changes conversion within weeks, requires no hiring, and shows up in average repair order almost immediately. It is the highest-return change available to a shop with adequate lead flow and weak revenue per opportunity.
Should technician pay be tied to these numbers?
Only after a full clean quarter of data. Bonusing on close rate or average repair order while job types are still miscoded produces gamed tickets fast — reclassified jobs, split invoices, buried diagnostic fees. When you do tie pay, pair a revenue metric with a quality metric like callback rate to prevent short-term selling that damages the brand.
Why does install-to-service mix matter more than total revenue?
Install revenue is lumpy, capital-intensive, and carries gross margins in the high thirties to low forties. Service and repair are recurring, dispatch-driven, and carry margins well above fifty percent. A two-million-dollar shop running eighty percent install can be less profitable and far more fragile than a nine-hundred-thousand-dollar shop with a balanced mix.
How often should these KPIs be reviewed during peak season?
Daily for dispatched calls, first-call close rate, average repair order, and billable hours during the June-to-September cooling window. Weekly for mix, plan net adds, and state incentive fund status. Monthly for department P&L, renewal cohorts, revenue per technician, and EBITDA reconciliation. Monthly-only reporting through peak means you learn about June problems in July.
What does it cost to stand up this KPI stack?
Field service software runs per technician per month and is cheap relative to loaded labor. The real cost is the thirty-to-sixty-day chart-of-accounts restructure with your bookkeeper, plus dispatcher and technician training on standardized job types. Dirty data, not license fees, is what makes dashboards useless.
Which metric should a shop with thin margins fix first?
Department-level gross margin, then average repair order and mix. You cannot price correctly without knowing which department is losing money on every job. A single blended margin line lets a strong service department mask an install department running in the low twenties for years while the top line grows.
FAQ
What install-to-service revenue mix should an HVAC contractor target in 2027?
Roughly 55% install to 45% service for residential. Service and maintenance provide recurring, higher-margin, dispatch-driven revenue that carries the off-season, while install provides volume that absorbs overhead. Shops far below 40% service are exposed to a single mild summer; shops far above 65% service usually struggle to fund truck and equipment replacement.
How do I calculate maintenance plan attach rate correctly?
Divide active plan members by total active customers in your file, then multiply by one hundred. The trap is the denominator — counting only this year's customers inflates the number. Use your genuinely active customer file, and track net adds separately so cancellations do not hide behind new sales.
Is average repair order a fair comparison between shops?
Only when segmented. Blended ARO mixes diagnostic-only visits, minor repairs, and major component replacements, so a higher number can simply mean more compressor jobs rather than better selling. Report ARO by job class before comparing anything to a peer benchmark, and always filter to the same market.
Why should drive time be excluded from the billable hour ratio?
Because it measures overhead recovery, not productivity. Including it can inflate the ratio by ten points or more and conceals a routing or dispatch problem you would otherwise catch. Time-stamp on-site arrival and departure, keep drive time in the overhead bucket, and let the ratio tell the truth.
How should incentive and rebate revenue be tracked?
As its own revenue line with the associated state program's fund status monitored next to it. Folding rebate-attached installs into general install revenue hides concentration risk. When a state program pauses to reconcile funds — which several have done — the pipeline gap appears with almost no warning instead of being foreseen.
What is a healthy service agreement renewal rate?
Target the mid-seventies at minimum; the best operators run into the mid-eighties. Two habits drive most of the variance: a proactive outreach call roughly sixty days before term, and active monitoring of failed auto-billing. Expired cards alone silently destroy several points of renewal in most shops.
How much revenue should each service technician generate?
Roughly $250K to $325K per residential service technician annually, higher in high-labor-rate metros and meaningfully higher per install technician. Define FTE strictly as someone whose name appears on billable invoice lines, write the definition down, and never change it mid-year or the trend becomes meaningless.
What first-call close rate should a residential HVAC shop target?
55% to 70% for residential service calls converted to a paid repair or replacement on the same visit. Light commercial runs lower because of approval chains and purchase orders. The biggest structural driver is pricing method — tablet-delivered flat-rate options close materially higher than emailed quotes.
Why is one blended gross margin line a reporting failure?
Because a service department running above sixty percent will hide an install department running in the low twenties for years. Every dollar of install growth then makes the company worse while the top line makes it look better. Report margin separately for install, service, maintenance, and IAQ accessories.
How long does it take to implement this KPI stack?
A realistic ninety-day rollout: days one to thirty restructure the chart of accounts and standardize job types; days thirty-one to sixty stand up one dashboard tile per KPI and run a daily huddle; days sixty-one to ninety install the renewal call SOP, add the incentive fund check, and hold the first department-level P&L review.
Sources
- https://www.energystar.gov/about/federal_tax_credits
- https://www.irs.gov/credits-deductions/energy-efficient-home-improvement-credit
- https://www.energy.gov/scep/home-electrification-and-appliance-rebate-programs
- https://www.acca.org/
- https://www.achrnews.com/
- https://www.bls.gov/ooh/installation-maintenance-and-repair/heating-air-conditioning-and-refrigeration-mechanics-and-installers.htm
- https://www.nrel.gov/
- https://www.energy.gov/eere/buildings/heat-pumps
Related on PULSE
- [More kpis for hvac contractors rankings and buying guides](/knowledge)
- [PULSE Tools and calculators](/tools)
- [Everything on PULSE RevOps](/)
This page will be disappearing soon. Save it to your device for $1 — or read it free while it is here.
@Kory-White- · if Venmo asks, the last 4 of my number are 2012
 pulse-industry-kpisTop 10 KPIs for Preschools in 2027
 pulse-industry-kpisTop 10 KPIs for Physical Therapy Clinics in 2027
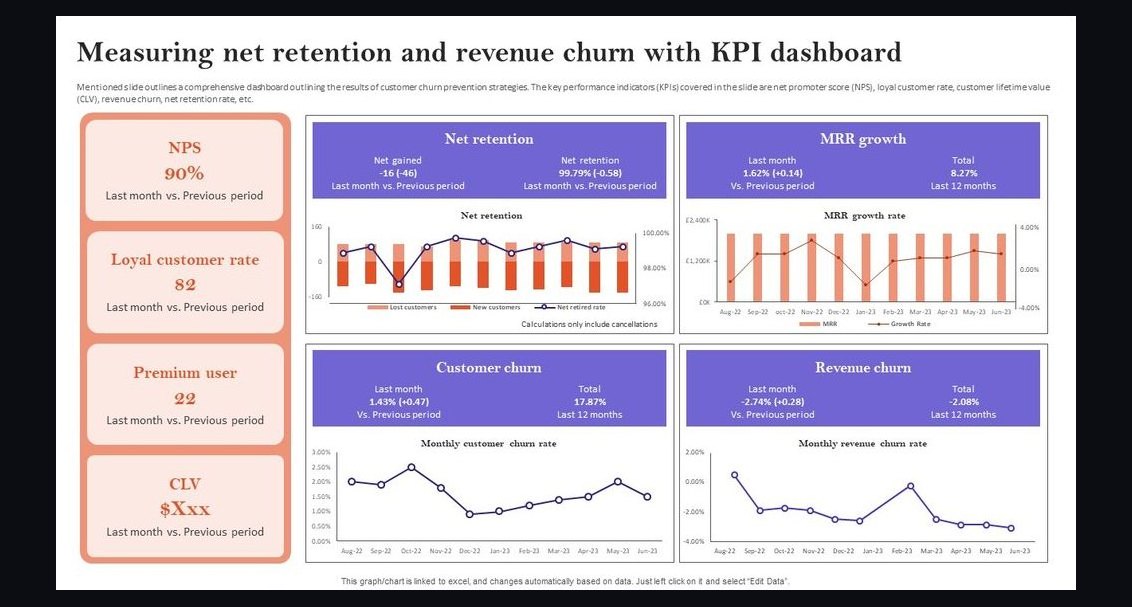 pulse-industry-kpisTop 10 Sales KPIs for Commercial B2B SaaS in 2027
 pulse-industry-kpisTop 10 KPIs for Personal Trainers in 2027
 pulse-industry-kpisTop 10 KPIs for Coffee Shops in 2027
 pulse-industry-kpisTop 10 KPIs for Dental Practices in 2027
 pulse-industry-kpisTop 10 Sales KPIs for Industrial Bolting & Flange Joint Integrity Services in 2027
 pulse-industry-kpisTop 10 KPIs for Residential Painters in 2027
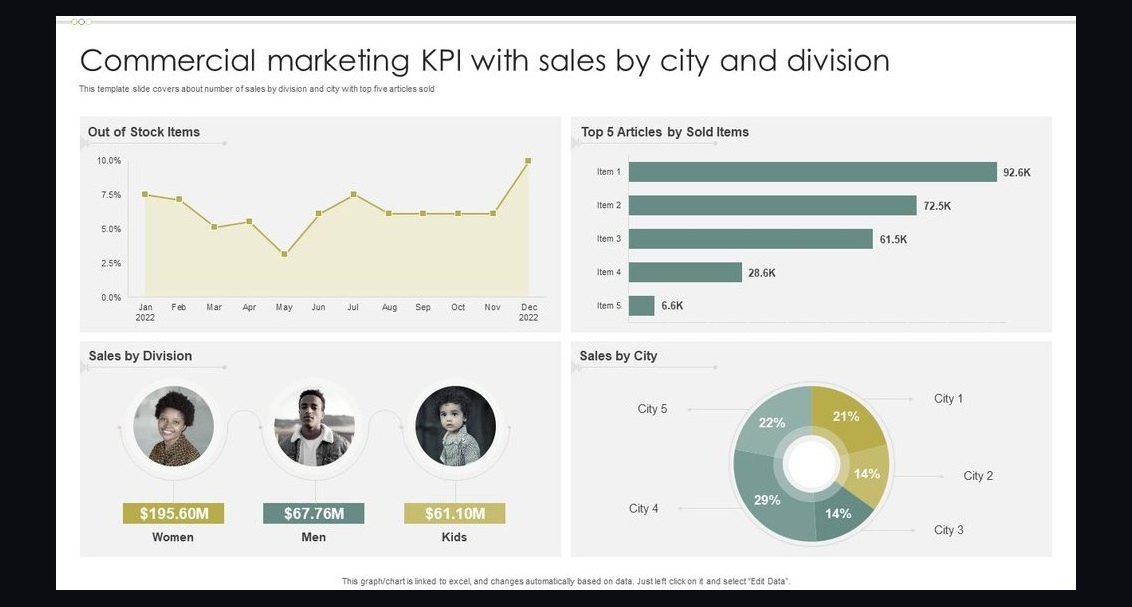 pulse-industry-kpisTop 10 Sales KPIs for Commercial Laboratory Diagnostics in 2027
 pulse-industry-kpisTop 10 Sales KPIs for Oilfield Services in 2027