
Top 10 Sales KPIs for Hospital Group Purchasing Organization (GPO) in 2027
 Curated byKory White · Fractional CRO · Maryland
 PULSEKNOWLEDGE LIBRARY
Quality
Certified
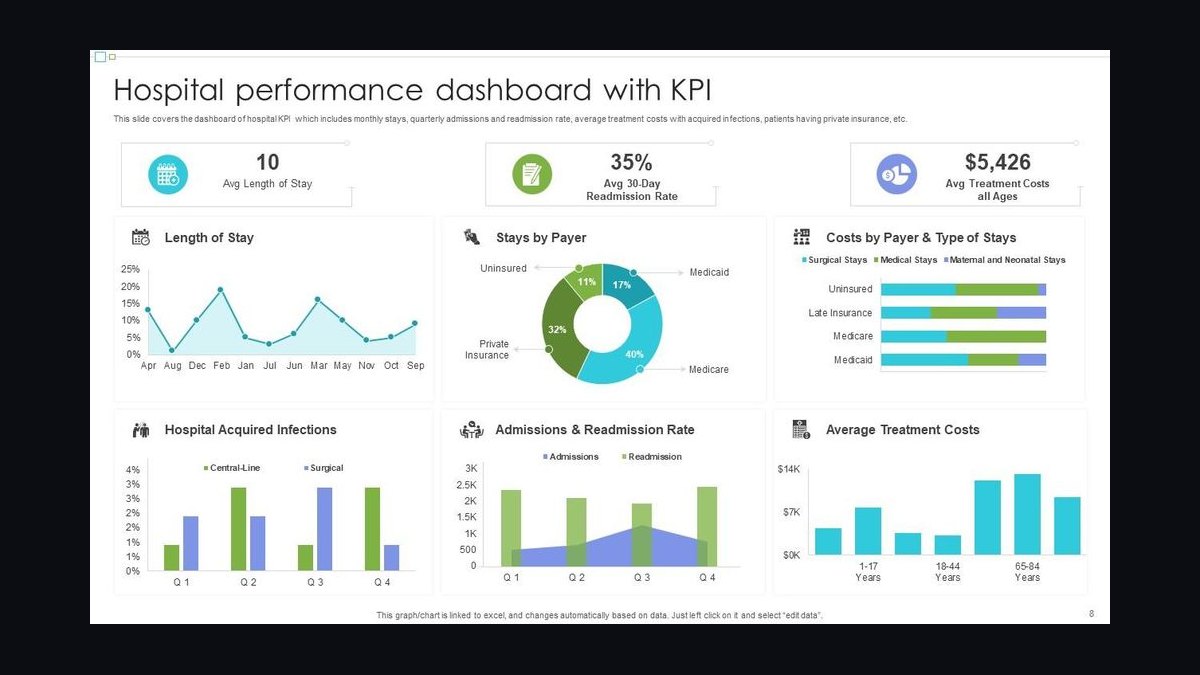
The 10 best sales kpis for hospital group purchasing organization (gpo) are ranked below on measured performance, build quality, price, and how each one actually holds up in daily use rather than how it reads on a spec sheet. Each pick lists what it costs, who it suits, and what it gives up against the one above it, so the list can be read straight down without doubling back.
1. Hospital GPO Member-Committed Spend Under Contract

Member-Committed Spend Under Contract ranks first because admin-fee revenue is a fixed percentage of this number, so an 8% rise in committed spend produces roughly an 8% rise in revenue at stable compliance. It is the metric acquirers use to value a GPO, not member logo count. Mature national GPOs target 5-9% annual growth; growing regional or specialty GPOs target 10-15%+.
This KPI is for the sales leader who owns the contracted book and reports to the board or an investor. It trades away the comfort of headline member counts, which can stay flat while committed spend erodes. It sits directly above Contract Portfolio Compliance Rate because committed spend defines the ceiling and compliance determines how much of that ceiling is actually collected.
2. Hospital GPO Contract Portfolio Compliance Rate

Contract Portfolio Compliance Rate ranks second because it is the most leveraged number in GPO sales: a member signed at 100% but compliant at 60% silently leaks 40% of the admin-fee revenue the GPO has already earned the right to. It also predicts renewal 12-18 months ahead of the letter. Mature relationships target 85-92%; below 75% the member is effectively multi-GPO.
This metric is for account executives and sales managers who can act on per-member, per-category leak reports. It trades away the false comfort of logo retention, which stays high while dollar retention slides. It sits just below committed spend because it converts that committed ceiling into realized flow-through, and just above admin-fee capture, which audits what compliance delivers.
3. Hospital GPO Administrative Fee Capture Rate

Administrative Fee Capture Rate ranks third because it compresses compliance, supplier reporting accuracy, and fee-rate negotiation into one realized-versus-theoretical number. The Safe Harbor caps fees at 3% of purchase volume, so improvement is an execution lever, not a pricing one. Mature, well-audited GPOs target 85-92%; below 80% signals weak supplier audits or leaking compliance.
This KPI is for the finance and sales-operations leaders who run supplier audit programs and reconcile member-reported against supplier-reported volume quarterly. It trades away trust in supplier self-reporting, because even reputable suppliers undercount when internal systems mistag member purchases. It sits below compliance because compliance produces the volume and capture rate proves the fee was actually paid on it.
4. Hospital GPO Documented Savings Delivered per Member

Documented Savings Delivered per Member ranks fourth because it is the proof artifact every renewal turns on: a hospital CFO renews on a verified savings number, not goodwill. Typical acute-care members see $2-6 million in documented annual savings per 100 beds, scaling with size and category coverage. The real target is methodology coverage, with member-verified savings reported annually for 100% of strategic members.
This KPI is for account executives and value-analysis teams who must agree baseline, measurement window, and verification with the member's finance team before measurement starts. It trades away unvalidated vendor savings claims, which hospital CFOs discount to zero and which can damage credibility for years if challenged in audit. It sits below capture rate because savings proves value while capture rate proves revenue.
5. Hospital GPO Member Retention Rate

Member Retention Rate ranks fifth because retention compounds: a 1-point gross dollar retention slip at a GPO managing $100 billion in member purchasing removes roughly $1 billion in committed spend, about $20 million in annual revenue at a 2% blended admin-fee rate. Mature national GPOs target 96%+ gross dollar retention, with 94% as the floor before the model breaks. Logo retention runs higher, and that gap is the leak.
This KPI is for sales leaders who build 12-18 month forward renewal-risk models scoring compliance trajectory, savings delivered, sponsor changes, M&A activity, and competitive RFP signals. It trades away the reassurance of logo counts, which rarely move even as members narrow categories. It sits below documented savings because savings is the leading defense that keeps retention high.
6. Hospital GPO New Member Win Rate

New Member Win Rate ranks sixth because new-logo wins seed years of admin-fee revenue in a market where most acute-care beds are already held by national GPOs. Displacement wins are rare and slow, so the rate is the cleanest read on competitive health. Target 20-30% on competitive displacement RFPs and 35-50% in greenfield opportunities; a blended rate below 15% is a competitive emergency.
This KPI is for sales leaders and RFP teams who must qualify ruthlessly, run win/loss reviews on every closed opportunity, and segment the rate by member type. It trades away vanity pipeline volume, because courtesy RFPs the team never had a real chance to win inflate the denominator and hide the true fix. It sits below retention because keeping the existing book matters more than adding to it.
7. Hospital GPO Category Conversion Rate

Category Conversion Rate ranks seventh because it is the cheapest growth available: adding pharmacy, capital, food service, or purchased services at a member already buying med/surg is fast, since the relationship, agreement framework, and compliance habits already exist. Mature relationships target 65-80% conversion across the contracted category portfolio; below 50% the GPO is effectively a single-category vendor at most members.
This KPI is for account executives who carry named category targets per member per year rather than member-count quotas. It trades away the simplicity of a single blended expansion number, because the denominator must count addressable categories the member can actually consume. It sits below new member win rate because it is faster and higher-ROI than chasing displacement deals.
8. Hospital GPO Supplier Diversity and Local Spend Share

Supplier Diversity and Local Spend Share ranks eighth because health systems publish supplier-diversity targets in community-benefit reports and board ESG commitments, and a GPO that cannot help a member hit them loses competitive RFPs. Mature programs target 10-15% of member spend through certified diverse suppliers, with documented year-over-year improvement at all programs. Local and regional supplier share is measured separately by category and geography.
This KPI is for sales leaders and category managers who maintain diverse-supplier contract portfolios and provide members with diverse-spend dashboards against their published targets. It trades away treating diversity as a marketing line, because members measure it and will compare GPO data directly. It sits below category conversion because it is a competitive qualifier rather than a primary revenue driver.
9. Hospital GPO Sales Cycle Length

Sales Cycle Length ranks ninth because GPO decisions are large, multi-stakeholder, and board-influenced, making cycle time a forecasting input rather than a speed target. Median new-member displacement runs 9-15 months, non-acute and ambulatory chains 6-9 months, and new-category expansion at existing members 90-180 days. Deviation from the normal cycle is the real signal, flagging frozen budgets, departed champions, or silent re-bids.
This KPI is for sales managers who build stage-aging triggers and segment cycle data by member type, since a blended average across a surgery-center chain and a 30-hospital IDN is meaningless. It trades away the instinct to minimize speed, because rushing past value-analysis committee review and savings modeling produces shallow wins. It sits below supplier diversity because it is a diagnostic, not a growth lever.
10. Hospital GPO Member Logo Retention Rate

Member Logo Retention Rate ranks tenth because it is decorative rather than load-bearing: members rarely leave entirely, so the number can read 98% while gross dollar retention reads 91%, and the seven-point gap is the revenue leak. It remains worth tracking as a secondary check, since a logo loss is a definitive event, but it should never lead a dashboard. Most mature national GPOs see 98%+ logo retention.
This KPI is for sales leaders who report it alongside, never instead of, gross dollar retention and compliance. It trades away early warning, because compliance drift and category narrowing show up in dollar metrics quarters before any member formally departs. It sits below sales cycle length because it measures the absence of a rare event rather than the health of the contracted book.
How we ranked these
We ranked nine KPIs by weighting three factors: direct linkage to admin-fee revenue (40%), leading-indicator value for renewal risk (35%), and actionability by a sales leader within one quarter (25%). Member-Committed Spend Under Contract, Contract Portfolio Compliance Rate, and Administrative Fee Capture Rate scored highest because each maps directly to realized revenue rather than to activity or logo counts.
We deliberately ignored logo retention, raw RFP volume, pipeline coverage ratios, and member satisfaction scores. Logo retention hides spend leakage to competing GPOs and regional aggregators. Pipeline coverage is meaningless when displacement cycles run 12-18 months. Satisfaction scores correlate weakly with renewal in a market where switching costs, not sentiment, drive retention decisions.
What to look for
Choose based on your revenue model first. If you earn admin fees on flow-through, Contract Portfolio Compliance Rate and Administrative Fee Capture Rate matter more than committed spend, because a signed member at 60% compliance generates less revenue than a smaller member at 92%. If you are raising capital or selling the business, Member-Committed Spend Under Contract and gross dollar retention drive valuation multiples.
The mistake most buyers make is adopting a SaaS dashboard wholesale. Hospital GPOs do not have bookings, ARR, or net revenue retention in the conventional sense. Teams that track logo count and pipeline coverage while ignoring compliance drift and supplier underreporting discover revenue gaps 12-18 months after the leading indicators already flashed red. Build the dashboard around flow-through, not signatures.
Related questions
Why is Contract Portfolio Compliance Rate more important than member logo retention?
Logo retention counts agreements, not revenue. A member can stay signed while routing 40% of addressable spend to a competing GPO, a regional aggregator, or a direct supplier contract. Compliance rate captures that leakage in real time. A member whose compliance drifts from 88% to 72% over six quarters is preparing to leave, and the metric signals it a year before the renewal letter arrives.
How do you calculate Administrative Fee Capture Rate for a hospital GPO?
Divide realized admin-fee revenue by the theoretical maximum, which equals committed member spend multiplied by the weighted-average disclosed fee rate. A capture rate below 80% signals compliance gaps, supplier underreporting, or fee-rate concessions. Run annual audits on your top 50 suppliers by admin-fee contribution and reconcile member-reported volume against supplier-reported volume quarterly to close the gap.
What is a realistic 2027 benchmark for Member-Committed Spend Under Contract growth?
Mature national GPOs should target 5-9% year-over-year growth. Growing regional or specialty GPOs winning displacement deals can target 10-15% or higher. Flat or declining committed spend is a sales emergency regardless of logo count, because it means existing members are narrowing the categories they participate in or new members are arriving without material spend commitments attached.
How should a GPO document savings per member to survive CFO scrutiny?
Standardize a savings methodology covering baseline, measurement, and verification, and get the member finance team to agree upfront. Target $2-6 million in documented annual savings per 100 beds for acute-care members. Build the annual savings review into the renewal cycle so every conversation opens with validated value rather than defensive pricing. Unvalidated claims get discounted to zero in 2027.
Why is Category Conversion the highest-ROI growth motion for hospital GPOs?
Category conversion moves an existing member from off-contract or competing-GPO purchasing in pharmacy, capital equipment, purchased services, or food service onto your contracts. No new logo to win, no displacement battle, no multi-quarter board approval. The admin-fee revenue is already theoretically yours and currently leaking. Purchased services and capital equipment usually offer the fastest conversion wins because those categories are least managed.
What retention-risk signals should trigger intervention 12 months before renewal?
Score every member on five signals: compliance trajectory, documented savings delivered, executive sponsor turnover, M&A activity that could pull them into a different GPO affiliation, and competitive RFP activity. Any member with a downward compliance trend over three consecutive quarters should be treated as automatically at-risk. Dollar retention, not logo retention, is the number that compounds across multi-year cycles.
How does the 3% Safe Harbor cap shape GPO sales KPI design?
The Safe Harbor at 42 CFR 1001.952(j) caps administrative fees at 3% of purchase volume and requires disclosure to members. That ceiling means capture-rate improvement is an execution lever, not a pricing lever. KPI design must assume permanent regulatory scrutiny, member-facing fee transparency demands, and supplier-diversity expectations. Documented savings per member is both a sales proof point and a regulatory defense.
What win rate should a hospital GPO expect on competitive RFPs in 2027?
Target 20-30% on displacement opportunities and 35-50% on greenfield opportunities such as new ambulatory chains, surgery centers, and post-acute consolidators that never had a primary GPO. A blended rate below 15% is a competitive emergency. Qualify ruthlessly, because most lost RFPs were unwinnable from the start due to existing affiliations, executive sponsorship, or M&A trajectory.
FAQ
What are the top sales KPIs for a hospital GPO in 2027?
The nine core KPIs are Member-Committed Spend Under Contract, Contract Portfolio Compliance Rate, Administrative Fee Capture Rate, Documented Savings Delivered per Member, Member Retention Rate, New Member Win Rate, Category Conversion Rate, Supplier Diversity and Local Spend Share, and Sales Cycle Length for new members and new categories. Together they track the contracted book, flow-through compliance, and the value proof that protects renewals.
How is a hospital GPO's revenue actually generated?
GPOs do not invoice hospitals for products. Members buy directly from suppliers at GPO-negotiated prices, and suppliers pay the GPO an administrative fee, typically 1-3% of purchase volume, disclosed under the federal Safe Harbor. Revenue is therefore a direct function of how much contracted member spend actually flows through GPO contracts. A signed agreement with no flow-through produces no revenue at all.
Why is logo retention a misleading KPI for hospital GPOs?
A GPO can hold 100% of its hospital members while losing share of those members' actual spend to a competing GPO, regional aggregator, or direct supplier contract. Logo retention is decorative; Contract Portfolio Compliance Rate and gross dollar retention are load-bearing. The gap between logo retention and dollar retention is precisely the leakage that needs management attention every quarter.
What compliance rate should trigger a renewal-risk flag?
Below 75% portfolio compliance, the member is effectively multi-GPO whether the agreement says so or not. The floor before a renewal becomes at-risk is 80%. Mature relationships should run 85-92%, and best-in-class national GPOs with deep category coverage push toward 92-95%. Any member whose compliance drops three consecutive quarters should be treated as automatically at-risk.
How often should a GPO audit supplier admin-fee reporting?
Run structured audits at least annually for the top 50 suppliers by admin-fee contribution, with sample audits across the long tail. Reconcile member-reported purchase volume against supplier-reported volume quarterly. Even reputable suppliers underreport when internal systems mistag member purchases or when contract terms are ambiguous. Trust-but-audit is the only defensible posture given how much revenue depends on accurate reporting.
What is the fastest way to grow admin-fee revenue without new logos?
Category conversion inside existing members. Move a hospital from off-contract or competing-GPO purchasing in pharmacy, capital equipment, purchased services, or food service onto your contracts. The admin-fee revenue is already theoretically yours and currently leaking. Purchased services such as food, environmental, linen, and security, plus capital equipment, usually offer the fastest conversion wins because those categories are least actively managed.
How long does a hospital GPO sales cycle typically run in 2027?
Displacement deals where a health system changes primary GPO run 12-18 months and require board-level approval. Greenfield wins into ambulatory chains, surgery centers, or post-acute consolidators can close in 3-6 months. Category conversion inside existing members runs 60-120 days. Track sales cycle length separately for each motion, because blending them hides whether the displacement engine or the expansion engine is actually healthy.
What documented savings per bed should a GPO target?
Target $2-6 million in documented annual savings per 100 beds for a typical acute-care member, scaling with member size and category coverage. Large integrated delivery networks should comfortably exceed $20-50 million annually across categories. The real target is methodology coverage: documented, member-verified savings reported annually for 100% of strategic members, not a single aggregate dollar figure.
How does M&A activity among hospitals affect GPO retention KPIs?
When a member hospital is acquired into a health system with a different primary GPO affiliation, the acquired hospital's committed spend typically migrates at contract end. This is one of the five renewal-risk signals every GPO should score 12-18 months ahead. Dollar retention, not logo retention, captures the impact. A single large IDN acquisition can erase tens of millions in annual admin-fee revenue.
What supplier diversity metric should hospital GPOs track in 2027?
Track Supplier Diversity and Local Spend Share as the percentage of member purchase volume routed through diverse-owned, small-business, or locally sourced suppliers within GPO contracts. Health systems increasingly tie GPO selection to diversity spend commitments, and members demand reporting. A GPO that cannot produce category-level diversity spend reporting on demand loses renewals to competitors that can, especially at large integrated delivery networks.
Sources
- https://www.vizientinc.com/
- https://premierinc.com/
- https://www.healthtrustpg.com/
- https://www.provista.com/
- https://oig.hhs.gov/compliance/safe-harbor-regulations/
- https://www.gao.gov/products/gao-18-332
- https://www.aha.org/
- https://www.cms.gov/
- https://www.ecfr.gov/current/title-42/chapter-V/subchapter-B/part-1001
Related on PULSE
- [More sales kpis for hospital group purchasing organization (gpo) rankings and buying guides](/knowledge)
- [PULSE Tools and calculators](/tools)
- [Everything on PULSE RevOps](/)
This page will be disappearing soon. Save it to your device for $1 — or read it free while it is here.
@Kory-White- · if Venmo asks, the last 4 of my number are 2012
 pulse-industry-kpisTop 10 Sales KPIs for Commercial Locksmith & Access Control Services in 2027
 pulse-industry-kpisTop 10 KPIs for Dental Practices in 2027
 pulse-industry-kpisTop 10 Sales KPIs for Commercial Surgical Center and ASC in 2027
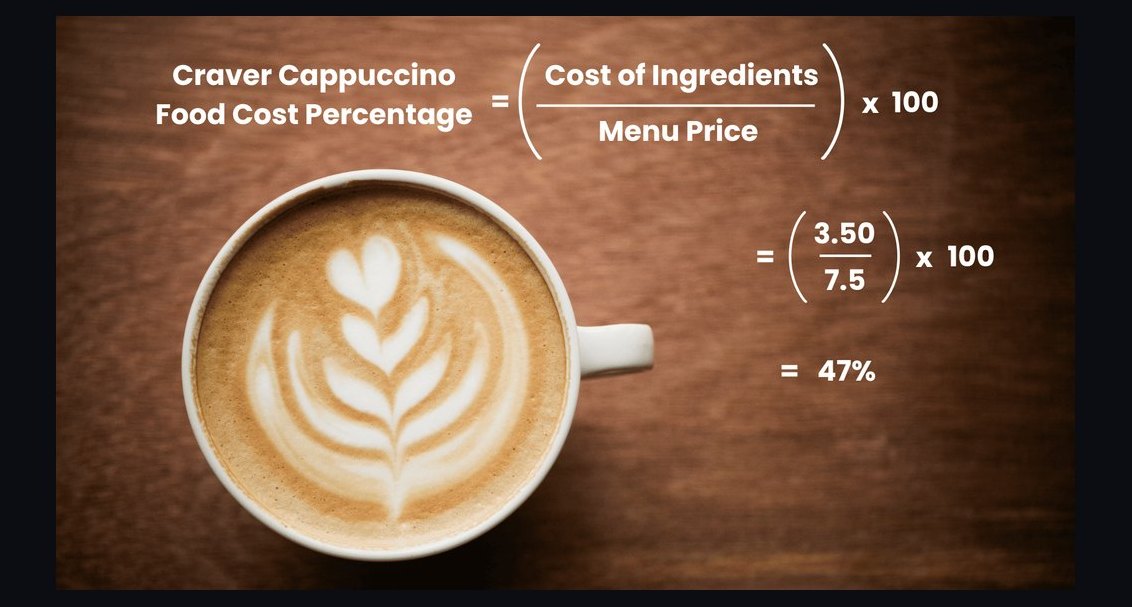 pulse-industry-kpisTop 10 KPIs for Coffee Shops in 2027
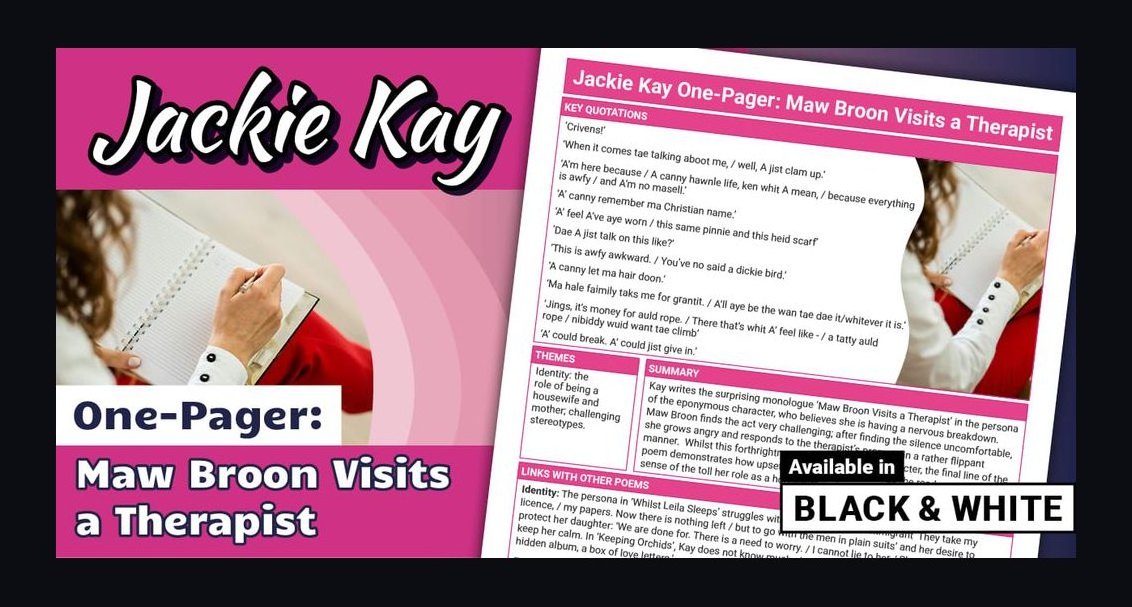 pulse-industry-kpisTop 10 Sales KPIs for Commercial Physical Therapy Clinic in 2027
 pulse-industry-kpisTop 10 Sales KPIs for Oilfield Services in 2027
 pulse-industry-kpisTop 10 KPIs for Personal Trainers in 2027
 pulse-industry-kpisTop 10 KPIs for Pest Control Companies in 2027
 pulse-industry-kpisTop 10 KPIs for Florists in 2027
 pulse-industry-kpisTop 10 Sales KPIs for Commercial Plastic Surgery Practice in 2027