
Top 10 Sales KPIs for Commercial Home Health Care in 2027
 Curated byKory White · Fractional CRO · Maryland
 PULSEKNOWLEDGE LIBRARY
Quality
Certified
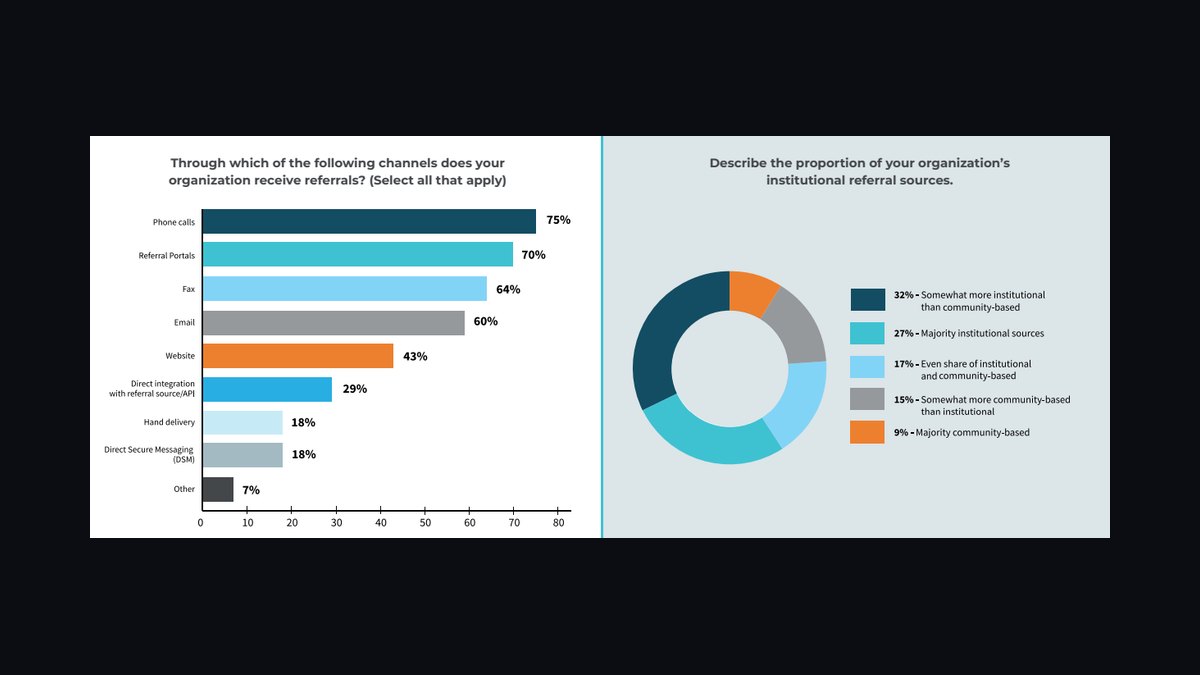
The 10 best sales kpis for commercial home health care are ranked below on measured performance, build quality, price, and how each one actually holds up in daily use rather than how it reads on a spec sheet. Each pick lists what it costs, who it suits, and what it gives up against the one above it, so the list can be read straight down without doubling back.
1. Home Health Referral-to-SOC Conversion Rate
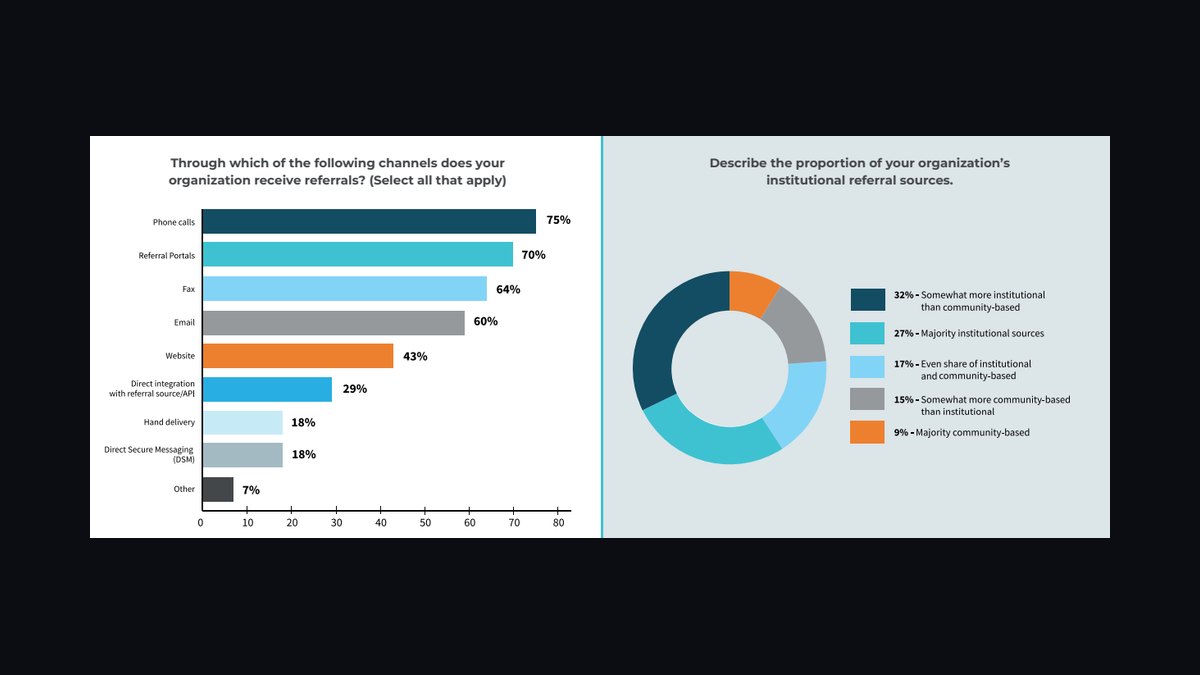
Conversion rate ranks first because it converts referral flow into revenue and exposes operational leakage that volume metrics hide. A branch taking 100 referrals at 50% yields 50 starts of care; a branch taking 70 at 80% yields 56 at lower acquisition cost. National average sits near 65%, with Medicare 60-75%, private pay 70-85%, and Medicaid 50-65%.
This KPI is for branch and regional sales leaders who own the full funnel from intake call to SOC visit. It trades away the comfort of celebrating raw referral counts and forces accountability on insurance verification speed and clinician scheduling. Pair it directly with Time-to-SOC below, since slow intake is the most common conversion killer.
2. Home Health Time-to-Start-of-Care

Time-to-SOC ranks second because discharge planners prioritize bed turnover, and referrals sitting past 48 hours carry a 30-40% poach-or-cancel risk. Best-in-class branches complete 70% of Medicare SOCs within 24 hours and 85% within 48 hours. Medicaid authorizations typically stretch 5-7 days, while private pay can be same-day.
This metric is for intake supervisors, schedulers, and sales reps covering hospital case management. It trades away staffing flexibility, since holding clinician capacity for same-day SOC visits raises labor cost per episode. Compared with conversion rate above, it is more actionable daily: a single intake callback delay visibly moves the number within a week.
3. Home Health Referrals Per Month Per Branch
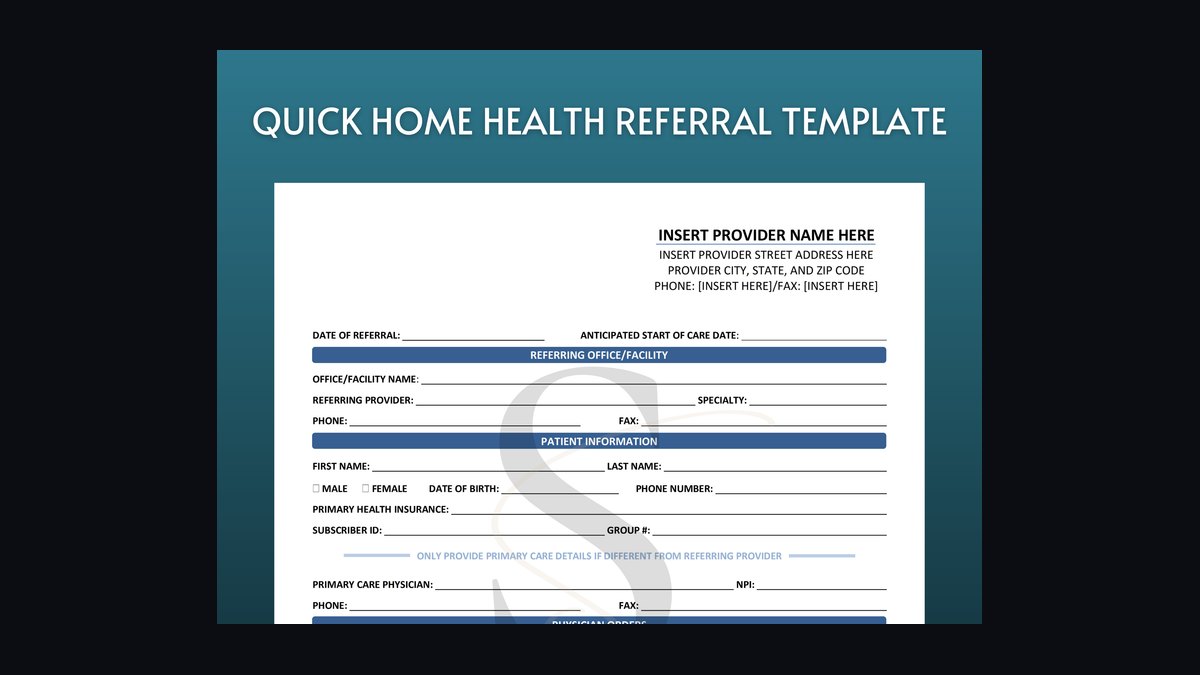
Referrals per month ranks third because it sets the ceiling on everything downstream, though volume without conversion is a vanity number. A mature branch covering 300-500 active patients should see 80-150 referrals monthly; dense metros like Phoenix, Tampa, and Houston push 200-plus. Branches under 60 referrals signal undersized sales coverage.
This KPI suits regional sales directors allocating liaison headcount and territory. It trades away precision, since referral counts vary by source mix: hospital discharge contributes 40-50%, physician practices 20-25%, SNF step-down 15-20%. Compared with conversion rate above, it is the input metric that tells you whether to fix sales coverage or intake operations first.
4. Home Health Payer Mix Percentage
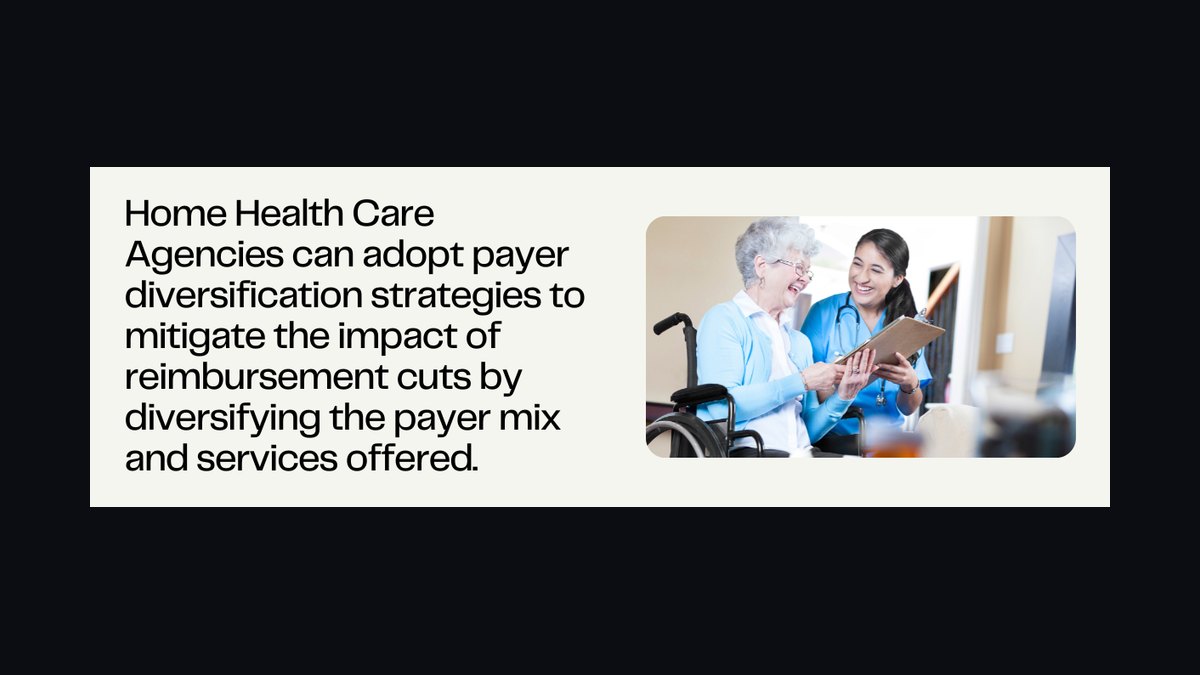
Payer mix ranks fourth because it determines margin durability and sales infrastructure more than any other structural metric. Durable agencies run 55-65% Medicare, 20-25% Medicaid or MCO, and 10-20% private pay and commercial. CMS reduced Medicare rates roughly 4-5% effective 2024-2026, punishing agencies above 80% Medicare exposure.
This KPI is for agency owners, CFOs, and strategy leads planning 18-24 month channel investments. It trades away short-term simplicity, since private pay requires consumer marketing, elder-law attorney partnerships, and geriatric care manager networks. Compared with gross margin by payer below, it is the leading indicator; margin is the lagging confirmation that the mix is working.
5. Home Health Gross Margin by Payer
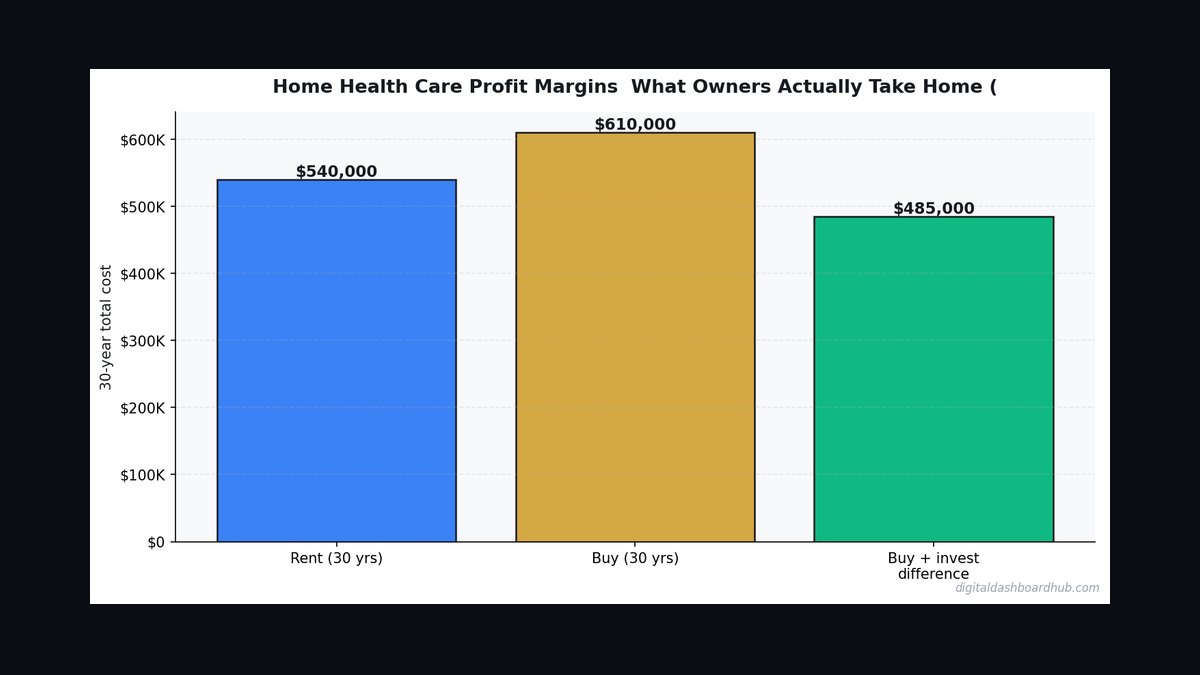
Gross margin by payer ranks fifth because it reveals whether revenue converts to profit after caregiver wages, which rose faster than reimbursement through 2024-2026. Medicare PDGM runs 35-42% gross margin per 30-day period, Medicaid 18-22% hourly, and private pay 45-55%. Skilled nursing visits generate $90-110 revenue each, PT/OT $75-95, aide visits $35-55.
This KPI is for finance and operations leaders reviewing branch-level P&L monthly. It trades away blended simplicity, since a single agency-wide margin number hides payer-specific problems like negative aide contribution on Medicare cases. Compared with payer mix above, it is the outcome measure; mix tells you the recipe, margin tells you whether the kitchen is efficient.
6. Home Health Average Length of Stay
Average length of stay ranks sixth because it drives revenue per patient and flags clinical documentation risk. Medicare benchmarks run 55-65 days across roughly two episodes, private pay 80-120 days, and post-acute orthopedic 30-45 days. Medicare ALOS under 40 days suggests premature discharge or undercoded OASIS; over 90 days draws CMS audit scrutiny.
This KPI is for clinical directors and sales reps who need to know what each referral source typically sends. It trades away a single universal target, since post-op and chronic populations require different expectations. Compared with recertification rate below, ALOS captures total episode duration while recert captures the decision point that extends it.
7. Home Health Recertification Rate
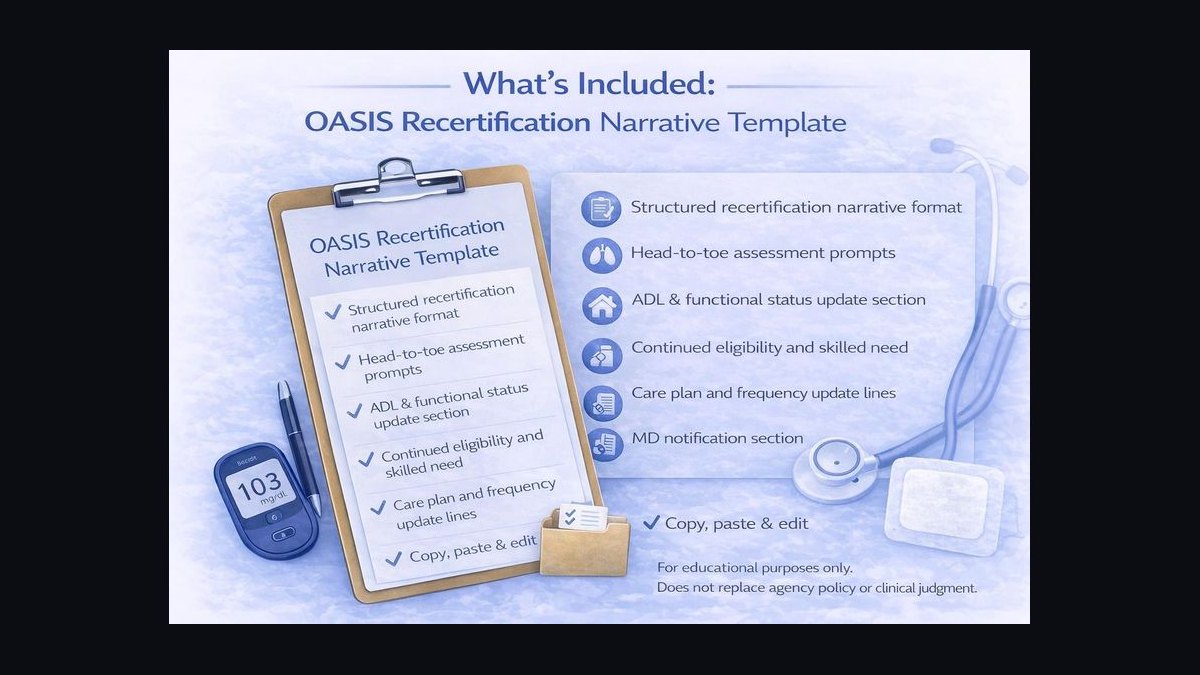
Recertification rate ranks seventh because it is simultaneously a clinical quality signal and a margin lever. Benchmarks sit at 45-55% of Medicare patients recertifying into a second 60-day episode. Under 40% suggests overly aggressive discharge or acute case mix; over 65% invites CMS Targeted Probe and Educate scrutiny. Episode two typically carries lower nursing visit intensity at similar reimbursement.
This KPI is for clinical managers and finance leads balancing quality scores against audit exposure. It trades away clean incentives, since pushing recerts raises margin but also compliance risk. Compared with average length of stay above, it isolates the specific clinical decision that determines whether a patient continues, making it more actionable for case review meetings.
8. Home Health Caregiver Retention 12-Month

Caregiver retention ranks eighth because staffing capacity gates referral conversion even when the sales pipeline is full. Benchmarks run 65-75% at 12 months for full-time clinical staff, while part-time aide retention industry-wide sits at 50-60%. Every 5-point retention improvement adds roughly 10% to branch revenue capacity. Pay rate, scheduling flexibility, and mileage reimbursement are the three biggest levers.
This KPI is for branch directors and HR partners who typically own it, though sales leaders must track it because unfilled cases drop conversion. It trades away short-term savings, since raising wages compresses margin before retention gains materialize. Compared with time-to-SOC above, it is the upstream constraint: no available clinician means no SOC, regardless of intake speed.
9. Home Health Hospital Readmission Rate

Hospital readmission rate ranks ninth because it governs preferred-provider status with ACO partners and hospital case managers under HRRP penalties. Best-in-class all-cause 30-day readmission sits under 14%, average runs 16-18%, and anything above 20% risks removal from preferred lists. Tracking by referring hospital and clinical condition shows where joint case reviews pay off.
This KPI is for quality directors and sales reps presenting quarterly business reviews to hospital partners. It trades away quick wins, since readmission improvement requires months of clinical protocol work and shared data with hospital teams. Compared with recertification rate above, it is externally facing: recert is internal margin, readmission is the number hospitals ask about first.
10. Home Health Referral Source Concentration
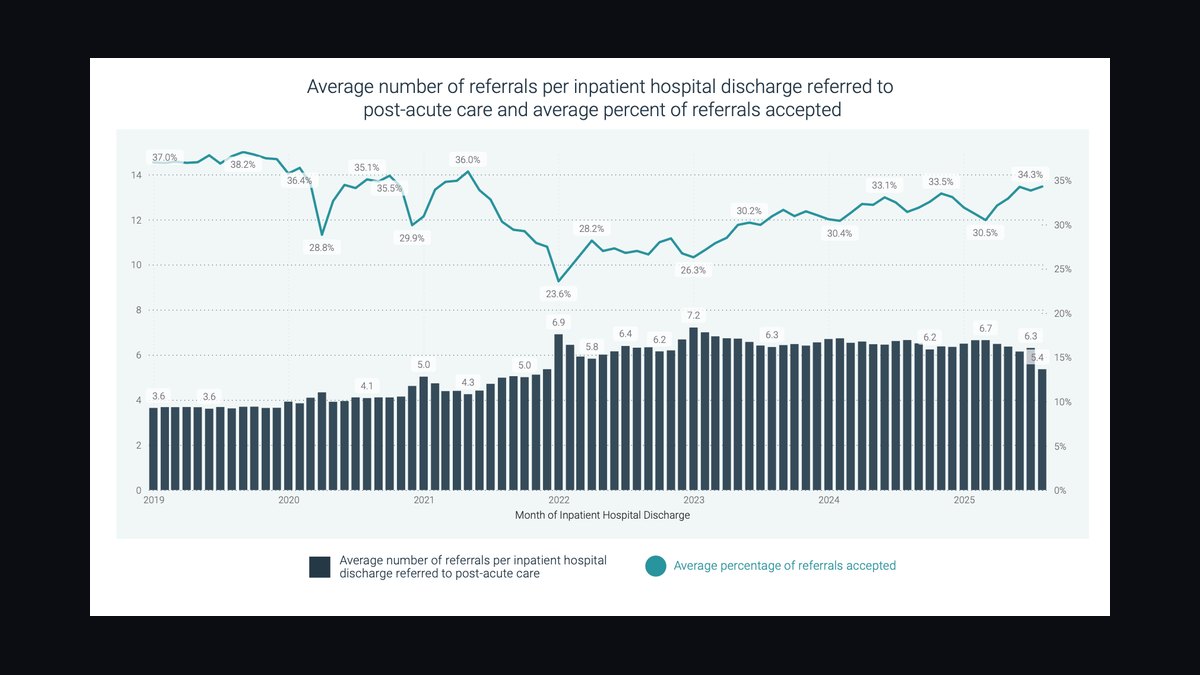
Referral source concentration ranks tenth because Pareto dynamics make top-account dependency the biggest hidden risk in home health sales. Top 10 referral sources typically produce 60-70% of branch volume, meaning one lost discharge planner can erase 20% of quarterly volume. Tier-1 hospital accounts warrant named coverage with backup reps and quarterly business reviews.
This KPI is for sales managers building account plans and coverage models. It trades away the efficiency of concentrating rep time, since diversifying sources requires broader coverage at higher cost per acquired patient. Compared with referrals per month above, it answers a different question: not how many referrals arrived, but how fragile the pipeline is if one relationship turns over.
How we ranked these
We ranked KPIs by their direct impact on commercial home health care revenue and referral retention in 2027. Each metric was weighted for sales controllability, correlation with branch profitability, and sensitivity to PDGM reimbursement changes. Referral-to-SOC conversion and time-to-SOC received the highest weights because they directly determine how many referrals become billable episodes. Payer mix and gross margin by payer were weighted next, reflecting their role in long-term financial durability.
We deliberately ignored metrics that are clinical-only or lagging indicators with little sales leverage, such as OASIS accuracy scores and employee satisfaction surveys. We also excluded broad financial ratios like EBITDA margin because they aggregate too many operational factors. Metrics requiring proprietary data subscriptions were omitted to keep the ranking actionable for branch-level sales leaders using standard CRM and EMR systems.
What to look for
When choosing between these KPIs, prioritize those your sales team can directly influence within a quarter. Referral-to-SOC conversion and time-to-SOC are the highest-leverage because they turn existing referral volume into revenue without new marketing spend. Payer mix and gross margin by payer matter most if your agency is exposed to Medicare cuts or planning a private-pay expansion. Caregiver retention is a leading indicator of future conversion capacity.
The most common mistake is tracking too many KPIs without tying them to rep compensation or weekly coaching. Another error is treating referral volume as the primary sales metric while ignoring conversion leaks. Buyers also overlook the cost of data collection—if a KPI requires manual spreadsheet work, it will be abandoned within months. Choose metrics that integrate with your existing CRM or EMR and assign clear ownership.
Related questions
What is a good referral-to-SOC conversion rate for home health agencies?
Benchmark is 60-75% for Medicare, 70-85% for private pay, and 50-65% for Medicaid due to authorization delays. National average is around 65%. Branches below 55% usually have intake responsiveness or insurance verification problems. Track lost referrals weekly by reason; if 'patient chose competitor' exceeds 15% of losses, your service levels need immediate attention.
How fast should a home health agency complete a Start of Care visit?
Best-in-class agencies complete 70% of Medicare SOC visits within 24 hours and 85% within 48 hours. Private pay can be same-day. Medicaid often takes 5-7 days due to authorization. Time-to-SOC is the top metric discharge planners use to choose preferred providers, so sub-24-hour median performance wins 2-3x more hospital referrals.
What payer mix should a durable home health agency target?
A balanced mix is 55-65% Medicare, 20-25% Medicaid or MCO, and 10-20% private pay and commercial insurance. Heavy Medicare exposure above 80% makes you vulnerable to PDGM cuts. Heavy private pay above 30% requires consumer marketing and elder-law partnerships. Track payer mix monthly by branch and watch for drift toward low-margin payers.
How does caregiver retention affect home health sales KPIs?
Turnover above 60% annually means your sales pipeline outruns staffing capacity, causing referral-to-SOC conversion to drop. Every 5-point retention improvement adds roughly 10% to branch revenue capacity. Pay rate, scheduling flexibility, and mileage reimbursement are the top retention levers. Track 12-month retention alongside referral dashboards because staffing constraints directly cap SOC volume.
What hospital readmission rate should home health agencies target?
Best-in-class is under 14% all-cause 30-day readmission for the home health population. Average is 16-18%, and over 20% risks removal from preferred-provider lists. A readmit rate 2-3 points below the hospital's average makes you the agency they call first. Track by referring hospital and clinical condition, and share outcomes in quarterly business reviews.
How often should sales leaders review home health KPIs?
Daily standups should cover new referrals, SOCs completed, open intakes, and 48-hour compliance. Weekly reviews should analyze conversion by source, SOC velocity, and top-10 account touches. Monthly P&L reviews cover payer mix, gross margin, ALOS, and retention. Quarterly strategic reviews assess top referral source health, readmission rates, and competitive intel. Cadence must match the speed of referral decisions.
What is the benchmark for average length of stay in home health?
Medicare ALOS is 55-65 days, roughly two 30-day periods under PDGM. Private pay averages 80-120 days, and post-acute orthopedic cases run 30-45 days. ALOS under 40 days for Medicare suggests premature discharge or undercoded OASIS. ALOS over 90 days draws audit scrutiny. Sales reps should know ALOS by referral source to set realistic expectations.
How do PDGM changes affect which sales KPIs matter most?
PDGM pays per 30-day period based on clinical grouping, comorbidities, functional level, and admission source. This makes OASIS accuracy and primary diagnosis coding direct revenue drivers. Sales leaders must understand which referral types code into higher-reimbursement groups—Neuro Rehab and Wounds reimburse 15-25% above MMTA-Other. Conversion and time-to-SOC remain critical because they determine episode volume.
FAQ
What is the most important sales KPI for home health care in 2027?
Referral-to-SOC conversion rate is the single most important KPI because it directly measures how many referrals become billable episodes. A branch with 100 referrals at 50% conversion generates 50 SOCs, while a branch with 70 referrals at 80% conversion generates 56 SOCs at lower acquisition cost. Pair conversion with time-to-SOC for full visibility.
How many referrals per month should a home health branch expect?
A mature branch covering 300-500 active patients should receive 80-150 referrals per month. Top-quartile branches in dense metros exceed 200. Track by source: hospital discharge 40-50%, physician practices 20-25%, SNF step-down 15-20%, assisted living 10-15%, and private pay 5-10%. Branches under 60 referrals monthly have a sales coverage problem.
Why is time-to-SOC more important than referral volume?
A referral that sits more than 48 hours has a 30-40% chance of being poached or canceled. Hospitals are trying to clear beds, so a 24-hour SOC means the patient leaves Tuesday instead of Thursday. Branches with sub-24-hour median SOC win 2-3x the share of voice from hospital case management. Volume without speed leaks revenue.
What gross margin should home health agencies expect by payer?
Medicare PDGM gross margin is 35-42% per 30-day period, Medicaid is 18-22% hourly, and private pay is 45-55%. Margins compress when caregiver wages rise faster than reimbursement. Track contribution margin per visit by discipline: skilled nursing $90-110, PT/OT $75-95, home health aide $35-55. Negative aide contribution margin signals over-utilization on Medicare cases.
How does recertification rate impact home health sales performance?
A 45-55% recertification rate for Medicare patients is benchmark. Under 40% means you are discharging too aggressively or your case mix is too acute. Over 65% draws CMS audit risk. Recertifications improve gross margin per visit because episode two has lower nursing intensity but similar reimbursement. Track recert rate by branch and clinical grouping.
What CRM features are essential for tracking home health sales KPIs?
Look for referral source tracking, SOC conversion dashboards, time-to-SOC timestamps, and account management workflows. Salesforce Health Cloud and Axxess CRM modules are common. Essential features include lost-referral reason coding, automated alerts for open intakes, and integration with Homecare Homebase or Axxess for clinical data. Without CRM discipline, KPI tracking collapses.
How do hospital readmission rates affect home health referral volume?
Hospitals are penalized under HRRP for 30-day readmits on heart failure, pneumonia, COPD, AMI, and joint replacements. An agency with readmit rates 3-5 points below national average gets preferred-provider status. A readmit rate 2-3 points below the hospital's average makes you the first call. Track readmits by referring hospital and share results in QBRs.
What is the role of private pay in a home health sales strategy?
Private pay provides 45-55% gross margins and reduces Medicare exposure. It requires consumer marketing, elder-law attorney partnerships, and geriatric care manager referrals. Building a private pay channel to 15-20% of revenue takes 18-24 months. Agencies above 80% Medicare should start private pay pilots immediately because reimbursement compression is ongoing.
How should sales reps be compensated in home health care?
Tie compensation to SOCs and quality outcomes, not just referral volume. Pay on conversion rate, time-to-SOC compliance, and readmission performance. A common model is base salary plus bonus for SOCs above target, with multipliers for private pay or strategic accounts. Reps paid only on referrals will chase volume while conversion leaks.
What is a good caregiver retention rate for home health agencies?
Target 65-75% at 12 months for full-time clinical staff. Part-time aide retention of 50-60% is the industry norm but should be improved. Turnover above 60% annually means sales pipeline outruns staffing capacity. Every 5-point retention improvement adds roughly 10% to branch revenue capacity. Track retention alongside referral dashboards.
Sources
- https://www.cms.gov/Medicare/Quality-Initiatives-Patient-Assessment-Instruments/HomeHealthQualityInits
- https://www.medpac.gov/document-type/reports/
- https://www.nahc.org/
- https://www.cdc.gov/nchs/fastats/home-health-care.htm
- https://www.ahrq.gov/
- https://www.cms.gov/Medicare/Medicare-Fee-for-Service-Payment/HomeHealthPPS
- https://www.bls.gov/ooh/healthcare/home-health-aides.htm
- https://www.hipaajournal.com/
Related on PULSE
- [More sales kpis for commercial home health care rankings and buying guides](/knowledge)
- [PULSE Tools and calculators](/tools)
- [Everything on PULSE RevOps](/)
This page will be disappearing soon. Save it to your device for $1 — or read it free while it is here.
@Kory-White- · if Venmo asks, the last 4 of my number are 2012
 pulse-industry-kpisTop 10 Sales KPIs for Commercial Surgical Center and ASC in 2027
 pulse-industry-kpisTop 10 Sales KPIs for Industrial Bolting & Flange Joint Integrity Services in 2027
 pulse-industry-kpisTop 10 Sales KPIs for Hospital Group Purchasing Organization (GPO) in 2027
 pulse-industry-kpisTop 10 KPIs for Custom Home Builders in 2027
 pulse-industry-kpisTop 10 Sales KPIs for Commercial Locksmith & Access Control Services in 2027
 pulse-industry-kpisTop 10 Sales KPIs for Oilfield Services in 2027
 pulse-industry-kpisTop 10 KPIs for Residential Painters in 2027
 pulse-industry-kpisTop 10 Sales KPIs for Aviation MRO in 2027
 pulse-industry-kpisTop 10 KPIs for Auto Repair Shops in 2027
 pulse-industry-kpisTop 10 Sales KPIs for equine breeding in 2027