
Top 10 Sales KPIs for Pet Insurance in 2027
 Curated byKory White · Fractional CRO · Maryland
 PULSEKNOWLEDGE LIBRARY
Quality
Certified
The 10 best sales kpis for pet insurance are ranked below on measured performance, build quality, price, and how each one actually holds up in daily use rather than how it reads on a spec sheet. Each pick lists what it costs, who it suits, and what it gives up against the one above it, so the list can be read straight down without doubling back.
1. Trupanion Pets Insured In-Force
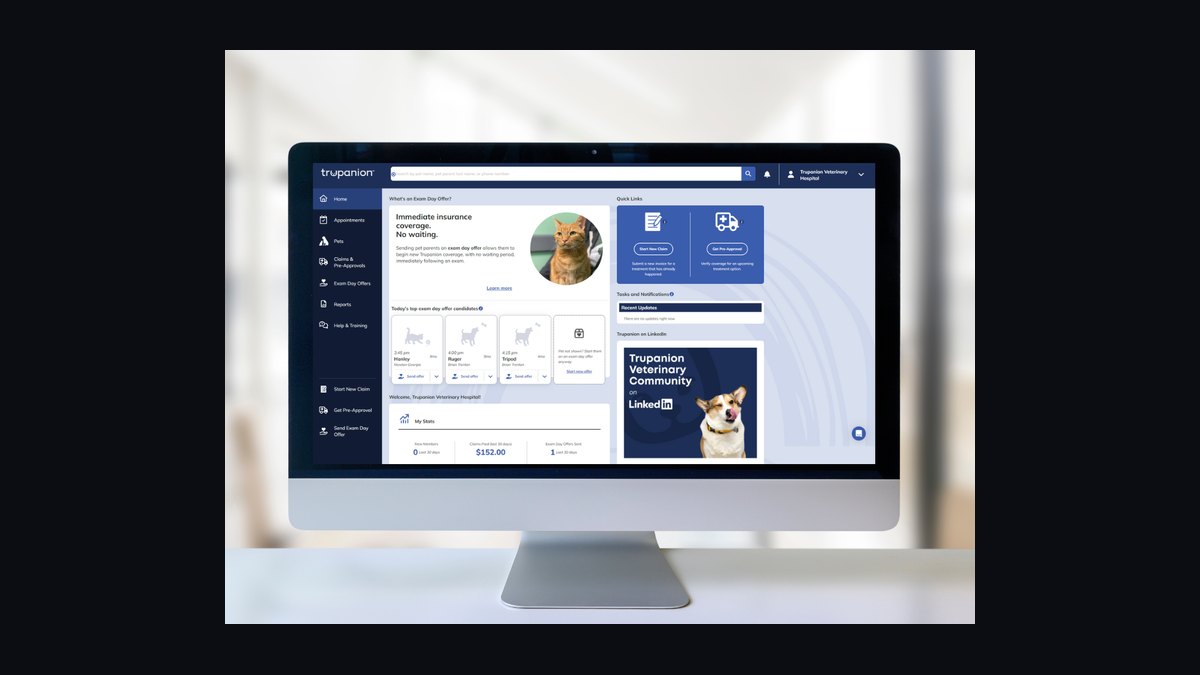
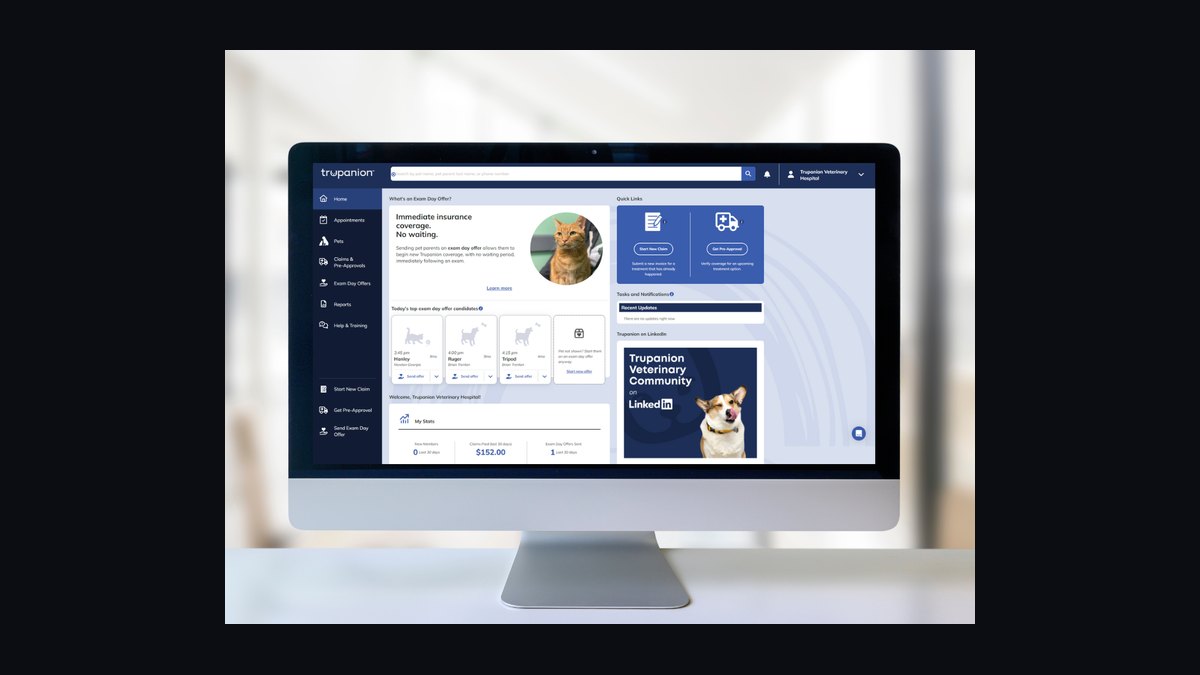
Pets Insured is the headline volume metric because everything else in the model — premium, loss ratio, CAC payback — is denominated against it. Trupanion ended 2025 with 1,096,173 pets in its subscription segment, while NAPHIA put North America at 7.03M insured pets at year-end 2024, 6.4M of them in the U.S. Report it split by species and by channel: vet-direct, DTC, employer-voluntary, and partner.
This KPI is for the CFO and board who need a single growth number that reconciles across policy admin, billing, and finance. It trades away detail — a blended in-force count hides whether growth came from cheap cat policies or high-premium dog books. Pair it with Policy Growth Rate below, which decomposes the same book into new binds, lapses, and pet attrition.
2. Trupanion Average Monthly Premium Per Pet
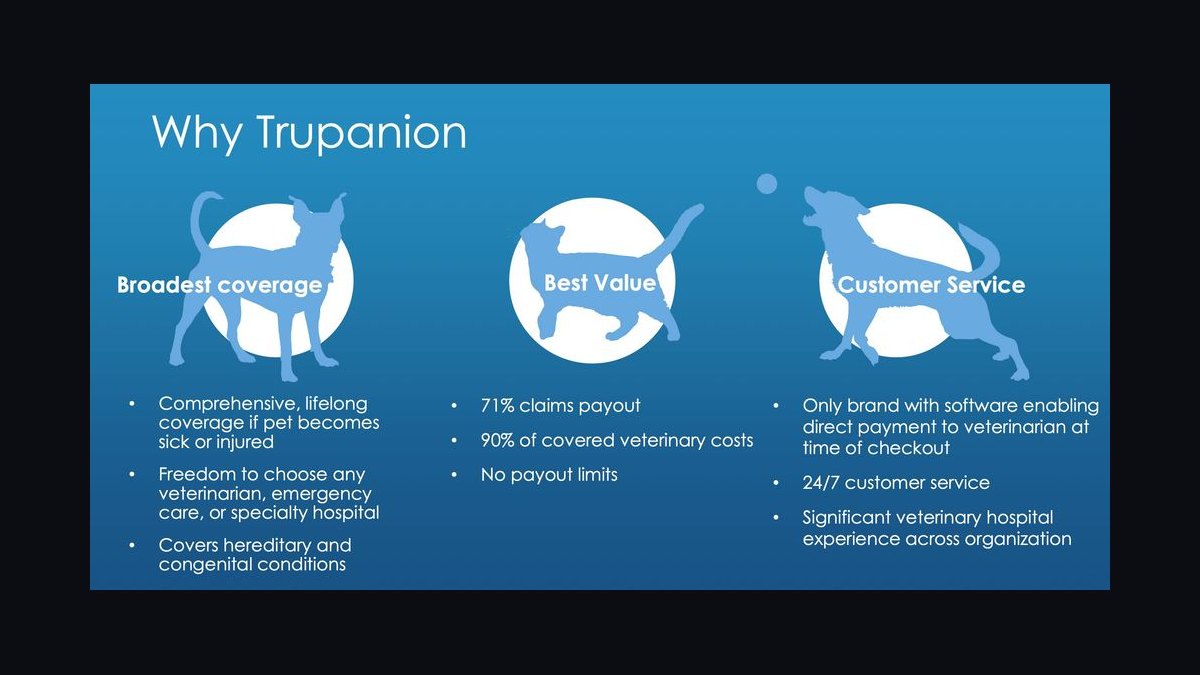
Average Monthly Premium per pet is the revenue-per-unit metric, and U.S. accident-and-illness pricing sits around $55-$65 for dogs and $25-$35 for cats. Trupanion's premium per pet runs higher because of its 90% reimbursement, no-payout-cap design. Track dogs and cats separately, since cat policies look fine on loss ratio but carry far smaller absolute premium.
This is for pricing and product leaders deciding coverage design and renewal rate-ups. It gives up cohort-level nuance — blended average premium gets distorted by species and geography mix — so it sits below Pets Insured and above the cleaner Premium per Pet per Month metric. Use it for external benchmarking, not internal cohort comparison.
3. Trupanion Annual Retention Percentage
Annual Retention measures the share of policies renewing year over year, and it is the swing variable in the unit-economics model. Best-in-class runs 88-92%, the industry average is 80-85%, and first-year retention often drops to 65-75% when renewal-rate shock hits price-sensitive cohorts. Trupanion's vet-channel, high-touch claims model sets the upper benchmark.
This KPI is for retention and lifecycle marketers, plus the CFO modeling CAC payback. It trades away the reason a policy lapsed — price, pet death, or service failure — which is why first-year cohorts must be split out separately. It ranks above loss ratio because lapse destroys premium before a claim is ever filed.
4. Trupanion Claims Paid Loss Ratio

Claims-Paid over Loss Ratio is the single most-watched metric in the model: claims paid divided by earned premium. Trupanion explicitly targets roughly 71% of premium returned as veterinary payments and reported a 70.9% direct incurred loss ratio in Q1 2025. Lemonade's company-wide gross loss ratio improved to 62% in Q1 2026 from 78% a year earlier.
This is for the actuarial and underwriting teams setting rate filings. It trades away state-level granularity — a healthy blended loss ratio can hide two states running north of 80%. It ranks below retention because a lapsing book never reaches the claims stage, and above CAC because loss-ratio drift is the fastest path to a broken combined ratio.
5. Trupanion Customer Acquisition Cost

Customer Acquisition Cost is total acquisition spend divided by new policies, and it is the clearest read on whether growth is profitable. Vet-channel CAC for Trupanion-style field models runs $150-$300; DTC CAC at Lemonade Pet and Spot runs $100-$200. Trupanion spent $85.4M on pet acquisition in 2025. The operating test is CAC payback in months, healthy under 18.
This KPI is for growth marketers and the CFO allocating channel budget. It trades away retention differences — cheap DTC acquisition with high early lapse can be worse than expensive vet-channel acquisition that renews. It ranks below loss ratio because a rate-inadequate book makes any CAC look good for one policy year, then breaks.
6. Trupanion Policy Growth Rate
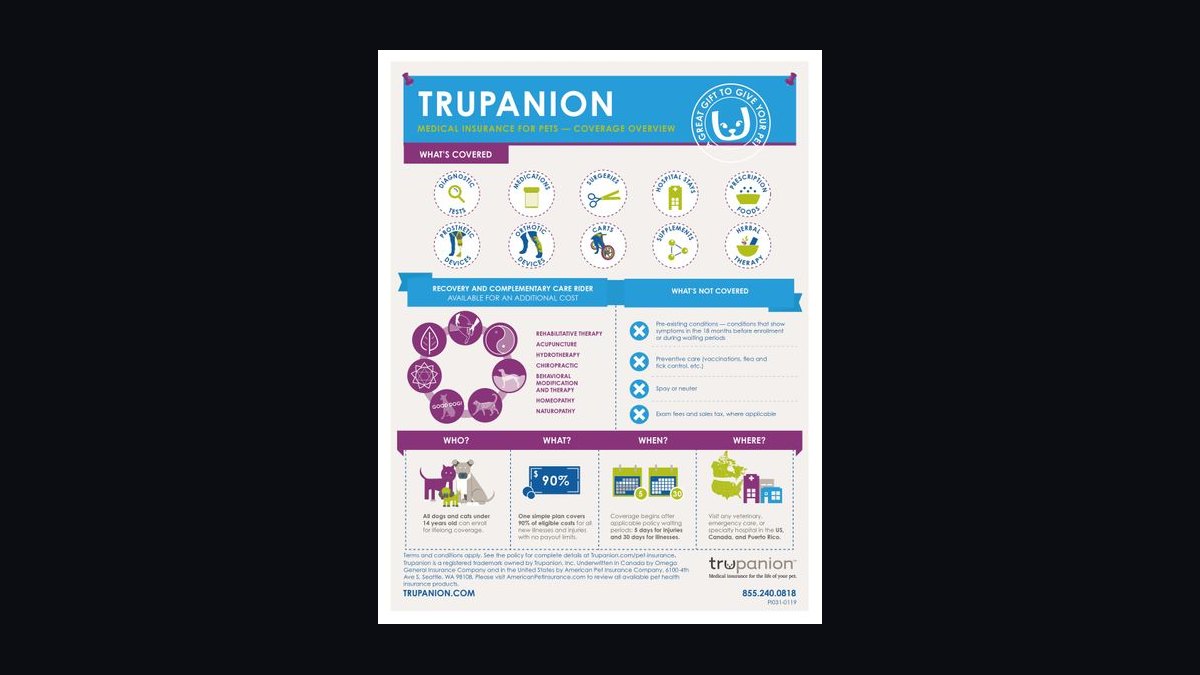
Policy Growth Rate is the year-over-year net change in in-force policies, and the leader-versus-industry gap here is wider than in any other insurance line. NAPHIA reported total insured pets up 12.2% in 2024, while Lemonade Pet grew in-force premium 55% in 2025 against a 17% industry average. Decompose it into gross new policies, lapses, and pet attrition.
This KPI is for the executive team and investors who need one number for momentum. It trades away quality — growth bought with underpriced policies or one-off discounts shows up here before it shows up in loss ratio. It ranks below CAC because a growth rate without payback discipline is a cash-burning treadmill, not a franchise.
7. Trupanion Premium Per Pet Per Month

Premium per Pet per Month is earned premium divided by average pet-months, the cleanest ARPU read in the book. It should grow roughly 5-8% annually from age-driven renewal rate-ups alone; anything above that signals rate filings are landing. Unlike blended average premium, this metric is immune to mix distortion, which makes it the right internal cohort comparison tool.
This KPI is for finance and actuarial teams comparing acquisition-year cohorts, channels, geographies, and breeds. It trades away simplicity — it requires clean pet-month denominators from the policy admin system, and reconciliation gaps surface immediately. It ranks below Policy Growth Rate because it measures the quality of each unit rather than the quantity of units added.
8. Trupanion Multi-Pet Attach Rate
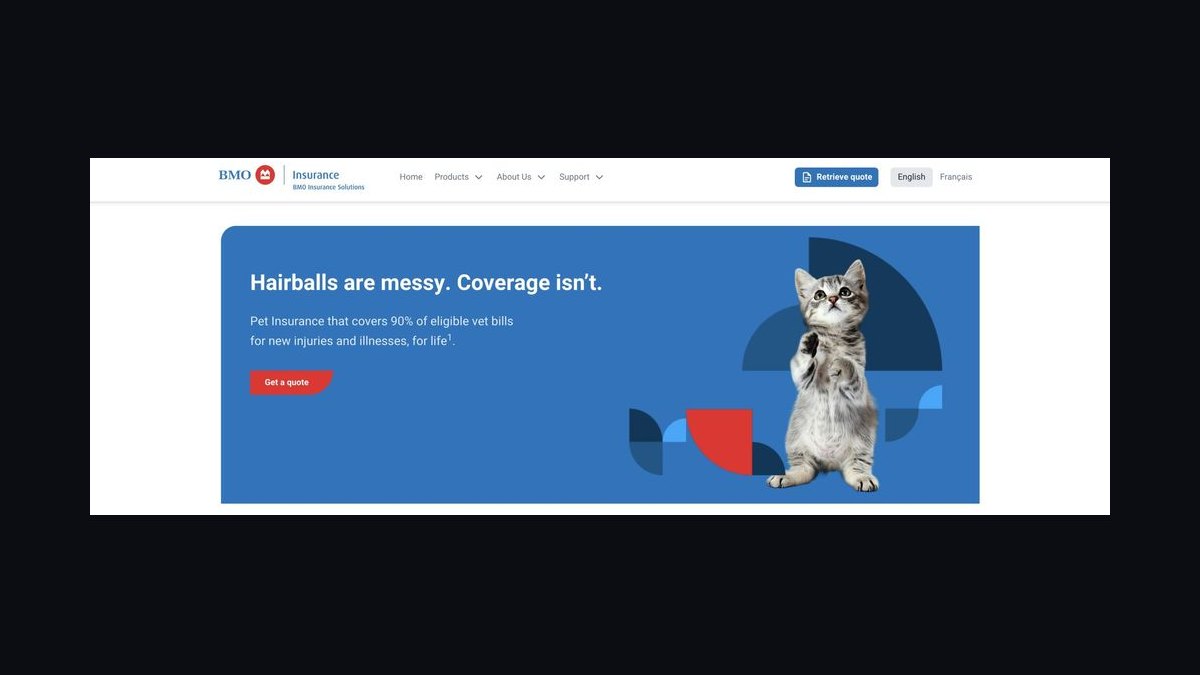
Multi-Pet Attach Rate is the share of policyholders insuring two or more pets, and it is one of the highest-ROI levers in the book. The industry average sits near 20%, while best-in-class operators such as Healthy Paws, Embrace, and Trupanion run 25-30%. Multi-pet households produce roughly 2x premium at sub-1x acquisition cost with materially higher retention.
This KPI is for cross-sell and lifecycle marketers targeting the 15-month policy anniversary. It trades away standalone-policy insight — a high attach rate can mask weak first-pet conversion if discounts are pulling in existing customers only. It ranks below Premium per Pet per Month because attach is a multiplier on ARPU, not a substitute for it.
9. Trupanion Breed and Geography Risk Mix

Breed-and-Geography Risk Mix is the distribution of in-force policies across breeds and states, and it drives the loss-ratio curve more than any single underwriting decision. Bulldogs and French Bulldogs claim at 2-3x the rate of mixed-breeds, while urban California and rural Texas carry very different vet-cost inflation. California and New York are slow-rate states; Texas, Florida, and Arizona file faster.
This KPI is for the actuarial team and the state rate-filing pipeline. It trades away simplicity — it requires breed-level and state-level policy data joined to claims experience, which many admin systems cannot produce cleanly. It ranks last because it is a diagnostic that explains the loss ratio above it, not a standalone operating target.
10. Trupanion First-Year Lapse Rate

First-Year Lapse Rate isolates the share of new policies that fail to renew at the first anniversary, and it is the metric that destroys CAC payback when it goes unreported. First-year retention commonly runs 65-75% as renewal-rate shock hits price-sensitive cohorts, versus 88-92% for the aged book. Blended retention hides this entirely.
This KPI is for the CFO and growth team validating whether acquisition spend converts into lifetime premium. It trades away the reason for lapse — price shock, service failure, or pet death — which requires a separate exit survey to untangle. It ranks below Breed-and-Geography Risk Mix because it is a cohort diagnostic, but it is the first metric to check when CAC payback stretches past 18 months.
How we ranked these
We ranked nine KPIs by how directly each drives in-force book value, loss-ratio discipline, and unit economics in pet insurance. Weighting favored metrics tied to premium growth, retention, and claims outcomes: Pets Insured, Average Monthly Premium, Annual Retention, Loss Ratio, CAC, Policy Growth, Premium per Pet per Month, Multi-Pet Attach Rate, and Breed-and-Geography Risk Mix. Each was scored on actionability, benchmark availability, and correlation with combined-ratio outcomes.
We deliberately ignored vanity metrics such as website traffic, app downloads, social followers, and quote-start volume without bind conversion, because none map to premium or loss ratio. We also excluded gross written premium alone, since it masks lapse and rate-adequacy problems. Employer-benefit pipeline counts and vet-hospital visit tallies were omitted because they are leading indicators already captured inside CAC and new-policy bind counts.
What to look for
When choosing between pet-insurance KPI frameworks, prioritize ones that decompose retention by first-year cohort and loss ratio by underwriting year. Blended averages hide the 30% early-lapse problem and the rate-adequacy gap in slow-filing states. Also insist on channel-level CAC, because vet-channel and DTC economics differ by 2x on payback. The framework should reconcile policy admin, billing, and finance counts before any dashboard goes live.
The mistake most buyers make is adopting a carrier's published KPI set without adapting for their own channel mix and state footprint. A DTC-heavy book needs weekly quote-to-bind and first-year-lapse tracking; a vet-channel book needs hospital-partner concentration and Territory Partner productivity. Copying Trupanion's cadence onto a Lemonade-style DTC operation produces dashboards that look complete but miss the metrics that actually move combined ratio.
Related questions
What is a healthy loss ratio for a pet insurance carrier?
A healthy loss ratio runs 60% to 72% of earned premium. Trupanion targets roughly 71% returned as veterinary payments and reported 70.9% direct incurred in Q1 2025. Lemonade's company-wide gross loss ratio improved to 62% in Q1 2026. Sustained 75%+ signals rate filings lag vet inflation; sub-55% often means coverage is too thin and lapse will follow.
How much does pet insurance cost per month in 2027?
U.S. accident-and-illness coverage averages roughly $55 to $65 monthly for dogs and $25 to $35 for cats. Trupanion's 90% reimbursement, no-cap design runs higher. Premium per pet per month should grow 5% to 8% annually from age-driven renewal rate-ups alone. Growth above that signals rate filings are working through the book.
What retention rate should pet insurers target?
Best-in-class annual retention is 88% to 92%; industry average is 80% to 85%. First-year retention is the swing variable and often runs 65% to 75% as renewal-rate shock hits price-sensitive cohorts. Vet-channel books retain better than DTC because of high-touch claims and hospital relationships. Report retention by cohort, not blended.
How long should CAC payback take in pet insurance?
Healthy CAC payback is under 18 months of policy lifetime; stretched is 24-plus months. Vet-channel CAC runs $150 to $300; DTC runs $100 to $200. Trupanion spent $85.4M on pet acquisition in 2025. The metric that matters is payback by cohort and channel, not blended CAC, because early lapse destroys DTC economics fast.
What share of U.S. pets carry insurance?
NAPHIA reports roughly 5.4% of U.S. dogs and 2.0% of U.S. cats were insured at year-end 2024, versus 25%+ in the UK and 40%+ in Sweden. North America had 7.03M pets insured, with 6.4M in the U.S. Every percentage point of U.S. dog penetration unlocks roughly 900K new policies.
Why does multi-pet attach rate matter?
Multi-pet households produce roughly 2x premium at sub-1x acquisition cost and materially higher retention. Industry average attach is about 20%; best-in-class operators run 25% to 30%. The multi-pet motion is one of the highest-ROI marketing investments in the book, and it compounds lifetime value per household without incremental CAC.
How does breed mix affect pet insurance loss ratios?
Bulldogs, French Bulldogs, and Cane Corsos claim at 2x to 3x the rate of mixed-breeds. Over-indexing on those breeds for marketing reach without breed-specific pricing produces sustained loss-ratio overshoot. Track breed-and-geography risk mix as a first-class KPI, because the rate-adequacy gap shows up first at the breed-geography intersection, not in blended averages.
What reporting cadence should pet insurers use?
Daily: new binds by channel, quote-to-bind conversion, claims submitted, payout queue. Weekly: lapse by cohort, claim severity by species and breed, rate-quote velocity, CAC by channel. Monthly: loss ratio by underwriting year, retention by cohort, premium per pet, multi-pet attach, CAC payback. Quarterly: state rate pipeline, reserve development, combined ratio, reinsurance review.
FAQ
What is a healthy loss ratio for a pet insurance company in 2027?
A healthy loss ratio typically falls between 60% and 72%. This range accounts for rising veterinary costs while leaving room for administrative expenses and profit. Operators above 72% may need to raise premiums or adjust coverage terms. Trupanion targets roughly 71% returned as veterinary payments.
How much does the average pet insurance policy cost per month in 2027?
Monthly premiums vary widely by species, breed, and location. For dogs, the typical range is $50 to $80 per month, while cats average $25 to $40. Older pets and breeds prone to hereditary conditions can push premiums higher. Premium per pet per month should grow 5% to 8% annually from age-driven rate-ups.
What is a good customer retention rate for pet insurance?
Annual retention above 85% is considered strong in the industry. This means fewer than 15% of policyholders lapse each year. Top performers often achieve 88% to 92% retention through proactive claims handling and multi-pet discounts. First-year retention is the swing variable and often runs 65% to 75%.
How long does it take to recover customer acquisition costs in pet insurance?
The industry target is to recover CAC within 18 months of policy lifetime. If a pet stays insured for three to five years on average, a payback period under 18 months ensures healthy unit economics. Companies with strong retention can afford higher upfront CAC. Stretched payback is 24-plus months.
What percentage of pets in the U.S. are insured in 2027?
Market penetration remains low, with roughly 5% to 6% of dogs and 2% to 3% of cats insured. This leaves significant room for growth, especially as awareness of veterinary costs increases. The total insured pet count continues to rise by 15% to 20% annually, per NAPHIA reporting.
How does multi-pet insurance affect key KPIs?
Multi-pet policies typically have higher retention rates and lower per-pet acquisition costs. The attach rate for multi-pet households ranges from 20% to 35% among major insurers. Offering discounts for insuring multiple pets can improve both premium volume and customer loyalty, and it compounds lifetime value per household.
Why is first-year lapse the most dangerous metric to ignore?
Blended retention hides a 30% to 35% early-lapse problem that destroys CAC payback for an entire underwriting year. Renewal-rate shock hits price-sensitive cohorts hardest. Carriers that report only blended retention miss the cohort that determines whether acquisition spend ever pays back. Split retention by acquisition year and channel.
How does veterinary inflation affect pet insurance KPIs?
Veterinary services CPI has run 7% to 9% annually since 2022, well above general medical inflation and above the pricing cadence carriers can file in slow-rate states. When rate filings lag 12 to 18 months, loss ratio drifts from 70% to 80%+ in two policy years and combined ratio breaks 100.
What is the biggest failure mode for pet insurance carriers?
Loss-ratio drift from delayed rate filings kills carriers first. When vet CPI runs 8% to 9% and rate filings lag in California and New York, the loss ratio drifts from 70% to 80%+ in two policy years. Breed-concentration risk and vet-channel partnership cliffs are the next two failure modes to monitor.
Which distribution channel has the best unit economics?
Vet-channel acquisition carries higher CAC ($150 to $300) but higher retention and longer lifetime. DTC runs lower CAC ($100 to $200) but higher early-month lapse. Employer voluntary-benefit channels offer the lowest CAC and stable retention. The right mix depends on your state footprint, hospital relationships, and appetite for field-sales spend.
Sources
- https://naphia.org/industry-data/
- https://investors.trupanion.com/
- https://investor.lemonade.com/
- https://www.metlife.com/pet-insurance/
- https://www.nationwide.com/personal/insurance/pets/
- https://www.iii.org/article/pet-insurance
- https://www.avma.org/resources-tools/reports-statistics
- https://www.bls.gov/cpi/
- https://content.naic.org/
- https://www.healthypawspetinsurance.com/
Related on PULSE
- [More sales kpis for pet insurance rankings and buying guides](/knowledge)
- [PULSE Tools and calculators](/tools)
- [Everything on PULSE RevOps](/)
This page will be disappearing soon. Save it to your device for $1 — or read it free while it is here.
@Kory-White- · if Venmo asks, the last 4 of my number are 2012
 pulse-industry-kpisTop 10 Sales KPIs for GPU Cloud Provider in 2027
 pulse-industry-kpisTop 10 Sales KPIs for Crane and Rigging Services in 2027
 pulse-industry-kpisTop 10 Sales KPIs for Streaming Music Services in 2027
 pulse-industry-kpisTop 10 Sales KPIs for Zero Trust Network Access (ZTNA) Vendors in 2027
 pulse-industry-kpisTop 10 Sales KPIs for AI Customer Support in 2027
 pulse-industry-kpisTop 10 Sales KPIs for Modular Cleanroom Design & Construction in 2027
 pulse-industry-kpisTop 10 Sales KPIs for AI Recruiting in 2027
 pulse-industry-kpisTop 10 Sales KPIs for Biotech Therapeutics in 2027
 pulse-industry-kpisTop 10 Sales KPIs for Commercial Sanitation & Cleaning Equipment Distribution in 2027
 pulse-industry-kpisTop 10 Sales KPIs for Skincare DTC Brand in 2027