
Top 10 Sales KPIs for AI Agent Framework in 2027
 Curated byKory White · Fractional CRO · Maryland
 PULSEKNOWLEDGE LIBRARY
Quality
Certified

The 10 best sales kpis for ai agent framework are ranked below on measured performance, build quality, price, and how each one actually holds up in daily use rather than how it reads on a spec sheet. Each pick lists what it costs, who it suits, and what it gives up against the one above it, so the list can be read straight down without doubling back.
1. Net New ARR

Net new ARR ranks first because it is the only metric that answers whether free adoption converts into paid contracts. It combines new logo subscription dollars with expansion, net of contraction, in a single period. In open-source-first agent frameworks it tracks the cohort of free users who crossed into production roughly a year earlier, not this quarter's downloads.
It is for revenue leaders and boards who need one number that reconciles the open-source funnel to the billing system. It trades away granularity: a single large deal can move it several points, so it is noisy at low customer counts. Read it directly against the deployment and renewal metrics below it, never against current-quarter adoption.
2. Net Revenue Retention
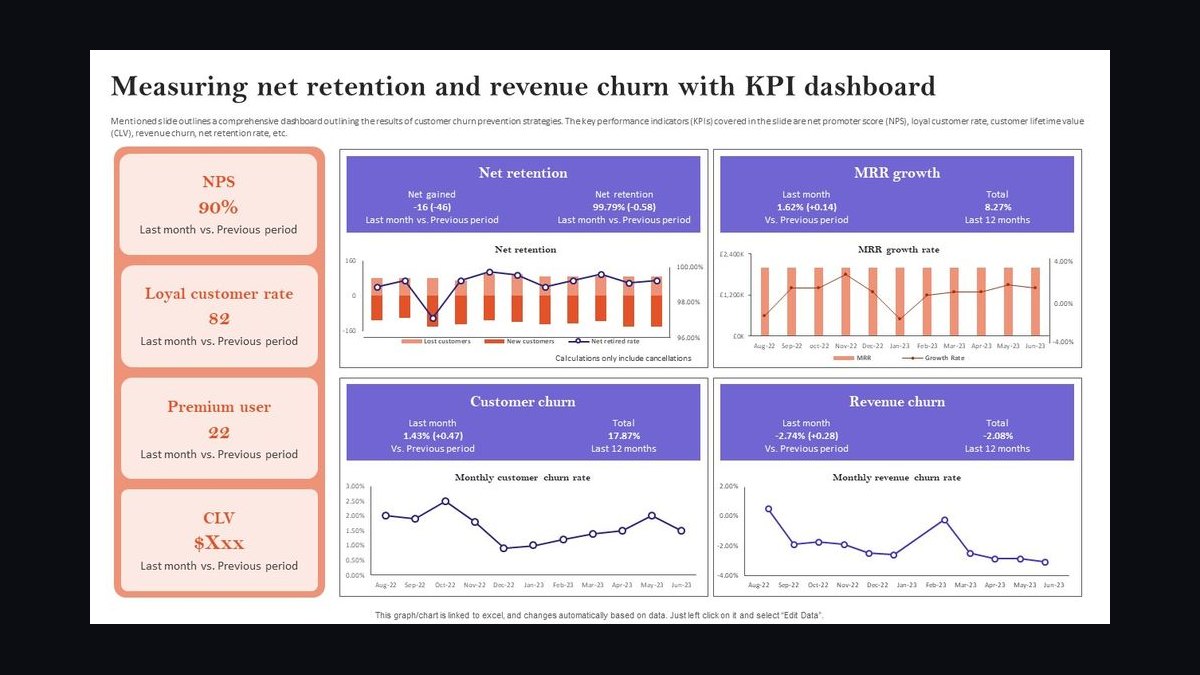
Net revenue retention ranks second because in agent frameworks expansion is unusually mechanical: customers add agents, agents add traces, traces add cost. Best-in-class enterprise NRR in developer tooling runs 120-140%. Below 110% in a usage-expanding category signals customers hit a deployment ceiling, usually reliability or cost visibility rather than pricing.
It is for finance and revenue operations tracking whether the existing base grows without new logos. It trades away the logo question entirely: a vendor can renew 95% of customers and still post NRR under 100% if accounts shrink. Compare it against renewal rate directly below, since the two diverge precisely when accounts stall.
3. Weekly Active Developers
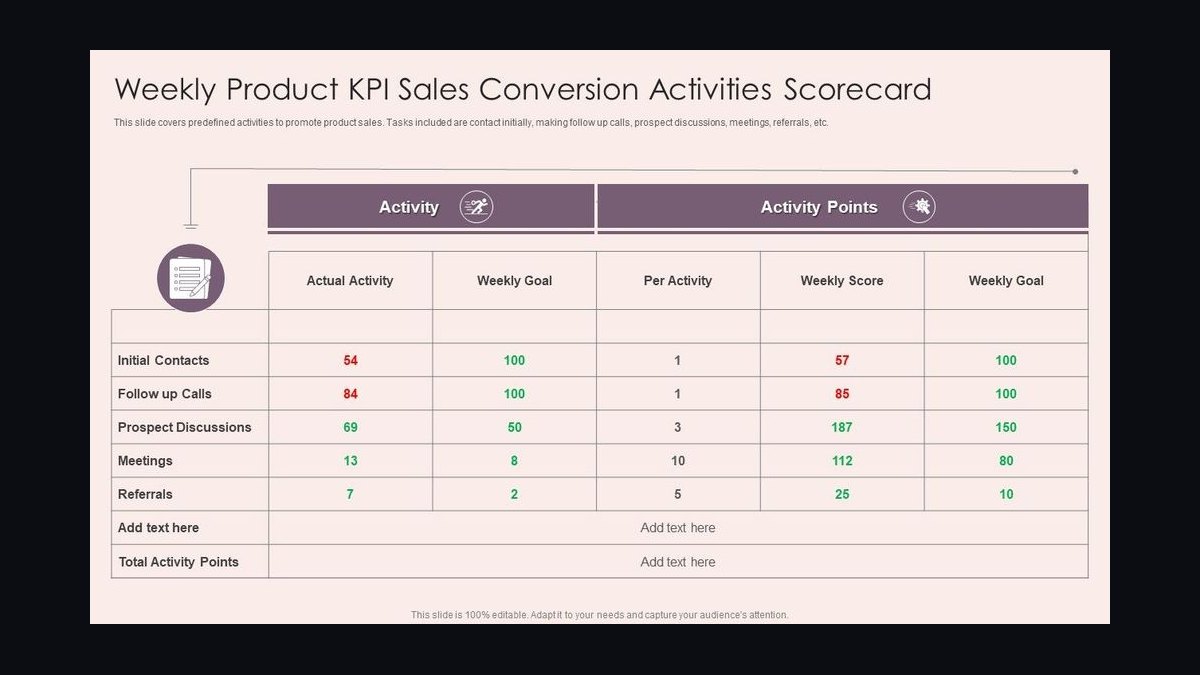
Weekly active developers ranks third because developer adoption leads paid revenue by roughly twelve to eighteen months, making it the leading indicator the whole pipeline depends on. It is approximated from package download telemetry, docs engagement, and authenticated CLI or SDK activity where a hosted component exists. Treat it as a range, not a number.
It is for product and growth teams planning pipeline against adoption cohorts from a year prior. It trades away precision: CI runners, corporate mirrors, and container builds inflate raw downloads by a large unstable factor. Any team reporting this without a disclosed de-duplication methodology is reporting noise, and it sits above deployment count because adoption precedes production.
4. Production Agent Deployments Per Customer
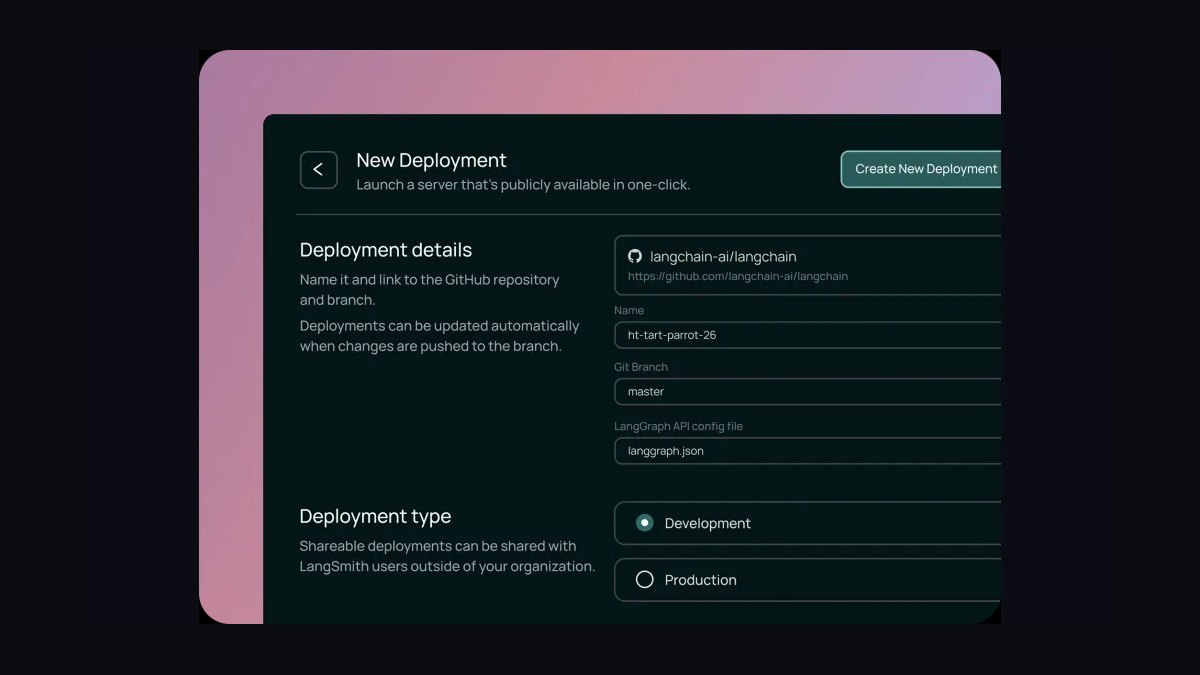
Production agent deployments per customer ranks fourth because it is the single best predictor of renewal. One deployment is an experiment; ten is a platform decision. Mature accounts commonly run ten to a hundred across departments, and the distribution is heavily skewed, so a median beats a mean. Count distinct flows executing above a weekly call floor.
It is for customer success and sales teams segmenting accounts by expansion headroom. It trades away simplicity: the definition of a production deployment must be frozen for at least four quarters or the trend records definitional drift. Read it as a trend rather than a level, since an account falling from twelve agents to seven is a churn candidate even at a healthy absolute count.
5. Average Tools Per Agent Flow
Average tools per agent flow ranks fifth because it is the best available proxy for how deeply the framework is wired into internal systems. Five to fifteen tools is typical for a working enterprise flow; twenty-plus indicates deep coupling across CRM, billing, ticketing, and data warehouse. A flow calling two tools is portable and easy to rip out.
It is for platform teams and account managers assessing retention moats and support load. It trades away comparability across customers, since a nightly classification job and a customer-facing support agent with billing access produce very different depths. It sits below deployment count because depth only matters once a flow is actually running in production.
6. Observability Integration Depth
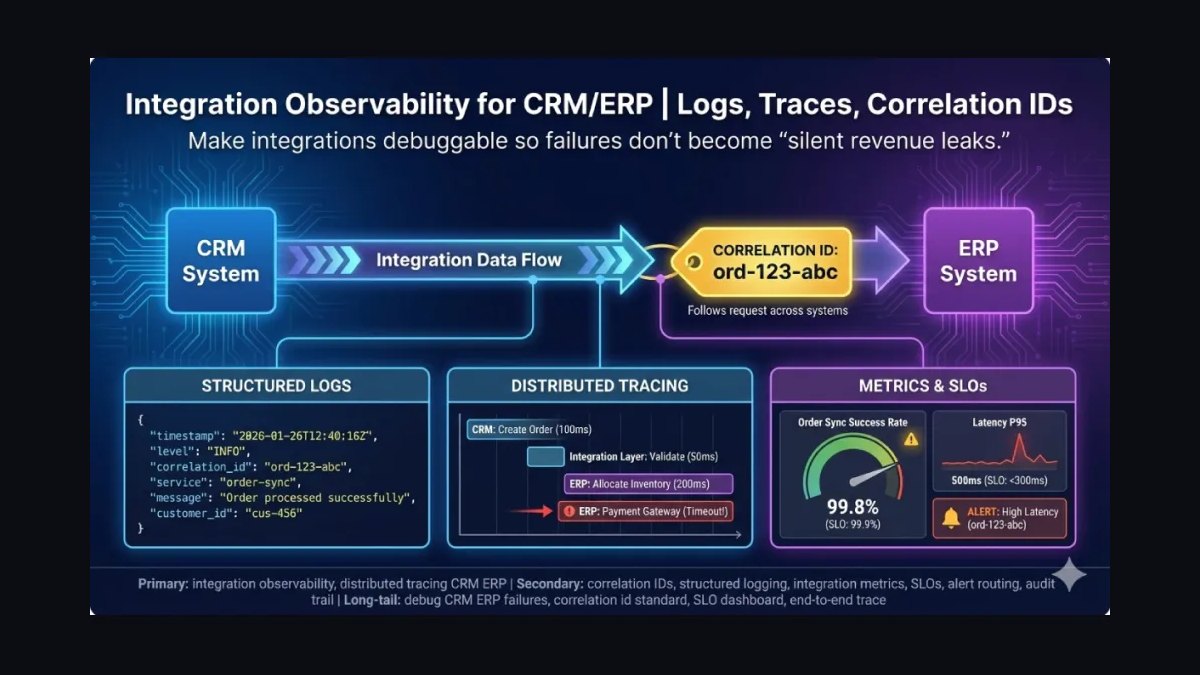
Observability integration depth ranks sixth because it functions as a procurement gate rather than a differentiator. Count the natively supported tracing and monitoring backends: LangSmith, Langfuse, Arize, Datadog, Honeycomb, and OpenTelemetry among them. Five or more native integrations is competitive. Below that threshold, enterprise deals stall regardless of framework quality.
It is for sales engineers and platform buyers running production readiness reviews. It trades away upside: deals rarely close because tracing is excellent, but they routinely die because traces cannot export to the backend the platform team already runs. It sits below tools per flow because integration depth is a depth metric only after deployment is secured.
7. Multi-Provider Model Support Count

Multi-provider model support count ranks seventh because enterprise buyers in 2027 explicitly de-risk provider concentration and score it during procurement as a risk item, not a feature. Ten or more natively supported providers is best-in-class. Composition matters more than count: a list of ten omitting self-hosted open-weight inference loses to a list of six that includes it.
It is for platform architects and procurement teams evaluating two-year contract exposure to a single model vendor. It trades away depth per provider, since broad routing often means shallow support for each. It sits below observability because a missing tracing backend kills deals outright, while provider coverage usually only narrows the field.
8. Documentation And Tutorial Completeness

Documentation and tutorial completeness ranks eighth because weak docs cap adoption regardless of framework quality, making it the most common silent failure in the category. Score it on a structured rubric: API reference completeness, runnable examples, end-to-end tutorials, migration guides. An eight out of ten is the working target. When adoption stalls with good architecture, the getting-started path is usually the cause.
It is for developer relations and product teams at early stage, where it is one of the few directly actionable levers. It trades away glamour: docs work is measurable and cheap but never wins an announcement. It sits below provider coverage because it drives adoption volume rather than closing individual enterprise deals.
9. Renewal Rate At 12 Months

Renewal rate at 12 months ranks ninth because it is a lagging metric that only becomes trustworthy once segmented. Logo retention of 88% is healthy on the paid tier; 92% or above is strong. Read it alongside deployment count per customer, because single-deployment customers churn at multiples of the rate of multi-deployment ones, and blending the two cohorts hides the entire signal.
It is for finance and customer success teams reporting retention to the board. It trades away timeliness: by the time a renewal is lost, the deployment trend that predicted it was visible two quarters earlier. It sits below documentation because it confirms what adoption, deployment, and integration metrics already forecast.
10. Time To First Production Deployment

Time to first production deployment ranks tenth because it is both a competitive differentiator and an early churn predictor, but it is only meaningful once the other nine metrics are instrumented. Frameworks with starter templates, prebuilt dashboards, and one-click hosted deploy compress it dramatically versus those requiring bespoke infrastructure work. Measure it from onboarding data and trend it quarterly.
It is for onboarding and solutions teams at growth stage, where every improvement is unambiguously good with no offsetting cost. It trades away board-level visibility, since it rarely appears in investor reporting. It sits below renewal rate because it predicts that number rather than explaining it after the fact.
How we ranked these
We ranked nine KPIs by weighting revenue impact, predictability, and actionability for open-source-first agent framework vendors. Net new ARR and net revenue retention carried the most weight because they directly reflect commercial health. Weekly active developers, production deployments per customer, and 12-month renewal rate followed as leading and lagging adoption signals. Observability depth, multi-provider support, tools per flow, and documentation completeness scored lower but act as enterprise procurement gates.
We deliberately ignored repository stars, raw download counts, social mentions, and conference keynote volume. These correlate with news cycles rather than production usage and routinely mislead boards. We also excluded generic SaaS metrics like CAC payback and magic number, since open-source adoption breaks attribution and makes them unreliable. Model benchmark scores were excluded too, because buyers in 2027 evaluate routing flexibility and reliability, not leaderboard position.
What to look for
What matters most is whether the framework can pass a platform team's production readiness review. Check native tracing exports to LangSmith, Langfuse, Datadog, and OpenTelemetry, plus loop detection, retry policies, and human-in-the-loop interrupts. Multi-provider routing including self-hosted open-weight models is now a procurement gate, not a feature. Documentation quality and time-to-first-production-deployment predict renewal more accurately than any sales pitch.
The mistake most buyers make is choosing on developer ergonomics alone, then discovering observability and audit gaps during security review. Another common error is signing against a single model provider because the demo looked clean, then facing a two-year concentration risk the platform team rejects. Buyers also underweight deployment depth per customer, which is the strongest single predictor of whether the vendor relationship survives month twelve.
Related questions
What is net new ARR and why does it lead agent framework KPIs?
Net new ARR is new logo plus expansion subscription dollars minus contraction in a period. In open-source-first agent frameworks it is almost entirely driven by how many free users crossed into production last quarter, not how many discovered the framework this quarter. It is the clearest lagging revenue signal and should be read alongside deployment counts.
How is weekly active developers measured without inflating numbers?
Teams approximate it from package download telemetry, docs engagement, and authenticated CLI or SDK activity where a hosted tier exists. Downloads are polluted by CI runners and corporate mirrors, so a de-duplication methodology using known runner IP ranges and user-agent patterns is essential. Report a range with disclosed assumptions, never a single marketing number.
Why do production agent deployments per customer predict renewal?
One deployment is an experiment; ten is a platform decision. Accounts running multiple production agent flows are deeply coupled into internal systems, which creates switching costs and expansion revenue. Single-deployment customers churn at multiples of the rate of multi-deployment ones, so blending them hides the real retention signal. Segment renewal by deployment count before trusting any average.
What observability integrations are mandatory for enterprise agent framework deals?
Native support for LangSmith, Langfuse, Arize, Datadog, Honeycomb, and OpenTelemetry is effectively a gate. Below a threshold of roughly five native backends, enterprise deals do not close regardless of framework quality, because platform teams require structured trace export to their existing monitoring stack. Missing this fails the production readiness review after the champion has already advocated internally.
How many model providers should an agent framework support in 2027?
Ten or more native providers is best-in-class, but composition matters more than count. A list of ten that omits self-hosted open-weight inference will lose deals to a list of six that includes it. Enterprise buyers explicitly de-risk provider concentration, so multi-provider routing is scored during procurement as a risk item rather than a feature comparison.
What documentation completeness score should buyers expect?
An eight out of ten on a structured rubric covering API reference completeness, runnable examples, end-to-end tutorials, and migration guides. Weak docs cap adoption regardless of framework quality and are the most common silent failure in the category. When adoption stalls with good architecture, the cause is often a getting-started path that takes four hours instead of forty minutes.
What is a healthy 12-month renewal rate for agent framework vendors?
Eighty-eight percent is healthy and ninety-two percent or higher is strong, but always segment by deployment count first. Single-deployment customers churn at multiples of the rate of multi-deployment ones. Blending the two cohorts produces a number that looks stable while hiding a renewal cliff forming in the shallow-adoption segment of the customer base.
How long does it take to instrument all nine agent framework KPIs?
Standing up honest instrumentation across all nine typically takes a quarter of work for one data engineer plus meaningful analytics-engineering time. Ongoing maintenance is not trivial because registry APIs change, docs platforms change, and every new observability integration adds a telemetry surface. Teams using weekly manual exports get about six weeks before numbers stop reconciling.
FAQ
What are the top sales KPIs for AI agent frameworks in 2027?
The nine core metrics are net new ARR, net revenue retention, weekly active developers, production agent deployments per customer, average tools per agent flow, observability integration depth, multi-provider model support count, documentation completeness, and 12-month renewal rate. Developer adoption leads paid revenue by roughly a year, so leading and lagging indicators live in different systems and must be joined deliberately.
Why is developer adoption a leading indicator for agent framework revenue?
A developer at a large enterprise can pull the package, build a multi-agent workflow, run it for six months, and never appear in CRM until procurement calls. Adoption density, not adoption events, predicts future revenue. Tracking weekly active developers and production deployments gives revenue teams a product-qualified-account queue roughly a year before the contract is signed.
What net revenue retention should agent framework vendors target?
Best-in-class enterprise NRR in developer tooling typically runs 120 to 140 percent. In agent frameworks the expansion vector is unusually clean because customers add agents, agents add traces, and traces add cost, so growth is mechanical if customer usage grows. Below 110 percent in a usage-expanding category usually signals a deployment ceiling caused by reliability or cost issues.
How do you avoid inflating weekly active developer counts?
Model the CI share separately using known runner IP ranges and user-agent patterns, publish an estimate with an explicit band, and hold the methodology constant across quarters. A framework reporting fifty thousand weekly active developers without disclosing methodology is reporting a marketing number. If you cannot explain de-duplication in two sentences, do not report the metric.
Why do repository stars mislead agent framework sales teams?
Stars are a bookmarking behavior with strong correlation to news cycles and weak correlation to production usage. A framework can add tens of thousands of stars from one conference keynote and see no measurable change in production deployments. Track stars as brand awareness on a separate panel and never place them on the same chart as ARR.
What is the most common mistake when choosing an agent framework?
Choosing on developer ergonomics alone and discovering observability, audit logging, and cost attribution gaps during security review. Tracing and audit are gates, not features. A framework that cannot export structured traces to the customer's existing backend gets rejected at production readiness review, after the technical champion has already spent months advocating internally.
How does time-to-first-production-deployment affect retention?
It measures how long a new customer takes to go from a hello-world agent to a monitored production workload. Frameworks with starter templates, prebuilt dashboards, and one-click hosted deploy compress this dramatically. It is both a competitive differentiator and an early churn predictor, and it is one of the few metrics where improvement is unambiguously good with no offsetting cost.
What reliability features do platform teams require before approving agents?
Loop detection, iteration ceilings, retry policies, circuit breakers, structured error handling, human-in-the-loop interrupts, and graceful degradation. These separate a research-grade framework from one a platform team will approve for revenue-critical paths. Selling enterprise reliability you have not shipped produces a renewal cliff at month twelve that relationship management cannot fix.
How should early-stage agent framework vendors prioritize KPIs?
Under roughly twenty-five paid customers, revenue metrics are too noisy to steer by because one deal moves NRR by ten points. Steer by documentation completeness, active developer trend, and time-to-first-production-deployment instead. These three predict everything downstream and are directly actionable by a small team. Ignore stars entirely at this stage to avoid optimizing for announcements.
Why does output quality become a commercial metric for agent frameworks?
As agents move onto revenue-critical paths, the rate of factually incorrect or logically inconsistent outputs per thousand production calls becomes a buying criterion. Buyers increasingly ask for a number and a mitigation strategy covering validation layers, tool-use fallbacks, confidence thresholds, and human review triggers. Vendors who cannot produce both are compared unfavorably regardless of actual quality.
Sources
- https://opentelemetry.io/docs/
- https://langfuse.com/docs
- https://docs.smith.langchain.com/
- https://arize.com/docs/
- https://docs.datadoghq.com/tracing/
- https://www.honeycomb.io/docs/
- https://docs.aws.amazon.com/bedrock/
- https://cloud.google.com/vertex-ai/docs
- https://learn.microsoft.com/en-us/azure/ai-services/
- https://docs.vllm.ai/en/latest/
Related on PULSE
- [More sales kpis for ai agent framework rankings and buying guides](/knowledge)
- [PULSE Tools and calculators](/tools)
- [Everything on PULSE RevOps](/)
This page will be disappearing soon. Save it to your device for $1 — or read it free while it is here.
@Kory-White- · if Venmo asks, the last 4 of my number are 2012
 pulse-industry-kpisTop 10 Sales KPIs for AI Video Generation in 2027
 pulse-industry-kpisTop 10 KPIs for Driving Schools in 2027
 pulse-industry-kpisTop 10 Sales KPIs for Used Vehicle Retail in 2027
 pulse-industry-kpisTop 10 Sales KPIs for Luxury Fashion House in 2027
 pulse-industry-kpisTop 10 KPIs for Dance Studios in 2027
 pulse-industry-kpisTop 10 Sales KPIs for LLM API Provider in 2027
 pulse-industry-kpisTop 10 Sales KPIs for Background Check Services in 2027
 pulse-industry-kpisTop 10 Sales KPIs for AI Image Generation in 2027
 pulse-industry-kpisTop 10 Sales KPIs for AI Legal Tools in 2027
 pulse-industry-kpisTop 10 Sales KPIs for AI Code Review in 2027