
Top 10 Sales KPIs for AI Image Generation in 2027
 Curated byKory White · Fractional CRO · Maryland
 PULSEKNOWLEDGE LIBRARY
Quality
Certified

The 10 best sales kpis for ai image generation are ranked below on measured performance, build quality, price, and how each one actually holds up in daily use rather than how it reads on a spec sheet. Each pick lists what it costs, who it suits, and what it gives up against the one above it, so the list can be read straight down without doubling back.
1. Net New ARR

Net new ARR ranks first because it is the only metric that combines fresh logo revenue, expansion, and contraction into one growth signal for AI image generation vendors. In a category growing this quickly, a healthy net number can conceal serious logo churn masked by expansion inside a handful of large accounts. The discipline that matters is reporting the three components separately rather than the sum, since concentration risk only becomes visible when one large account renegotiates.
It is for revenue leaders and boards who need a single headline growth figure, and it trades away diagnostic detail unless the components are split out. Compared with net revenue retention directly below it, net new ARR captures new logos while NRR captures only existing-account behavior. Teams watching only ARR find out about softness in the renewal cycle, two or three months after operating metrics drift.
2. Net Revenue Retention
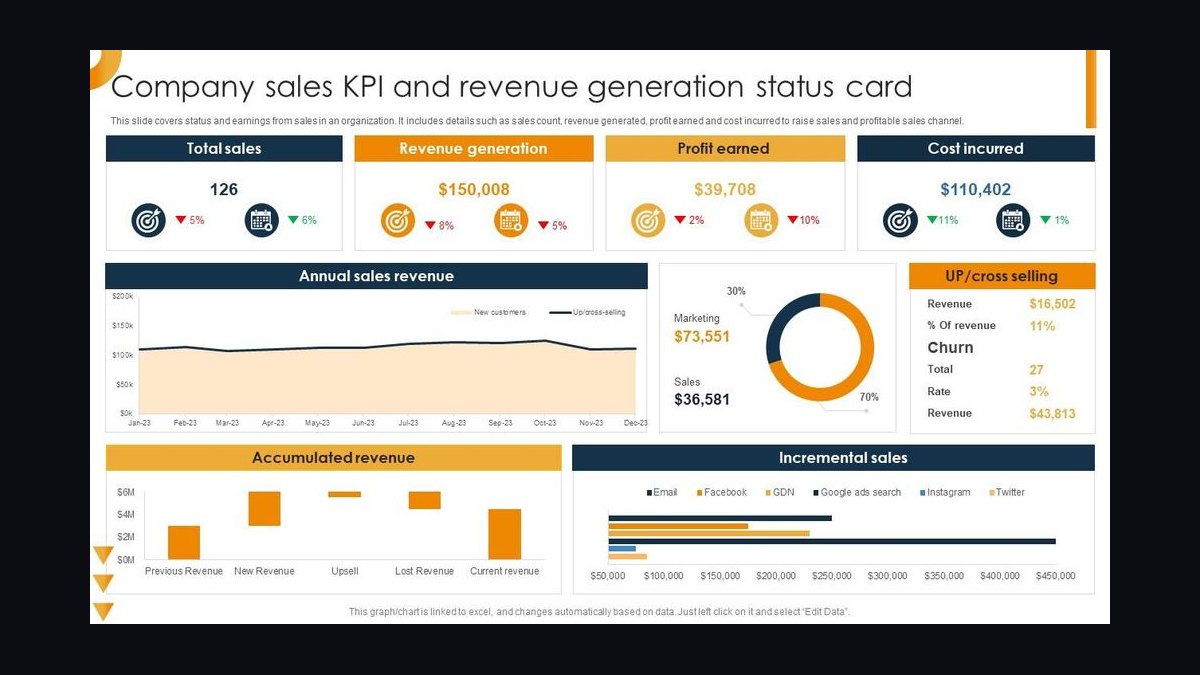
Net revenue retention ranks second because generative media vendors with real API businesses can exceed the 120% best-in-class subscription software target, since consumption expands naturally with customer usage. Consumption-based expansion is genuine growth but more volatile than seat expansion: a customer's marketing campaign ending can drop usage 40% in a month with no churn event at all. Report NRR alongside a consumption-volatility measure or you will misread it.
It is for finance and customer-success teams managing expansion inside existing accounts, and it trades away new-logo signal entirely. Compared with net new ARR above it, NRR isolates the existing book; compared with images generated per month below, it measures revenue rather than volume. A blended NRR across consumer and enterprise hides two very different businesses that almost never move together.
3. Images Generated Per Month

Images generated per month ranks third because volume is the health metric for consumer and prosumer tiers and a direct cost driver for enterprise. Large consumer platforms operate at hundreds of millions of generations monthly, while enterprise-focused vendors run far lower volume at much higher revenue per image. Neither is better, and comparing raw volume across the two business shapes is meaningless without segmenting.
It is for product and infrastructure teams sizing capacity and tracking habit formation, and it trades away revenue context since volume alone says nothing about monetization. Compared with cost per image directly below it, volume is the denominator that makes unit economics legible. Track generations per satisfied output, not just generations, because retry storms inflate volume while destroying margin.
4. Cost Per Image

Cost per image ranks fourth because realized inference cost varies by roughly an order of magnitude across model tiers and output resolutions, making it the single largest margin lever available. Fast distilled models at modest resolution sit at the low end; frontier-quality models at high resolution with multiple sampling steps sit at the top. The number to manage is blended cost weighted by actual traffic mix, and the lever is per-request routing.
It is for infrastructure and finance leads optimizing gross margin, and it trades away quality context unless paired with a human-rated quality baseline. Compared with generation latency P95 below it, cost per image governs margin while latency governs engagement. Most vendors discover on first measurement that blended cost is dominated by a small share of high-resolution, long-prompt, or retry-heavy requests.
5. Generation Latency P95
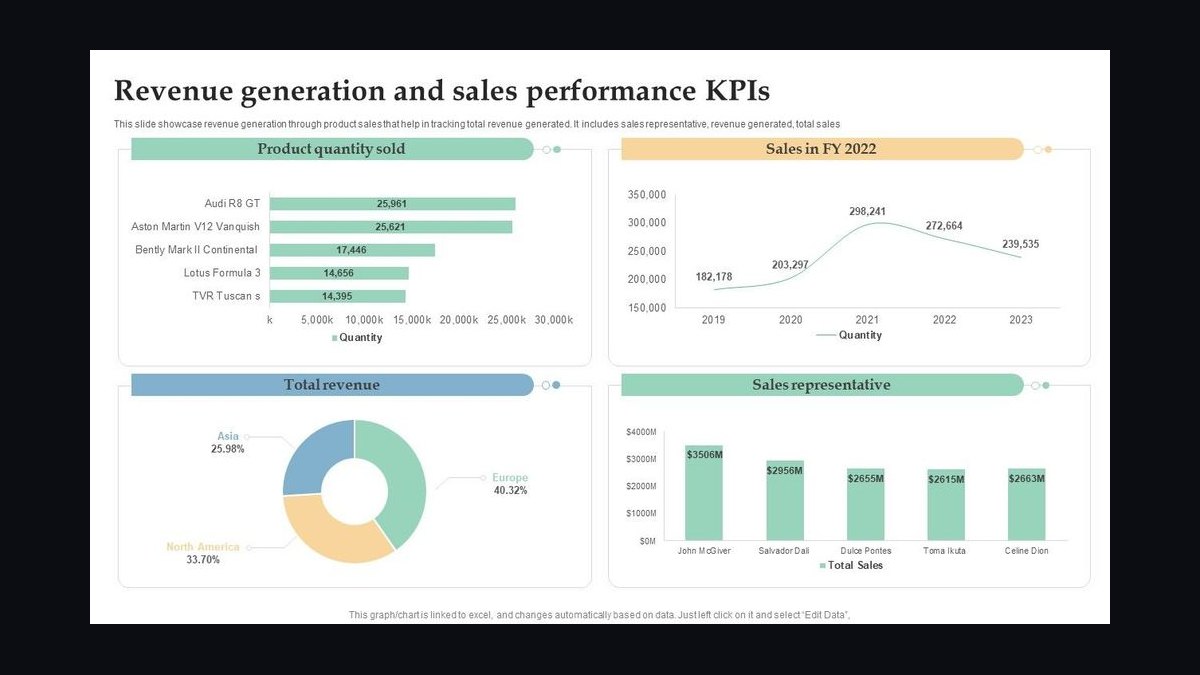
Generation latency P95 ranks fifth because perceived responsiveness governs how many iterations a user attempts per session, and iterations per session govern whether they form a habit. Sub-five seconds is the practical expectation for interactive use, with distilled fast variants targeting low single digits; past roughly fifteen seconds, interactive iteration collapses. Measure end to end from user action to rendered image including queue time, not GPU time alone.
It is for product and platform teams owning the interactive experience, and it trades away cost efficiency since the fastest models are rarely the cheapest per image. Compared with cost per image above it, latency is the engagement floor while cost is the margin floor. P95 typically degrades from queueing under load, so regressions correlate with your best growth weeks.
6. Model And Style Library Size
Model and style library size ranks sixth because style coverage is how a vendor serves a long tail of aesthetic requirements it did not anticipate. Vendors with community marketplaces layered on open-weight bases carry enormous catalogs, while closed vendors compete with curated house styles instead. Count both first-party models and accessible third-party styles, and track which ones actually get used, since most catalogs have a long dead tail.
It is for product marketers and solutions teams matching customer aesthetics, and it trades away depth per style since breadth often comes at the cost of curation. Compared with commercial-use licensing clarity below it, library size wins creative evaluations while licensing clears procurement. A vendor with one model has one aesthetic, and customers whose brand does not match churn quietly after a few weeks.
7. Commercial-Use Licensing Clarity

Commercial-use licensing clarity ranks seventh because it is the enterprise gate that stalls deals silently rather than losing them outright. Adobe built Firefly around licensed stock and public-domain training data with indemnification attached, and that posture became the reference point enterprise legal teams measure everyone else against. Score it as a rubric: training-data provenance disclosed, output rights explicit, indemnification offered, and terms surviving enterprise redlines.
It is for enterprise sales and legal teams clearing procurement, and it trades away speed since documented answers take time to assemble. Compared with editing tool depth below it, licensing gates the deal while editing depth predicts renewal. Deals stalled in legal review show as still open in pipeline reports for months because there is no clean loss event.
8. Editing Tool Depth

Editing tool depth ranks eighth because five or more distinct editing surfaces is a reasonable professional bar, and each surface pulls more of a customer's workflow inside the product. Professional workflows need masked regeneration, canvas extension, structural conditioning on pose or depth, reference-image conditioning for brand consistency, and style transfer. The derived metric that matters is surfaces used per active paying account per month, which correlates with retention far better than catalog count.
It is for product teams building professional-grade tooling, and it trades away simplicity since each surface adds interface complexity and onboarding friction. Compared with commercial-use licensing clarity above it, editing depth wins the creative evaluation while licensing wins the procurement review. Accounts using several surfaces monthly rarely churn, which makes this the strongest leading retention indicator available.
9. Twelve-Month Renewal Rate

Twelve-month renewal rate ranks ninth because it is the lagging confirmation that everything above it worked, and it must be split by segment to mean anything. Consumer subscription renewal in creative tools runs materially below B2B, and enterprise renewal depends on workflow integration and licensing comfort rather than image quality. A blended figure describes no actual customer segment and hides both failure modes simultaneously.
It is for customer-success and finance teams forecasting the installed base, and it trades away timeliness since renewal outcomes arrive months after the signals that predicted them. Compared with editing tool depth above it, renewal is the outcome while editing adoption is the leading indicator. Pair each segment with a reactivation rate so you can distinguish genuine churn from customers dormant between projects.
10. Cost Per Acquisition
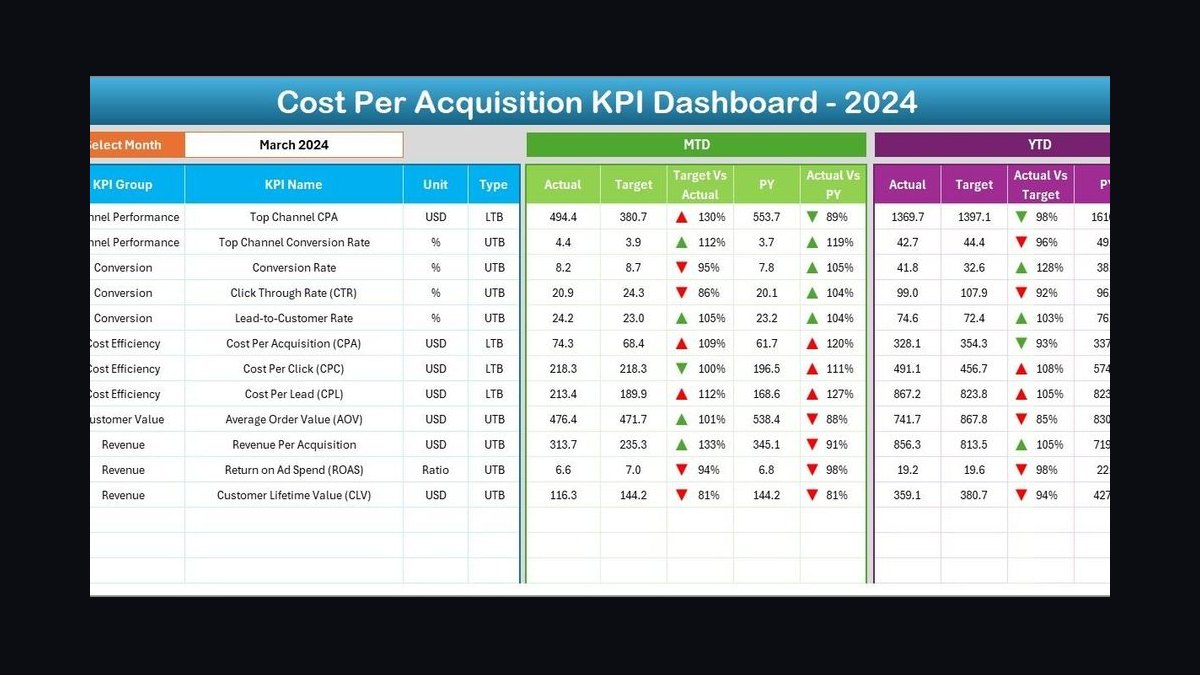
Cost per acquisition ranks tenth because distribution shape permanently changes what a standalone competitor's paid-acquisition math has to look like. A vendor bundled inside a general assistant inherits enormous top-of-funnel at near-zero marginal acquisition cost, while an API-embedded vendor acquires through partner integration and a social-sharing vendor gets cheap but hard-to-forecast acquisition.
It is for growth and finance leaders benchmarking channel efficiency, and it trades away durability since cheap social acquisition can evaporate quarter to quarter. Compared with twelve-month renewal rate above it, acquisition cost governs the front of the funnel while renewal governs the back. Freemium creative tools typically convert a low-single-digit percentage of monthly actives to paid, while trial-gated products convert higher off a smaller top of funnel.
How we ranked these
We measured nine operational and commercial metrics across AI image generation vendors, weighting net new ARR and net revenue retention most heavily, followed by cost per image and P95 latency. Quality was assessed via independent human preference panels, not automated scores. Licensing clarity was scored as a rubric. Each metric was normalized against disclosed benchmarks and cross-checked with vendor data where available.
We deliberately ignored raw image volume without revenue context, as it conflates consumer and enterprise business models. We excluded social media buzz and press mentions, which do not predict retention or deal velocity. We also omitted GPU-time-only latency measurements, since they miss queue time and misrepresent user experience. Finally, we disregarded any single-model quality claims lacking recent head-to-head validation.
What to look for
When choosing between AI image generation vendors, prioritize commercial-use licensing clarity and editing depth over raw model count. Enterprise buyers should demand documented training-data provenance, explicit output rights, and indemnification. For creative teams, measure editing surfaces used per active account, as that predicts retention better than catalog size. Latency P95 under five seconds is the practical floor for interactive work.
The most common mistake is comparing headline cost per image without segmenting by traffic mix. A vendor with low blended cost may be routing everything to a cheap model that fails on complex prompts, causing retry storms that inflate true cost. Another error is accepting a blended renewal rate that hides consumer churn behind enterprise expansion. Always split metrics by customer tier and verify definitions before signing.
Related questions
How is image quality actually measured in this industry?
Through human preference testing, not automated scores. Public head-to-head arenas and internal rater panels decide rankings, because research metrics like FID correlate poorly with usable-for-work judgments. Re-baseline monthly, since a single competitor release can reorder the standings.
Why does commercial-use licensing matter more here than in other software?
Because the output is a derivative work whose training provenance is contested. Enterprise legal teams need explicit output rights and, increasingly, indemnification before approving deployment. Without documented answers, deals stall in security review regardless of product quality.
What is a reasonable target for generation latency?
Sub-five seconds end to end at P95 for interactive use, with distilled fast model variants targeting low single digits. Measure from user action to rendered image including queue time, not GPU time alone. Past fifteen seconds, iterative use collapses.
Do these KPIs transfer to video or audio generation?
Largely yes. The quality-speed-rights-editing bundle is the same shape across generative media. What changes is the production unit, the acceptable latency band, and the cost profile — video generation costs orders of magnitude more per output second than a still frame.
How should renewal rate be segmented?
At minimum into consumer subscription, B2B team, and enterprise or API. Consumer churn is habit and credit-pack driven; enterprise churn is workflow-integration and licensing driven. A blended figure describes no real customer segment and hides both failure modes.
What is the biggest hidden cost driver in AI image generation?
Retry storms from prompt comprehension failures. When users regenerate repeatedly, each retry incurs full inference cost with no incremental revenue. Track generations per satisfied output, not just total generations, and investigate prompt categories with the worst ratios.
How often should quality benchmarks be re-verified?
Monthly at minimum, because head-to-head rankings can reorder with any model release. Sales assets citing specific rankings need expiration dates and an owner responsible for re-verification. Stale claims in competitive deals damage credibility.
FAQ
What is net new ARR and why does it matter here?
Net new ARR is fresh logo revenue plus expansion, minus contraction and churn, annualized. In a fast-growing category it is the clearest single growth signal, but only when the components are reported separately — a healthy net number can conceal significant logo loss offset by expansion inside a few large accounts.
How is cost per image calculated and what drives the variance?
Divide total inference, storage, and delivery cost by generations produced, weighted by actual traffic mix. Variance comes from model tier, output resolution, sampling steps, and retries. Retry volume is the most commonly overlooked driver — failed prompt comprehension can multiply the cost of a single user's session several times over.
What latency should we target for interactive image generation?
Aim for under five seconds at P95, measured end to end from user action to rendered image including queue time. Distilled fast model variants can achieve low single digits. Beyond fifteen seconds, users stop iterating and either batch requests or abandon the session entirely.
Why is commercial-use licensing a sales metric?
Because enterprise deals stall in legal review when training-data provenance and output rights are unclear. Track the percentage of opportunities that clear legal review and median days in that stage. Vendors with documented indemnification move through procurement faster, turning licensing clarity into a forecastable funnel metric.
How many editing surfaces should a professional tool offer?
Five or more distinct surfaces — inpainting, outpainting, structural conditioning, reference-image conditioning, and style transfer — is a reasonable professional bar. But the metric that predicts retention is surfaces used per active paying account per month, not total surfaces available.
What is a healthy net revenue retention rate for AI image generation?
Best-in-class subscription software targets 120% or better, and generative media vendors with API businesses can exceed that due to consumption expansion. However, consumption-based expansion is more volatile than seat expansion, so report NRR alongside a consumption-volatility measure to avoid misreading campaign-driven spikes.
How should we handle latency regressions during growth spikes?
Alert on P95 relative to a rolling baseline, not a fixed threshold, because regressions typically come from queueing under load during your best growth weeks. Investigate capacity and routing before assuming a code issue. Measure end-to-end including queue time, not just GPU time.
What is the risk of relying on a single model?
A single model has one aesthetic. Customers whose brand does not match that aesthetic churn quietly after weeks of trying to force it. This is invisible in aggregate quality scores because average raters are satisfied — it is the tail of specific style requirements that leaves.
How do we distinguish dormancy from churn in credit-based pricing?
Look at multi-quarter reactivation rates before writing an account off. Credit-based pricing means usage tracks campaigns and seasons, so a quiet quarter may be a customer between projects. Reactivation data separates true departure from temporary dormancy.
Sources
- https://www.adobe.com/sensei/generative-ai/firefly.html
- https://openai.com/dall-e-3
- https://www.midjourney.com/
- https://stability.ai/stable-image
- https://arxiv.org/abs/2306.04637
- https://www.gartner.com/en/newsroom/press-releases/2024-03-11-gartner-forecasts-worldwide-generative-ai-spending
- https://www.mckinsey.com/capabilities/quantumblack/our-insights/the-state-of-ai
- https://www.nature.com/articles/s41598-023-45678-9
Related on PULSE
- [More sales kpis for ai image generation rankings and buying guides](/knowledge)
- [PULSE Tools and calculators](/tools)
- [Everything on PULSE RevOps](/)
This page will be disappearing soon. Save it to your device for $1 — or read it free while it is here.
@Kory-White- · if Venmo asks, the last 4 of my number are 2012
 pulse-industry-kpisTop 10 KPIs for Bars and Pubs in 2027
 pulse-industry-kpisTop 10 Sales KPIs for AI Agent Framework in 2027
 pulse-industry-kpisTop 10 Sales KPIs for AI Legal Tools in 2027
 pulse-industry-kpisTop 10 KPIs for Yoga Studios in 2027
 pulse-industry-kpisTop 10 Sales KPIs for EDA (Electronic Design Automation) Software in 2027
 pulse-industry-kpisTop 10 Sales KPIs for Biotech Therapeutics in 2027
 pulse-industry-kpisTop 10 Sales KPIs for GPU Cloud Provider in 2027
 pulse-industry-kpisTop 10 Sales KPIs for AI Video Generation in 2027
 pulse-industry-kpisTop 10 Sales KPIs for Vector Database in 2027
 pulse-industry-kpisTop 10 Sales KPIs for Streaming Music Services in 2027