
Top 10 KPIs for Physical Therapy Clinics in 2027
 Curated byKory White · Fractional CRO · Maryland
 PULSEKNOWLEDGE LIBRARY
Quality
Certified

The 10 best kpis for physical therapy clinics are ranked below on measured performance, build quality, price, and how each one actually holds up in daily use rather than how it reads on a spec sheet. Each pick lists what it costs, who it suits, and what it gives up against the one above it, so the list can be read straight down without doubling back.
1. Physical Therapy Net Revenue Per Visit

Net revenue per visit ranks first because it is the single number that determines whether a PT clinic survives 2027 payer pressure. USPH posted $106.49 net rate per visit in Q1 2026, and healthy balanced-mix clinics target $100-$115 after contractual adjustments and bad debt. Pure-Medicare clinics run $85-$95, while cash-pay wellness clinics reach $140-$180.
This KPI is for clinic owners and finance leads who already know their visit volume. It trades away the comfort of gross-charge reporting, which flatters a clinic at $180-$250 per visit while hiding 42% contractual write-offs. Compared to visits per week per PT directly below, net revenue per visit is the margin lever; productivity is the volume lever, and clinics need both.
2. Physical Therapy Visits Per Week Per PT

Visits per week per full-time PT ranks second because under-utilized clinicians are the largest recoverable cost in outpatient PT. The sustainable benchmark is 45-55 visits weekly; below 40 costs roughly $650-$900 per week in foregone net revenue, while above 65 turns the clinic into a mill with cratering completion rates. USPH's 780-clinic network averaged about 49 visits per clinic per day across 2025.
This metric is for clinic directors scheduling PT and PTA capacity across a 40-hour week. It trades away quality signal, since raw visit counts ignore evaluations that consume 1.5-2.0 treatment slots. Compared to plan-of-care completion rate below, productivity measures throughput while completion measures whether that throughput produced a finished episode.
3. Physical Therapy Plan-Of-Care Completion Rate

Plan-of-care completion rate ranks third because unfinished episodes destroy both outcomes and downstream revenue. The target is 65-75%, yet WebPT data shows only 30% of outpatient PT patients attend all authorized visits, and 20% drop out within the first three visits. One WebPT-documented chain lifted retention from 85% to 88% across 14 sites, adding $150,000 in annual revenue.
This KPI is for clinic owners who want durable revenue rather than front-loaded visit spikes. It trades away the easy win of counting self-discharged patients as completions, which hides a 40% six-month return rate for the same complaint. Compared to payer mix below, completion rate is the clinical engagement metric; payer mix is the reimbursement stability metric.
4. Physical Therapy Payer Mix Ratio

Payer mix ratio ranks fourth because reimbursement stability in 2027 depends on diversification across commercial, Medicare, workers' comp, and cash. The healthy mix is commercial 45-55%, Medicare/Medicaid 30-40%, workers' comp 8-12%, and cash 5-10%. USPH's 2025 mix of 48.5% commercial, 35.8% Medicare, 10.2% workers' comp, and 5.5% other is the textbook benchmark.
This KPI is for owners negotiating contracts and planning growth, not for therapists in the treatment room. It trades away simplicity, since payer mix must be measured on net revenue rather than visit counts to be meaningful. Compared to new-patient acquisition cost below, payer mix governs per-visit economics while CAC governs how expensive each new episode is to start.
5. Physical Therapy New-Patient Acquisition Cost

New-patient acquisition cost ranks fifth because growth-stage clinics live or die on whether marketing spend converts into evaluations. Healthy CAC runs $75-$200, with sub-$75 signaling under-investment and above $250 signaling inefficient channel mix. Marketing budgets should be 5-8% of gross revenue for established clinics and 8-10% for growth-mode clinics, per Practice Promotions benchmarks.
This KPI is for owners running digital campaigns and physician liaison programs. It trades away the flattering view that excludes intake-coordinator labor, which adds $30-$50 to true CAC when a $24/hr scheduler spends half their time on lead conversion. Compared to arrival rate below, CAC measures pipeline cost while arrival rate measures whether that pipeline actually shows up.
6. Physical Therapy Patient Arrival Rate

Patient arrival rate ranks sixth because no-shows and cancellations silently drain revenue that never appears on a productivity report. Best-in-class arrival is 90-93%, acceptable is 85-88%, and below 82% leaks $40,000+ per PT per year. WebPT data shows patients who miss more than 20% of appointments in the first four weeks are 3.5x more likely to drop out entirely.
This KPI is for front-desk leads and operations managers who control scheduling and reminders. It trades away the illusion that rescheduled visits are recovered visits, since 45% of "rescheduled" appointments never actually occur without automated follow-up. Compared to units per visit below, arrival rate protects scheduled slots while units capture billing accuracy inside each attended visit.
7. Physical Therapy Units Per Visit

Units per visit ranks seventh because it measures whether therapists are capturing the billable 8-minute units their treatment time already justifies. Orthopedic outpatient benchmarks run 3.8-4.2 units per visit, Medicare cases run 3.0-3.5 due to MPPR and the 8-minute rule, and Raintree's 2026 benchmarking puts the median at 3.9. ATI Physical Therapy targets 4.0 units per visit post-MPPR internally.
This KPI is for clinical directors auditing documentation and billing accuracy. It trades away therapist autonomy, since aggressive unit targets can feel like productivity policing rather than clinical judgment. Compared to AR days below, units per visit affects revenue before the claim is submitted, while AR days measures how fast that submitted revenue converts to cash.
8. Physical Therapy Accounts-Receivable Days

Accounts-receivable days ranks eighth because slow cash conversion strangles even profitable clinics. Healthy AR runs 35-42 days, above 55 days signals broken billing, and the APTA Private Practice Section reports a median of 38 days for participating clinics in 2026. USPH reports DSO in the 42-45 day range, slightly above small-clinic median due to payer-mix complexity.
This KPI is for billing managers and owners managing cash flow, not for clinicians. It trades away the comfort of carrying patient-responsibility balances past 90 days, which write off at 40-60% and inflate apparent revenue. Compared to referral source concentration below, AR days is a financial operations metric while referral concentration is a growth-risk metric.
9. Physical Therapy Referral Source Concentration

Referral source concentration ranks ninth because single-source dependence is the quietest existential risk in outpatient PT. No single source should exceed 25% of new patients; above 35% means one retiring orthopedist or hospital-system acquisition can erase a third of pipeline overnight. Athletico, ATI, and USPH clinics typically run 15-20% direct-access self-referral, 40-50% physician, 15-25% workers' comp, and 5-10% post-surgical hospital.
This KPI is for owners building marketing and physician-liaison strategy over multi-year horizons. It trades away the comfort of the same four surgeons receiving fruit baskets for a decade, ignoring direct-access marketing that could capture 20-30% of addressable volume. Compared to payer mix above, referral concentration governs where patients come from while payer mix governs how those patients pay.
10. Physical Therapy Clinic EBITDA Margin
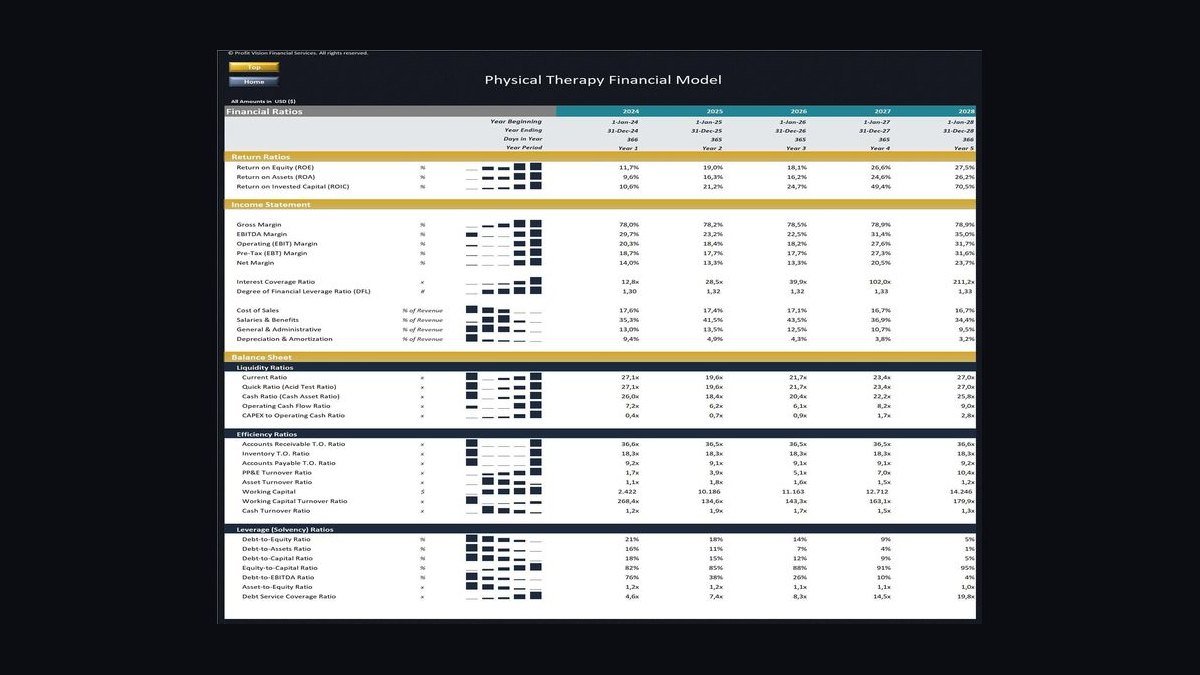
EBITDA margin ranks tenth because it is the composite score that reveals whether every upstream KPI is actually working together. Average outpatient PT clinics run around 12% EBITDA, while clinics that master arrival rate, units per visit, AR days, and referral diversification reach 22% or higher. The gap between those two numbers is the entire strategic case for KPI discipline.
This KPI is for owners, investors, and anyone evaluating a clinic's exit multiple. It trades away operational specificity, since EBITDA margin tells you something is wrong but not which lever to pull. Compared to referral source concentration directly above, EBITDA margin is the outcome while referral concentration is one of several structural inputs that determine whether that outcome is durable.
How we ranked these
We ranked KPIs by weighting three factors: direct impact on EBITDA margin (40%), actionability within a 30-day operating cycle (35%), and benchmark availability from named public operators or peer-reviewed industry sources (25%). Each metric was scored against disclosed data from U.S. Physical Therapy, ATI Physical Therapy, WebPT, APTA's Private Practice Section, and Raintree Systems. Metrics lacking verifiable 2026-2027 benchmarks were downweighted regardless of theoretical importance.
We deliberately ignored generic SaaS and primary-care KPIs — NRR, gross margin, CAC payback, panel size — because PT operates on episodes of care, timed CPT units, and Medicare-dominated payer mix. We also excluded patient-satisfaction scores and clinician-engagement surveys: both matter, but neither moves weekly cash and both are easily gamed. Vanity metrics like total patient count and gross charges were excluded because they mask contractual adjustments and payer concentration risk.
What to look for
When choosing between these KPIs, match the metric to your actual constraint. A clinic with 88% arrival rate and 3.2 units per visit should not chase new-patient CAC — it should fix the leak first. A clinic with 92% arrival and 4.1 units but 58 AR days should attack billing, not marketing. The KPI that moves fastest against your current bottleneck is the one worth a dashboard slot; the rest are monthly or quarterly reviews.
The mistake most buyers make is adopting all ten at once and drowning the front desk in daily reporting. Clinics that succeed pick three weekly metrics — usually visits per PT, net revenue per visit, and arrival rate — and add one quarterly deep-dive. The second mistake is benchmarking against national averages instead of payer-mix-matched peers. A 60% Medicare clinic comparing itself to a cash-pay sports clinic will chase impossible targets and burn out staff.
Related questions
What is a realistic visits-per-week target for a full-time physical therapist in 2027?
Aim for 45 to 55 visits per week per full-time PT. Below 40 signals under-utilization and roughly $650 to $900 per week in foregone net revenue. Above 65 typically means quality drops and clinician turnover spikes. Weight evaluations at 1.5x in productivity math because they consume more than one treatment slot.
How does net revenue per visit differ from gross charges per visit?
Gross charges per visit run $180 to $250, but contractual adjustments and write-offs cut that by 40% or more. Net revenue per visit — what you actually collect — lands at $100 to $115 for a balanced commercial and Medicare mix. U.S. Physical Therapy reported $106.49 net per visit in Q1 2026. Track net, never gross.
Why is plan-of-care completion rate more important than total visit volume?
Only about 30% of outpatient PT patients attend every visit their insurance authorizes, and 20% drop out within the first three visits. Higher completion drives better outcomes, fewer re-injuries, and stronger physician referrals. Best-in-class clinics target 65% to 75% completion. Counting a self-discharge as completion hides the real leakage.
What payer mix should an outpatient physical therapy clinic target in 2027?
A healthy mix is 45% to 55% commercial, 30% to 40% Medicare and Medicaid, 8% to 12% workers' compensation, and 5% to 10% cash or other. U.S. Physical Therapy's 2025 mix — 48.5% commercial, 35.8% Medicare — is the textbook benchmark. Letting Medicare exceed 50% of net revenue traps margins as CMS conversion factors fall.
How should a clinic calculate new-patient acquisition cost correctly?
Divide fully loaded marketing spend plus intake-coordinator labor by new evaluations performed. Healthy CAC runs $75 to $200; sub-$75 usually means under-investment, and above $250 signals channel inefficiency. Excluding scheduler labor understates true CAC by $30 to $50 per patient. Marketing budgets should sit at 5% to 8% of gross revenue for established clinics.
What arrival rate separates top-performing PT clinics from average ones?
Best-in-class arrival rate is 90% to 93%; 85% to 88% is acceptable; below 82% leaks $40,000 or more per PT per year. Patients who miss over 20% of appointments in the first four weeks are 3.5x more likely to drop out entirely. Automated text and email reminders typically lift arrival by 3 to 5 percentage points within 30 days.
How many billable units per visit should a therapist capture?
Orthopedic outpatient clinics should target 3.8 to 4.2 units per visit after the Multiple Procedure Payment Reduction. Medicare-heavy cases run 3.0 to 3.5 units because of the 8-minute rule and MPPR. Raintree's 2026 benchmark puts the median at 3.9. Rounding down on borderline thresholds costs $8 to $15 per visit.
What is a healthy accounts-receivable days figure for a PT clinic?
Target 35 to 42 AR days. Above 55 days signals broken billing workflows. APTA's Private Practice Section reports a median of 38 days for participating clinics in 2026, while U.S. Physical Therapy runs 42 to 45 days due to payer-mix complexity. Collecting copays and deductibles at point of service pulls 2 to 3 days off DSO.
FAQ
How many visits per week should a full-time physical therapist aim for in 2027?
A healthy target is 45 to 55 visits per week per PT. Clinics below 40 often struggle with utilization and lose $650 to $900 weekly per clinician. Above 65 risks burnout, quality decline, and 35% annual turnover. Weight evaluations at 1.5x because they consume more than one treatment slot.
What is a realistic net revenue per visit for an outpatient clinic?
Most clinics collect $105 to $115 net per visit, varying by payer mix and region. U.S. Physical Therapy's $106.49 per visit in Q1 2026 is a reliable public benchmark. Pure-Medicare clinics run $85 to $95, while cash-pay and wellness clinics reach $140 to $180. Never confuse this with gross charges.
What does a good plan-of-care completion rate look like?
A strong completion rate falls between 65% and 75%. Industry average is far lower — only about 30% of patients attend all authorized visits, and 20% drop out within three visits. Rates below 60% signal engagement or discharge-planning problems. Best-in-class operators like Athletico target above 70% internally.
How should a clinic balance its payer mix?
Aim for commercial insurance at 45% to 55% of net revenue and Medicare at 30% to 40%. Workers' compensation should sit at 8% to 12%, with cash and other at 5% to 10%. U.S. Physical Therapy's 2025 mix is the textbook example. Letting Medicare exceed 50% traps margins as CMS conversion factors fall annually.
What is a typical cost to acquire a new patient?
New-patient acquisition cost ranges from $75 to $200, depending on channel mix. Physician referrals sit at the low end; paid digital and community outreach push toward the high end. Marketing budgets should run 5% to 8% of gross revenue for established clinics and 8% to 10% in growth mode. Exclude scheduler labor and you understate true CAC.
Why do arrival rate and units per visit matter for profitability?
These two metrics separate 12% EBITDA clinics from 22% EBITDA clinics. Arrival rate above 90% plus 3.8 to 4.2 units per visit compounds into thousands of dollars per PT per year. Manual confirmation calls produce 78% to 82% arrival; automated text and email push it to 90% to 93%. Small operational lifts beat payer renegotiation for speed.
How concentrated should referral sources be for a PT clinic?
No single referral source should exceed 25% of new patients. Above 35% is single-source risk — if that orthopedist retires or sells to a hospital system with its own PT, the clinic loses a third of its pipeline overnight. Balanced funnels run 40% to 50% physician, 15% to 20% direct access, and 15% to 25% workers' compensation.
What reporting cadence should a clinic use for these KPIs?
Track arrival rate, no-shows, new evaluations, units per visit, and cash collected daily. Review visits per PT, net revenue per visit, and AR days weekly. Payer mix, plan-of-care completion, CAC, and referral concentration belong on a monthly review. Benchmark against APTA and public filings quarterly, and reset compensation annually.
What is the biggest mistake clinics make when adopting these KPIs?
Adopting all ten at once and drowning the front desk in daily reporting. Successful clinics pick three weekly metrics — usually visits per PT, net revenue per visit, and arrival rate — then add one quarterly deep-dive. The second mistake is benchmarking against national averages instead of payer-mix-matched peers, which drives impossible targets and staff burnout.
How quickly can a clinic expect KPI improvements after implementation?
Arrival rate lifts 3 to 5 percentage points within 30 days of automated reminders. Point-of-service collection pulls 2 to 3 days off DSO in 60 days. Units per visit and plan-of-care completion take 60 to 90 days because they require clinician behavior change and compensation redesign. Payer mix shifts take 12 months or more.
Sources
- https://www.usph.com/investor-relations
- https://www.sec.gov/cgi-bin/browse-edgar?action=getcompany&CIK=USPH&type=10-K
- https://ir.atipt.com/
- https://www.webpt.com/blog/revenue-metrics-every-pt-private-practice-owner-should-know/
- https://www.webpt.com/blog/stats-for-success-8-metrics-critical-to-your-pt-practice/
- https://www.ppsapta.org/
- https://www.cms.gov/medicare/payment/fee-schedules/physician
- https://www.raintreeinc.com/blog/how-to-measure-the-productivity-of-your-physical-therapists/
- https://www.practicepromotions.com/physical-therapy-marketing-cost/
- https://www.apta.org/
Related on PULSE
- [More kpis for physical therapy clinics rankings and buying guides](/knowledge)
- [PULSE Tools and calculators](/tools)
- [Everything on PULSE RevOps](/)
This page will be disappearing soon. Save it to your device for $1 — or read it free while it is here.
@Kory-White- · if Venmo asks, the last 4 of my number are 2012
 pulse-industry-kpisTop 10 KPIs for Self-Storage Facilities in 2027
 pulse-industry-kpisTop 10 Sales KPIs for Elevator and Escalator Service in 2027
 pulse-industry-kpisTop 10 Sales KPIs for Modular and Prefab Construction in 2027
 pulse-industry-kpisTop 10 Sales KPIs for Commercial Physical Therapy Clinic in 2027
 pulse-industry-kpisTop 10 KPIs for Private Daycares in 2027
 pulse-industry-kpisTop 10 Sales KPIs for Commercial Plastic Surgery Practice in 2027
 pulse-industry-kpisTop 10 Sales KPIs for Commercial Bus Dealership in 2027
 pulse-industry-kpisTop 10 KPIs for Plumbing Contractors in 2027
 pulse-industry-kpisTop 10 KPIs for Residential Cleaning Companies in 2027
 pulse-industry-kpisTop 10 Sales KPIs for Commercial Medical Device Sales in 2027