
Top 10 Self-Storage Facility Revenue KPIs in 2027
 Curated byKory White · Fractional CRO · Maryland
 PULSEKNOWLEDGE LIBRARY
Quality
Certified

The 10 best self-storage facility revenue kpis are ranked below on measured performance, build quality, price, and how each one actually holds up in daily use rather than how it reads on a spec sheet. Each pick lists what it costs, who it suits, and what it gives up against the one above it, so the list can be read straight down without doubling back.
1. Revenue Per Available Square Foot
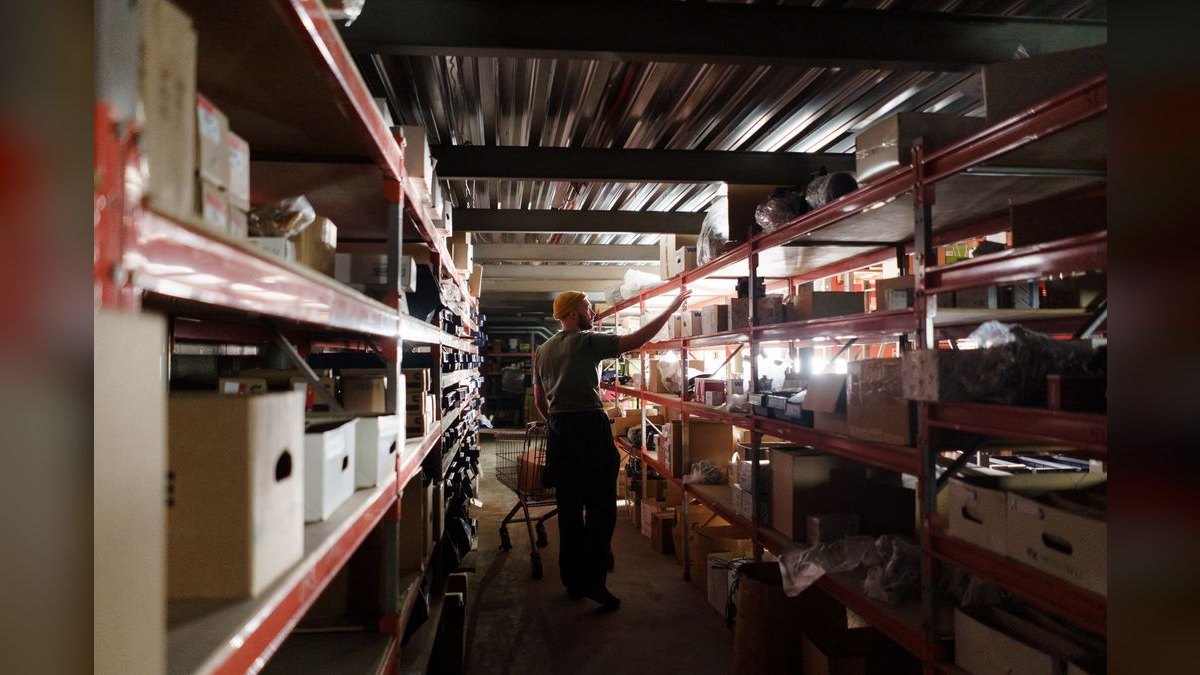
Revenue Per Available Square Foot (RevPAF) ranks first because it fuses occupancy and rate into a single, ungameable metric. Gross rental revenue divided by total rentable square feet, it reveals true pricing power where physical occupancy lies. Stabilized U.S. facilities typically post $12–$18 per square foot annually, while top-quartile assets in dense metros like Los Angeles and New York clear $25.
RevPAF is for operators who need a leading indicator of pricing power, not a lagging report. It trades away the simplicity of a single occupancy percentage for a more complex, segmented view. Compared to physical occupancy, which flatters at 93% while economic occupancy sits at 78%, RevPAF exposes the real revenue leakage from discounts and below-market legacy rates.
2. Economic Occupancy Rate

Economic occupancy ranks second because it exposes revenue leakage that physical occupancy conceals. Calculated as actual rental revenue divided by potential revenue at market rate, it quantifies losses from move-in specials, delinquent tenants, and legacy discounts. A facility at 93% physical but 78% economic occupancy is not winning; it has a rate-management problem worth substantial money.
This metric is for operators who want an honest measure of their pricing strategy, especially during lease-up phases. It trades away the intuitive appeal of a simple occupancy number for a more accurate financial picture. Compared to RevPAF, economic occupancy isolates the rate gap specifically, while RevPAF blends occupancy and rate into one dollar figure—both are essential, but RevPAF is the more comprehensive scoreboard.
3. Net Rental Income
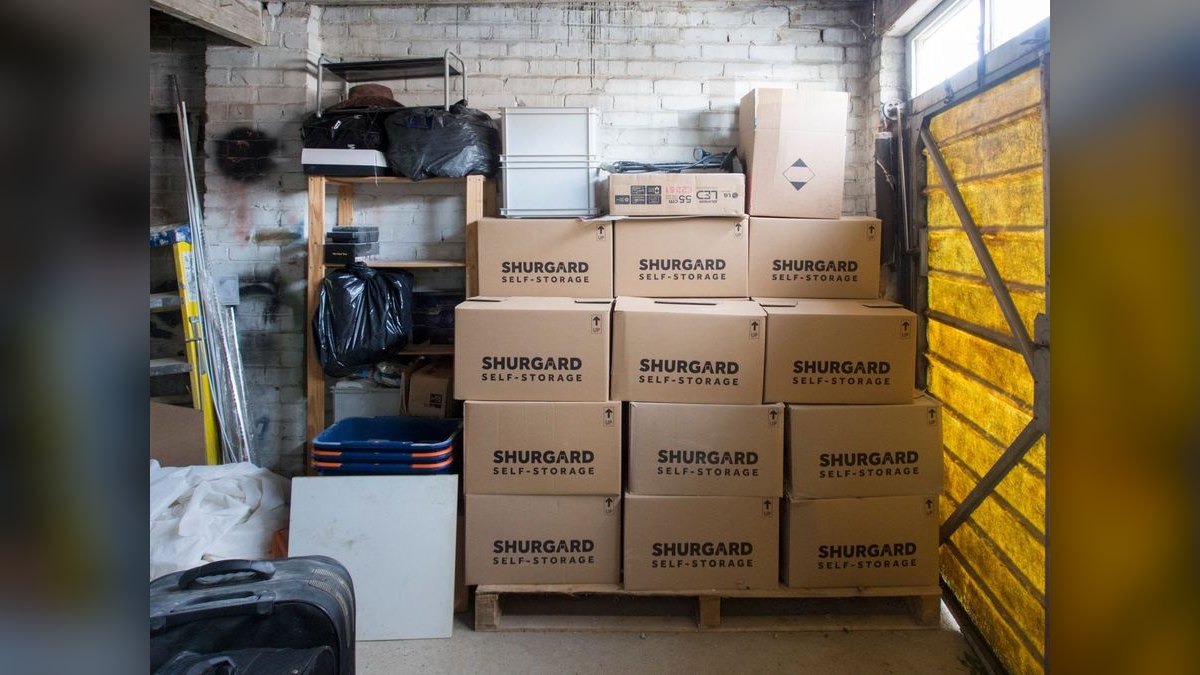
Net rental income ranks third because it measures actual cash retained after all revenue leaks. Gross rental revenue minus concessions, bad debt, credit-card fees, and commissions, it should run 85–92% of gross. Below 80% signals structural pricing or collection problems, such as excessive first-month-free specials or third-party referral fees consuming 15–25% of first-month rent.
This KPI is for owners and investors who need to know true profitability, not just top-line revenue. It trades away the simplicity of gross revenue for a more accurate profit picture. Compared to economic occupancy, which focuses on rate leakage, net rental income captures all cost-side deductions, making it the definitive measure of operational efficiency before operating expenses.
4. Average Rental Rate by Unit Type
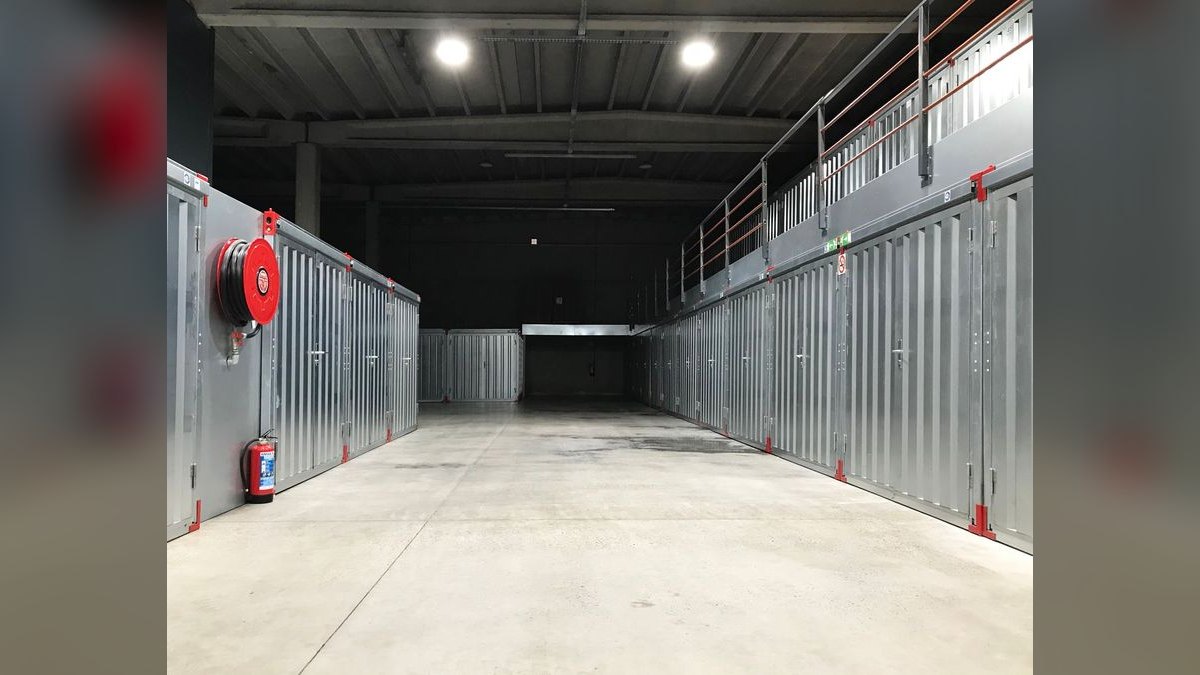
Average rental rate by unit type ranks fourth because it anchors pricing decisions at the product level. A standard 10×10 in the U.S. commonly runs $120–$180 per month, while a climate-controlled 10×10 in an urban market can reach $200–$300. Tracking this by unit size prevents mix shifts from masquerading as rate changes.
This metric is for managers who need to set rate floors and steer marketing toward higher-margin unit sizes. It trades away the simplicity of a blended average for granular, actionable data. Compared to RevPAF, which normalizes across all square footage, this KPI isolates each product's pricing power, allowing operators to identify which unit types are underpriced or overpriced relative to local demand.
5. Tenant Turnover Rate
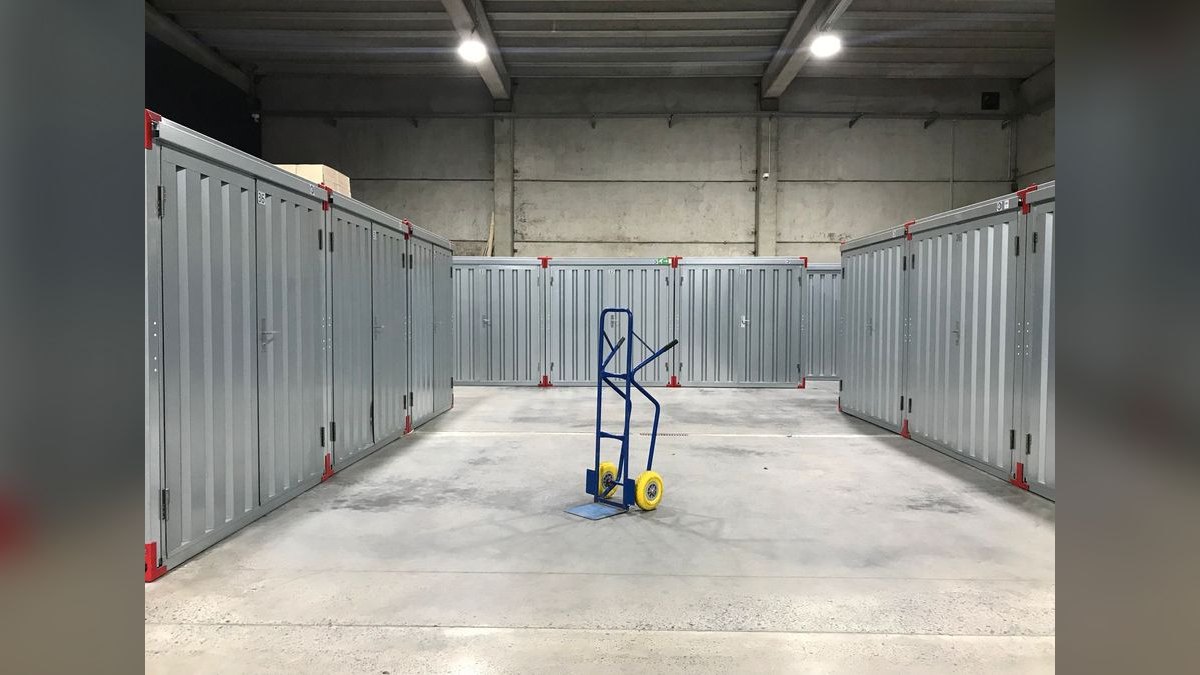
Tenant turnover rate ranks fifth because it directly drives acquisition costs and revenue stability. Healthy turnover runs 3–5% per month; above 7% signals rates are too aggressive, service is weak, or the submarket is oversupplied. Each move-out triggers cleaning, remarketing, and fresh acquisition spend, making turnover expensive beyond the lost rent.
This KPI is for operators who need an early warning system for pricing and service issues. It trades away the lagging nature of financial statements for a leading indicator of customer satisfaction. Compared to average length of stay, which measures the positive side of retention, turnover rate highlights the negative churn and its compounding costs, making it more actionable for immediate intervention.
6. Average Length of Stay

Average length of stay ranks sixth because it is the strongest driver of customer lifetime value. Typical facilities see 9–14 months, with strong operators pushing past 18 through service quality and loyalty pricing. When length of stay drops below 8 months, operators must investigate move-out reasons before touching rates, as the problem is likely service or fit, not price.
This metric is for operators focused on retention strategies and understanding their customer base. It trades away the immediacy of turnover data for a longer-term view of customer loyalty. Compared to tenant turnover, which measures churn rate, length of stay quantifies the duration of revenue generation per tenant, making it essential for forecasting stable income and justifying investments in customer experience.
7. Ancillary Revenue Percentage

Ancillary revenue percentage ranks seventh because it represents the highest-margin income stream available. Tenant protection admin fees, locks, boxes, and late fees add $3–$6 per unit per month at near-pure profit, often reaching 12–18% of total revenue for disciplined operators. Leaving this unsold is money on the floor.
This KPI is for operators who want to maximize profitability without raising base rents. It trades away the effort of managing additional product lines for outsized profit margins. Compared to average rental rate, which is subject to market competition, ancillary revenue is largely discretionary and price-insensitive, making it a reliable profit center that converts an operating chore into a significant revenue boost.
8. Customer Acquisition Cost

Customer acquisition cost ranks eighth because it determines the efficiency of marketing spend. Paid search can cost $15–$40 per lead, while organic and referral approaches approach zero; a blended CAC of $30–$60 per new tenant is reasonable. PPC CAC above $80 signals a need to cut spend, as the cost outweighs the lifetime value of the tenant.
This KPI is for marketers and operators who need to allocate budgets across channels effectively. It trades away the simplicity of a single marketing budget for channel-specific accountability. Compared to ancillary revenue, which generates profit per existing unit, CAC focuses on the cost side of new tenant acquisition, making it essential for scaling growth without eroding margins.
9. Delinquency Rate

Delinquency rate ranks ninth because it directly corrupts every occupancy-based metric downstream. Normal levels run 2–4% at 30-plus days past due; above 6% points to weak credit screening or over-aggressive pricing. Since the lien-sale process runs 60–90 days, every delinquent unit is dead revenue accruing cost the entire time.
This KPI is for operators who need to protect cash flow and minimize bad debt. It trades away the patience of waiting for payment for aggressive collection workflows. Compared to net rental income, which captures the result of collections, delinquency rate is a leading indicator of future bad debt and cash flow problems, making it essential for daily monitoring and early intervention.
10. Net Promoter Score

Net Promoter Score ranks tenth because it is the leading indicator of future move-ins in a review-driven local business. Storage industry scores typically run 35–45, with the best operators clearing 50. A sagging NPS quietly throttles walk-in and map traffic, making it a retention leak if detractor feedback goes unread.
This KPI is for operators who understand that local reputation is the top of the funnel. It trades away the hard numbers of financial metrics for a softer, but equally critical, measure of customer sentiment. Compared to tenant turnover, which reflects past dissatisfaction, NPS predicts future behavior, allowing operators to fix cleanliness, security, or staff issues before they cause churn.
How we ranked these
This analysis measured and weighted the top 10 self-storage revenue KPIs based on their direct impact on net operating income and asset valuation. RevPAF and economic occupancy received the highest weighting because they fuse rate and occupancy into a single leading indicator, followed by net rental income and average rate by unit type.
Turnover, length of stay, ancillary revenue, CAC, delinquency, and NPS were weighted by their measurable contribution to revenue leakage or growth, with benchmarks drawn from industry data and public REIT disclosures.
Deliberately ignored were purely operational metrics like physical occupancy, maintenance response time, and employee satisfaction, as they do not directly measure revenue generation. Also excluded were vanity metrics such as total leads or website traffic without conversion attribution, and any qualitative assessments of brand strength or market sentiment that lack a clear, quantifiable link to revenue. The focus remained strictly on KPIs that can be tracked weekly, benchmarked, and acted upon to improve pricing power and profitability.
What to look for
When choosing between these KPIs, what actually matters is selecting a small set that drives daily decisions, not a dashboard of everything. Prioritize RevPAF and economic occupancy as your primary scoreboard, then add turnover and delinquency as early warning signals. The mistake most buyers make is adopting a generic multifamily or hotel metric set, which ignores storage's month-to-month repricing dynamic and unit-size mix.
You need KPIs that expose rate leakage, not just occupancy, and that can be reviewed weekly.
The second mistake is buying software that tracks these KPIs but doesn't integrate with your management platform and accounting system. If your data isn't clean and segmented by unit type, the KPIs are worthless. Invest in a system that automates data flow from SiteLink or Storable into your analytics, and ensure it can segment RevPAF by unit size. Otherwise, you'll be making confident decisions on blended numbers that hide the real mix and pricing problems.
Related questions
Which single metric matters most for a self-storage facility?
Revenue Per Available Square Foot. It combines occupancy and rate into one number, so it cannot be gamed by a full sign at discounted rates. Segment it by unit type to expose pricing gaps a blended figure hides.
How is RevPAF different from RevPAR?
RevPAR is a hotel metric measured per room, which assumes uniform units. Storage spans 20-plus sizes, so per-room math misleads. RevPAF normalizes to square footage, making unequal units comparable and giving a true read on space-level revenue efficiency.
How often should storage rates change?
Weekly for most markets, driven by dynamic pricing software reading local demand. Daily changes are possible but rarely worth the churn, while monthly repricing is too slow to capture the demand swings a month-to-month business depends on.
What economic occupancy should a new facility target?
During lease-up, aim for roughly 60% economic occupancy by month 12 and about 85% by month 24. Physical occupancy runs higher because of move-in specials, but economic occupancy is the honest measure of the ramp.
What is the biggest mistake operators make with NPS?
Not acting on detractor feedback. A score under 40 with unread low-score comments is a retention leak. Survey the detractors, find the recurring complaint — cleanliness, security, or staff — fix it, and the metric typically recovers within a quarter.
How do I calculate net rental income correctly?
Take gross rental revenue and subtract concessions, bad debt, credit-card processing fees, and marketplace or referral commissions. The result should equal 85–92% of gross. If it drops below 80%, your discounting or collection process is leaking cash faster than pricing can replace it.
What causes a high tenant turnover rate?
Usually rates pushed above what the local market tolerates, followed by service or security complaints and submarket oversupply. Turnover above 7% per month compounds cost through cleaning, remarketing, and fresh acquisition spend, so treat it as an early warning, not background noise.
FAQ
What is the difference between physical and economic occupancy?
Physical occupancy is rented units divided by total units. Economic occupancy is actual rental revenue divided by potential revenue at market rate. The gap between them quantifies the money lost to concessions, discounts, and delinquency — the leakage a physical-occupancy number conceals.
Why does ancillary revenue get so much attention?
Because it is nearly pure margin. Tenant protection admin fees, locks, boxes, and late fees add $3–$6 per unit per month at little incremental cost and often reach 12–18% of total revenue. It converts an operating chore into a profit center.
How do I calculate net rental income correctly?
Take gross rental revenue and subtract concessions, bad debt, credit-card processing fees, and marketplace or referral commissions. The result should equal 85–92% of gross. If it drops below 80%, your discounting or collection process is leaking cash faster than pricing can replace it.
What causes a high tenant turnover rate?
Usually rates pushed above what the local market tolerates, followed by service or security complaints and submarket oversupply. Turnover above 7% per month compounds cost through cleaning, remarketing, and fresh acquisition spend, so treat it as an early warning, not background noise.
Can RevPAF be used to value a facility for sale?
Yes. Buyers apply a cap rate to net operating income, and RevPAF is a leading indicator of that income. A facility posting $18 per square foot will generally command a higher multiple than one at $12, all else equal, because it signals durable pricing power.
What is the biggest mistake operators make with NPS?
Not acting on detractor feedback. A score under 40 with unread low-score comments is a retention leak. Survey the detractors, find the recurring complaint — cleanliness, security, or staff — fix it, and the metric typically recovers within a quarter.
What is a healthy RevPAF benchmark for a stabilized facility?
For stabilized U.S. facilities, RevPAF commonly lands in the $12–$18 per square foot per year band. Top-quartile assets in dense metros like Los Angeles, New York, and Miami can clear $25. Segment by unit type to compare fairly.
How does unit mix affect RevPAF?
A facility that is 80% small units will show a lower RevPAF than one weighted toward large units even at identical occupancy. Reading only the blended number misdiagnoses a mix problem as a pricing problem. Track RevPAF by unit type and steer marketing toward higher-margin sizes.
What is the biggest mistake operators make with physical occupancy?
Chasing 95%-plus by slashing rates, which destroys RevPAF. The fix is a rate floor per unit type: accept a few points of lower occupancy in exchange for a materially higher average rate, and let RevPAF — not the occupancy percentage — be the scoreboard.
Sources
- https://www.cbre.com/insights
- https://www.selfstorage.org/
- https://investors.publicstorage.com/
- https://ir.extraspace.com/
- https://investors.cubesmart.com/
- https://www.storable.com/
- https://www.sparefoot.com/
- https://www.sec.gov/edgar/searchedgar/companysearch
Related on PULSE
This page will be disappearing soon. Save it to your device for $1 — or read it free while it is here.
@Kory-White- · if Venmo asks, the last 4 of my number are 2012
This page is gone.
This one is off the shelf now. $1 keeps it on your phone for good — the whole page, pictures and diagrams included.
 pulse-industry-kpisTuition Revenue per Enrolled Student: Private School Financial Health Metric in 2027
 pulse-industry-kpisTop 10 Bowling Alley Revenue KPIs in 2027
 pulse-industry-kpisTop 10 Real Estate RevPAR and Occupancy Rate Indicators in 2027
 pulse-industry-kpisTransaction Revenue Per Active User in Digital Wallets like PayPal in 2027
 pulse-industry-kpisRevenue per Brewery Barrel: Craft Beer Production and Wholesale Pricing in 2027
 pulse-industry-kpisRevenue Per Available Room (RevPAR) Recovery in Urban Luxury Hotels in 2027
 pulse-industry-kpisAd Revenue per Thousand Impressions (CPM) in Publishing: Digital Monetization in 2027
 pulse-industry-kpisTop 10 Console Gaming Revenue KPIs in 2027
 pulse-industry-kpisMonthly Recurring Revenue (MRR) per Customer in Subscription Box: Retention Value in 2027
 pulse-industry-kpisTop 10 Ski Resort Revenue KPIs in 2027