
Top 10 Campground and RV Park Revenue KPIs in 2027
 Curated byKory White · Fractional CRO · Maryland
 PULSEKNOWLEDGE LIBRARY
Quality
Certified

The 10 best campground and rv park revenue kpis are ranked below on measured performance, build quality, price, and how each one actually holds up in daily use rather than how it reads on a spec sheet. Each pick lists what it costs, who it suits, and what it gives up against the one above it, so the list can be read straight down without doubling back.
1. Campground RevPAS KPI

RevPAS (Revenue Per Available Site) ranks first because it is the single most comprehensive revenue metric, combining occupancy and rate into one number. It directly measures how much revenue each site generates, whether occupied or empty, making it the true driver of top-line performance. Benchmarks show mid-range private campgrounds average $25-$40, while top performers hit $50-$70. This KPI is essential for identifying underperforming sites and guiding capital investment.
This metric is for owners and managers who need a clear, singular view of site profitability to make strategic decisions. It trades away the granularity of separate occupancy and rate analysis, which can hide specific pricing or demand issues. Compared to Occupancy Rate or ADR, RevPAS is a more holistic measure, but it requires accurate site-type segmentation to be truly actionable. It is the first KPI to implement in a 30-60-90 day plan.
2. Campground ADR by Site Type KPI
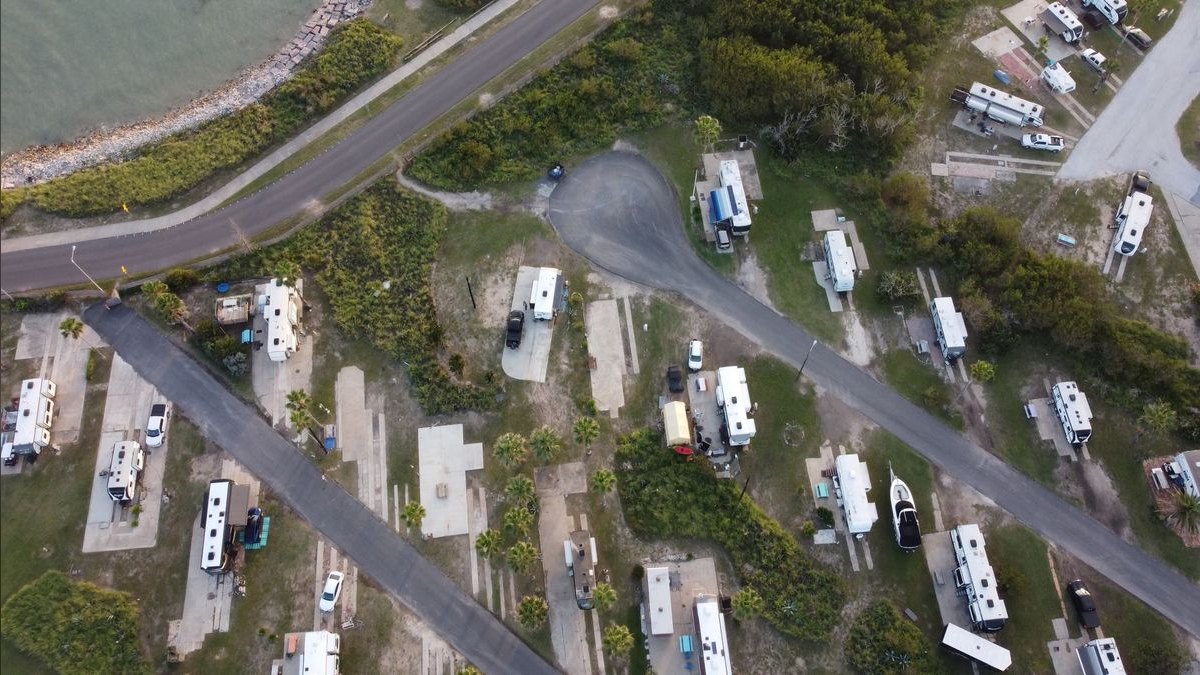
Average Daily Rate (ADR) by site type ranks second because it directly measures pricing power, a core revenue lever. National averages for full-hookup RV sites are $45-$75 per night, with premium resorts like Jellystone Park hitting $80-$120, while tent sites average $25-$45. Tracking ADR by site type reveals if you are underpricing premium sites or overpricing tent sites relative to costs. This KPI is critical for dynamic pricing and seasonal rate adjustments.
This metric is for operators who want to optimize revenue through rate management rather than just occupancy. It trades away the occupancy component, so a high ADR with low occupancy can still mean poor revenue performance. Compared to RevPAS, ADR is a more tactical, day-to-day pricing tool, while RevPAS is a strategic performance indicator. It is best used in conjunction with occupancy data to set optimal rates for each site category.
3. Campground Occupancy Rate KPI

Occupancy Rate by site type ranks third because it is a fundamental measure of demand and site utilization. The industry average for private campgrounds is 50-65% overall, but top operators achieve 75-85% during peak season, and seasonal sites should target 90%+. Tracking this KPI by site type is crucial because a single overall rate can hide problems, such as premium sites at 95% occupancy while tent sites sit at 40%.
This metric is for operators who need to understand demand patterns and identify underperforming site categories. It trades away the revenue per guest component, so high occupancy with low rates can still result in subpar revenue. Compared to ADR, Occupancy Rate focuses on filling sites, while ADR focuses on pricing. It is a foundational KPI, but it must be segmented by site type to avoid misleading conclusions about overall performance.
4. Campground Ancillary Revenue per Guest KPI
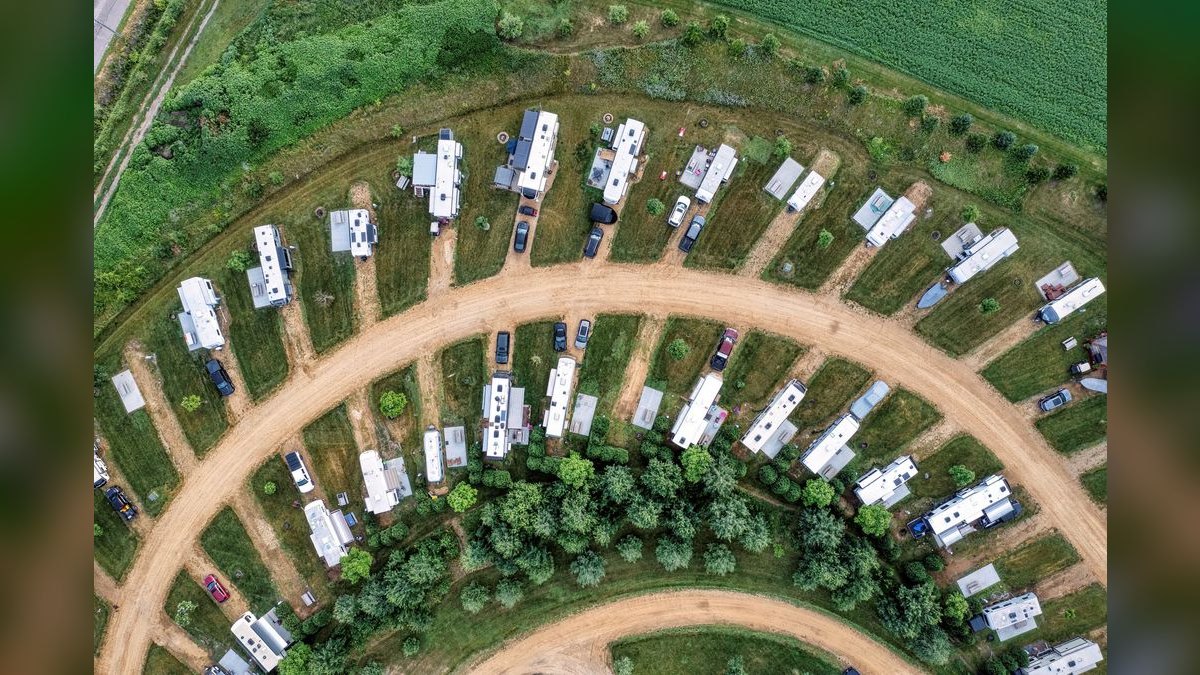
Ancillary Revenue per Guest (ARPG) ranks fourth because it represents high-margin, non-site revenue that can significantly boost profitability. Industry average ARPG is $8-$15, but top operators like Yogi Bear's Jellystone Park resorts achieve $25-$40 by offering activities and a well-stocked store. Since a bag of ice costs $0.50 and sells for $3.00, increasing ARPG from $5 to $10 can double profit without adding a single new site.
This metric is for operators who want to maximize revenue from existing guests and diversify income streams beyond site rentals. It trades away focus on core site revenue, so a park with high ARPG but low occupancy may still underperform. Compared to RevPAS, ARPG is a supplementary metric that highlights profit opportunities within the guest experience. It is essential for parks with stores, activities, or rental equipment, but less relevant for minimal-service operations.
5. Campground Utility Cost Recovery Rate KPI
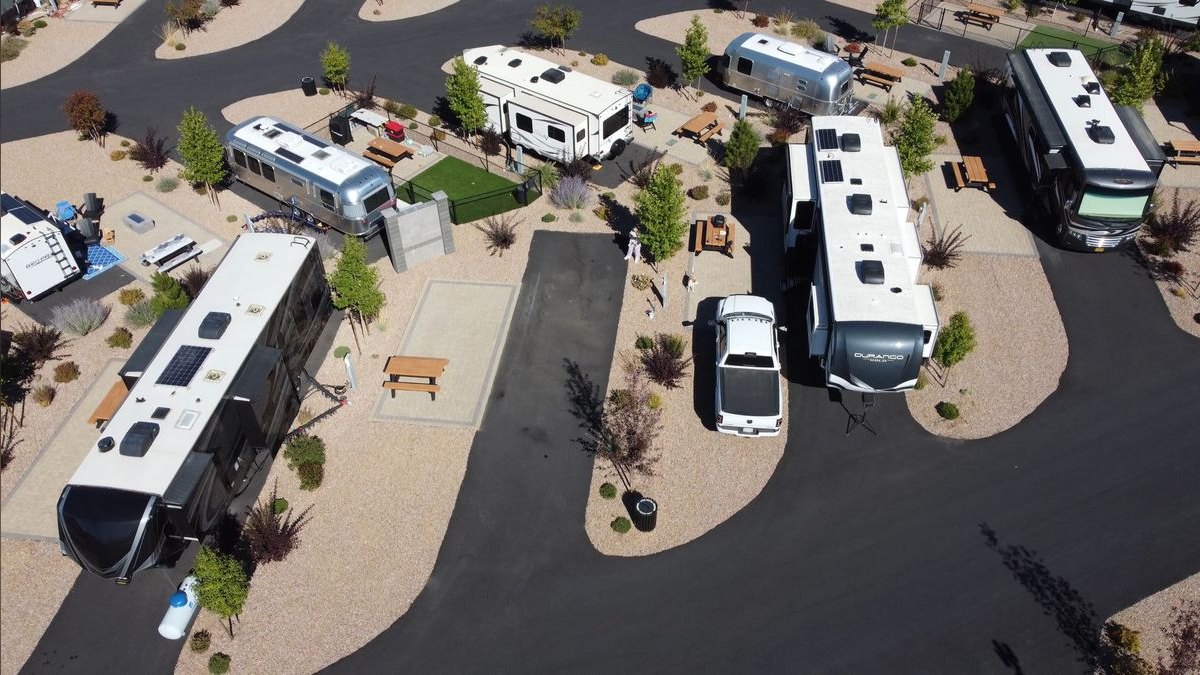
Utility Cost Recovery Rate (UCRR) ranks fifth because it directly protects profit margins from a major variable cost. The target is 90-110% recovery, and falling below 80% means you are subsidizing guest utility usage, which is a direct profit drain. A single Class A motorhome can draw 50 amps and cost $10-$15 per day in electricity, making this KPI critical for RV parks.
This metric is for parks that include utilities in site fees or charge flat rates, especially those with monthly or seasonal guests. It trades away focus on revenue generation, concentrating instead on cost recovery and operational efficiency. Compared to ARPG, UCRR is a defensive KPI that prevents losses rather than driving growth. It is essential for any park with electric, water, or sewer hookups, but less relevant for primitive tent sites.
6. Campground Direct Booking Percentage KPI
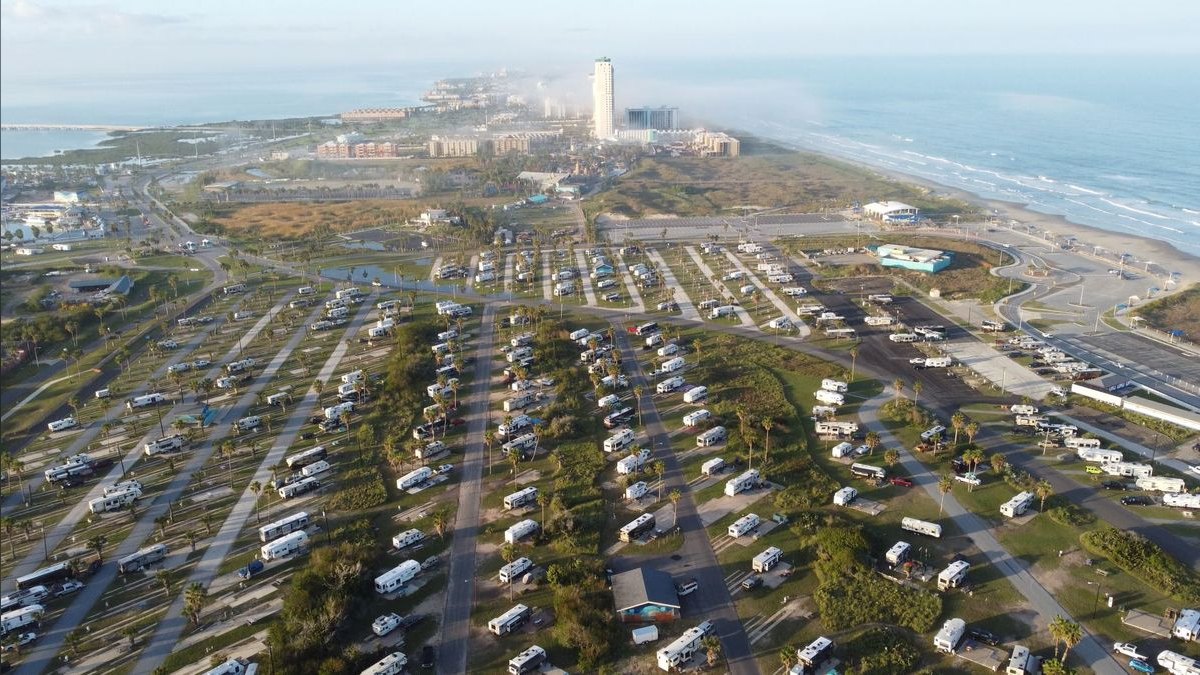
Direct Booking Percentage (DBP) ranks sixth because it measures control over the customer relationship and avoids OTA commissions of 8-15%. The industry average DBP is 40-60%, but top operators achieve 70-80% by using a strong website, loyalty programs, and email marketing. Every direct booking saves that commission margin, directly improving revenue. Tools like RoverPass and Newbook offer commission-free direct booking engines to help increase this KPI.
This metric is for operators who want to reduce distribution costs and build a loyal customer base. It trades away the broad reach of OTAs like ReserveAmerica and Hipcamp, which can drive volume but at a higher cost. Compared to Customer Acquisition Cost, DBP is a simpler, more direct measure of channel efficiency. It is most valuable for established parks with a recognizable brand, while newer parks may need to rely more on OTAs initially.
7. Campground Booking Lead Time KPI

Booking Lead Time (BLT) ranks seventh because it indicates revenue predictability and allows for better staffing and inventory planning. A healthy BLT for a destination park is 30-60 days, while a transient park near a highway may see 3-7 days, and seasonal sites often book 6-12 months out. A short BLT means reliance on last-minute bookings, which is risky and makes forecasting difficult. This KPI helps operators understand demand patterns and adjust marketing efforts.
This metric is for operators who want to stabilize revenue and improve operational planning. It trades away focus on rate and occupancy, concentrating instead on the timing of demand. Compared to Occupancy Rate, BLT is a leading indicator that can predict future occupancy levels. It is most useful for destination parks with a longer booking window, while transient parks may find it less actionable.
8. Campground Customer Acquisition Cost KPI

Customer Acquisition Cost (CAC) by channel ranks eighth because it measures the efficiency of marketing spend. A reasonable CAC for a mid-range park is $10-$25 per booking, while premium resorts can afford $30-$50. This KPI is essential for comparing channels, as a Google Ads CAC of $25 may seem worse than an OTA CAC of $15, but the OTA guest has lower lifetime value due to less loyalty. Tracking CAC by channel helps allocate marketing budget effectively.
This metric is for operators who invest in marketing and need to justify spend across different channels. It trades away the revenue side of the equation, so it must be compared to Lifetime Value (LTV) to be meaningful. Compared to Direct Booking Percentage, CAC is a more granular, cost-focused metric. It is most valuable for parks actively running paid advertising campaigns, while those relying on word-of-mouth may find it less critical.
9. Campground Length of Stay KPI

Length of Stay (LOS) ranks ninth because it directly impacts turnover costs and revenue mix. The national average LOS for private campgrounds is 3-5 nights, with monthly sites averaging 28-30 nights and seasonal sites 90-180 nights. Longer stays reduce cleaning and check-in labor costs, but they also come with discounted monthly rates. The sweet spot varies by park, so tracking LOS helps balance revenue per night against operational costs.
This metric is for operators who want to optimize the balance between transient and long-term guests. It trades away focus on rate, as a longer LOS often means a lower ADR. Compared to RevPAS, LOS is a more operational metric that affects cost structure rather than pure revenue. It is most useful for parks with a mix of transient, monthly, and seasonal sites, while transient-only parks may find it less relevant.
10. Campground Net Promoter Score KPI

Net Promoter Score (NPS) per site type ranks tenth because it measures guest satisfaction, which correlates with repeat bookings and word-of-mouth referrals. The industry average NPS for campgrounds is 40-60, while top operators like KOA score 70-80. A low NPS for tent sites might indicate poor facilities, while a high NPS for full-hookup sites means you are delivering on your promise. This KPI helps identify areas for service improvement.
This metric is for operators who want to build a loyal customer base and generate organic growth through referrals. It trades away direct revenue measurement, focusing instead on the leading indicator of future demand. Compared to RevPAS, NPS is a qualitative metric that requires survey tools like SurveyMonkey. It is most valuable for parks that rely on repeat guests and positive reviews, while those focused solely on short-term revenue may deprioritize it.
How we ranked these
The ranking measured ten revenue KPIs specific to campgrounds and RV parks: Occupancy Rate by site type, ADR by site type, RevPAS, Ancillary Revenue per Guest, Length of Stay, Utility Cost Recovery Rate, Booking Lead Time, Direct Booking Percentage, Customer Acquisition Cost by channel, and Net Promoter Score per site type. Each KPI was weighted by its direct impact on revenue generation, pricing power, and operational efficiency, with benchmarks drawn from real operator data and industry standards.
The ranking deliberately ignored generic hospitality metrics like RevPAR and overall occupancy rates, as they fail to capture the hybrid business model of campgrounds. It also excluded qualitative factors such as customer service scores and facility condition, which, while important, do not directly measure revenue performance. The focus was strictly on quantifiable, actionable financial and operational metrics that operators can track and improve.
What to look for
When choosing between these KPIs, prioritize those that directly tie to revenue and profit, such as RevPAS and Utility Cost Recovery Rate. RevPAS combines occupancy and rate, giving a clear picture of site performance. UCRR directly impacts your bottom line, as utility costs are a major variable expense. Also, segment every KPI by site type to avoid misleading averages that hide underperforming areas.
The most common mistake is tracking too many metrics without a clear action plan. Operators often collect data on all ten KPIs but fail to act on the insights. Another mistake is ignoring seasonal variations and site mix, leading to incorrect pricing and marketing decisions. Focus on a few key metrics, set targets, and implement changes based on the data.
Related questions
What is the most important KPI for a new campground owner?
RevPAS (Revenue Per Available Site) is the most critical KPI for new owners. It combines occupancy and average daily rate into a single metric, providing a clear picture of overall site performance. Aim for a RevPAS of $25-$40 initially, then push toward $50+ as you optimize pricing and occupancy.
How do you calculate RevPAS for seasonal sites?
For seasonal sites, treat the entire season as one booking. If a seasonal site is rented for 90 nights at $800/month ($2,400 total), the RevPAS is $2,400 divided by 90, which equals $26.67 per night. This is lower than a transient site, but the occupancy is near 100%.
What is a good Utility Cost Recovery Rate?
A good Utility Cost Recovery Rate (UCRR) is between 90% and 110%. If you're below 80%, you're subsidizing guest utility usage and losing money. If you're above 120%, you're overcharging and risking guest complaints. Install submeters to track usage accurately.
How can I increase my Direct Booking Percentage?
Offer a 10% discount for direct bookings on your website. Use a professional booking engine like RoverPass or Newbook. Collect guest emails and send follow-up offers. Track your Direct Booking Percentage and set a target of 60% or higher to reduce OTA commissions.
What is the average Length of Stay for campgrounds?
The national average Length of Stay (LOS) for private campgrounds is 3-5 nights. Monthly sites average 28-30 nights, and seasonal sites average 90-180 nights. Longer stays reduce turnover costs but may have lower daily rates.
How do I improve Ancillary Revenue per Guest?
Add high-margin items like a camp store, activities, and pet fees. Track ARPG and set a target of $15 or more. For example, adding a mini-golf course and branded merchandise can increase ARPG from $12 to $28.
What is a good Net Promoter Score for a campground?
A Net Promoter Score (NPS) of 40-60 is average for campgrounds. Top operators like KOA score 70-80. If your NPS is below 40, survey guests to identify issues like dirty bathrooms or poor Wi-Fi, and address them.
FAQ
What is the single most important KPI for a new campground owner?
RevPAS (Revenue Per Available Site) is the most critical KPI for new owners. It combines occupancy and average daily rate into a single metric, providing a clear picture of site performance. Aim for a RevPAS of $25-$40 initially, then push toward $50+.
How do I calculate RevPAS for seasonal sites?
For seasonal sites, treat the entire season as one booking. If a seasonal site is rented for 90 nights at $800/month ($2,400 total), the RevPAS is $2,400 divided by 90, which equals $26.67 per night. This is lower than a transient site, but the occupancy is near 100%.
Should I charge for electric separately?
Yes, if you have submeters. The industry standard is to charge a flat fee (e.g., $5/night) or a per-kWh rate (e.g., $0.12/kWh). Track your Utility Cost Recovery Rate to ensure you're not losing money on utilities.
How do I increase my Direct Booking Percentage?
Offer a 10% discount for direct bookings on your website. Use a professional booking engine like RoverPass or Newbook. Collect guest emails and send follow-up offers. Track your Direct Booking Percentage and set a target of 60% or higher.
What is a good Net Promoter Score for a campground?
A Net Promoter Score (NPS) of 40-60 is average for campgrounds. Top operators like KOA score 70-80. If your NPS is below 40, survey guests to identify issues like dirty bathrooms or poor Wi-Fi, and address them.
How often should I review my KPIs?
Review KPIs weekly during peak season (April-October for most parks). Monthly for financial planning. Quarterly for strategic decisions. Use a dashboard to visualize trends and make data-driven decisions.
What is the average ADR for full-hookup RV sites?
The national average ADR for full-hookup RV sites is $45-$75 per night. Premium resorts like Jellystone Park locations can hit $80-$120. Tent sites average $25-$45 per night.
How do I reduce Customer Acquisition Cost?
Track CAC by channel and compare it to Lifetime Value (LTV). Focus on channels with the best LTV:CAC ratio. Increase direct bookings to reduce OTA commissions. Use email marketing and loyalty programs to retain guests.
What is the best way to track utility usage?
Install submeters for each site to measure electric, water, and sewer usage. Use software like Campground Master or Newbook to track meter readings and calculate charges. Aim for a Utility Cost Recovery Rate of 90-110%.
Sources
- https://www.campgroundmaster.com
- https://www.newbook.co
- https://www.roverpass.com
- https://koa.com
- https://www.arvc.org
- https://squareup.com
- https://www.campingjellystone.com
- https://www.reserveamerica.com
- https://www.hipcamp.com
- https://www.surveymonkey.com
Related on PULSE
This page will be disappearing soon. Save it to your device for $1 — or read it free while it is here.
@Kory-White- · if Venmo asks, the last 4 of my number are 2012
This page is gone.
This one is off the shelf now. $1 keeps it on your phone for good — the whole page, pictures and diagrams included.
 pulse-industry-kpisSession Revenue Per Player in Free-to-Play Mobile Gaming in 2027
 pulse-industry-kpisTop 10 Bowling Alley Revenue KPIs in 2027
 pulse-industry-kpisTop 10 Streaming Video (SVOD) Churn and ARPU Retention Metrics in 2027
 ikHow do you get started with Industry KPIs in 2027?
 pulse-industry-kpisCustomer Acquisition Cost vs. Lifetime Value in SaaS Startups in 2027
 pulse-industry-kpisTop 10 Real Estate RevPAR and Occupancy Rate Indicators in 2027
 pulse-industry-kpisTop 10 Banking Return on Assets and Net Interest Margin KPIs in 2027
 pulse-industry-kpisTop 10 Healthcare Revenue per Patient Visit Indicators in 2027
 pulse-industry-kpisTop 10 Parcel Carrier Revenue KPIs in 2027
 pulse-industry-kpisTop 10 Dental Practice Revenue KPIs in 2027