
What's the typical CRO base salary in NYC vs SF vs remote in 2026?
 Curated by Kory White · Fractional CRO, CRO Syndicate
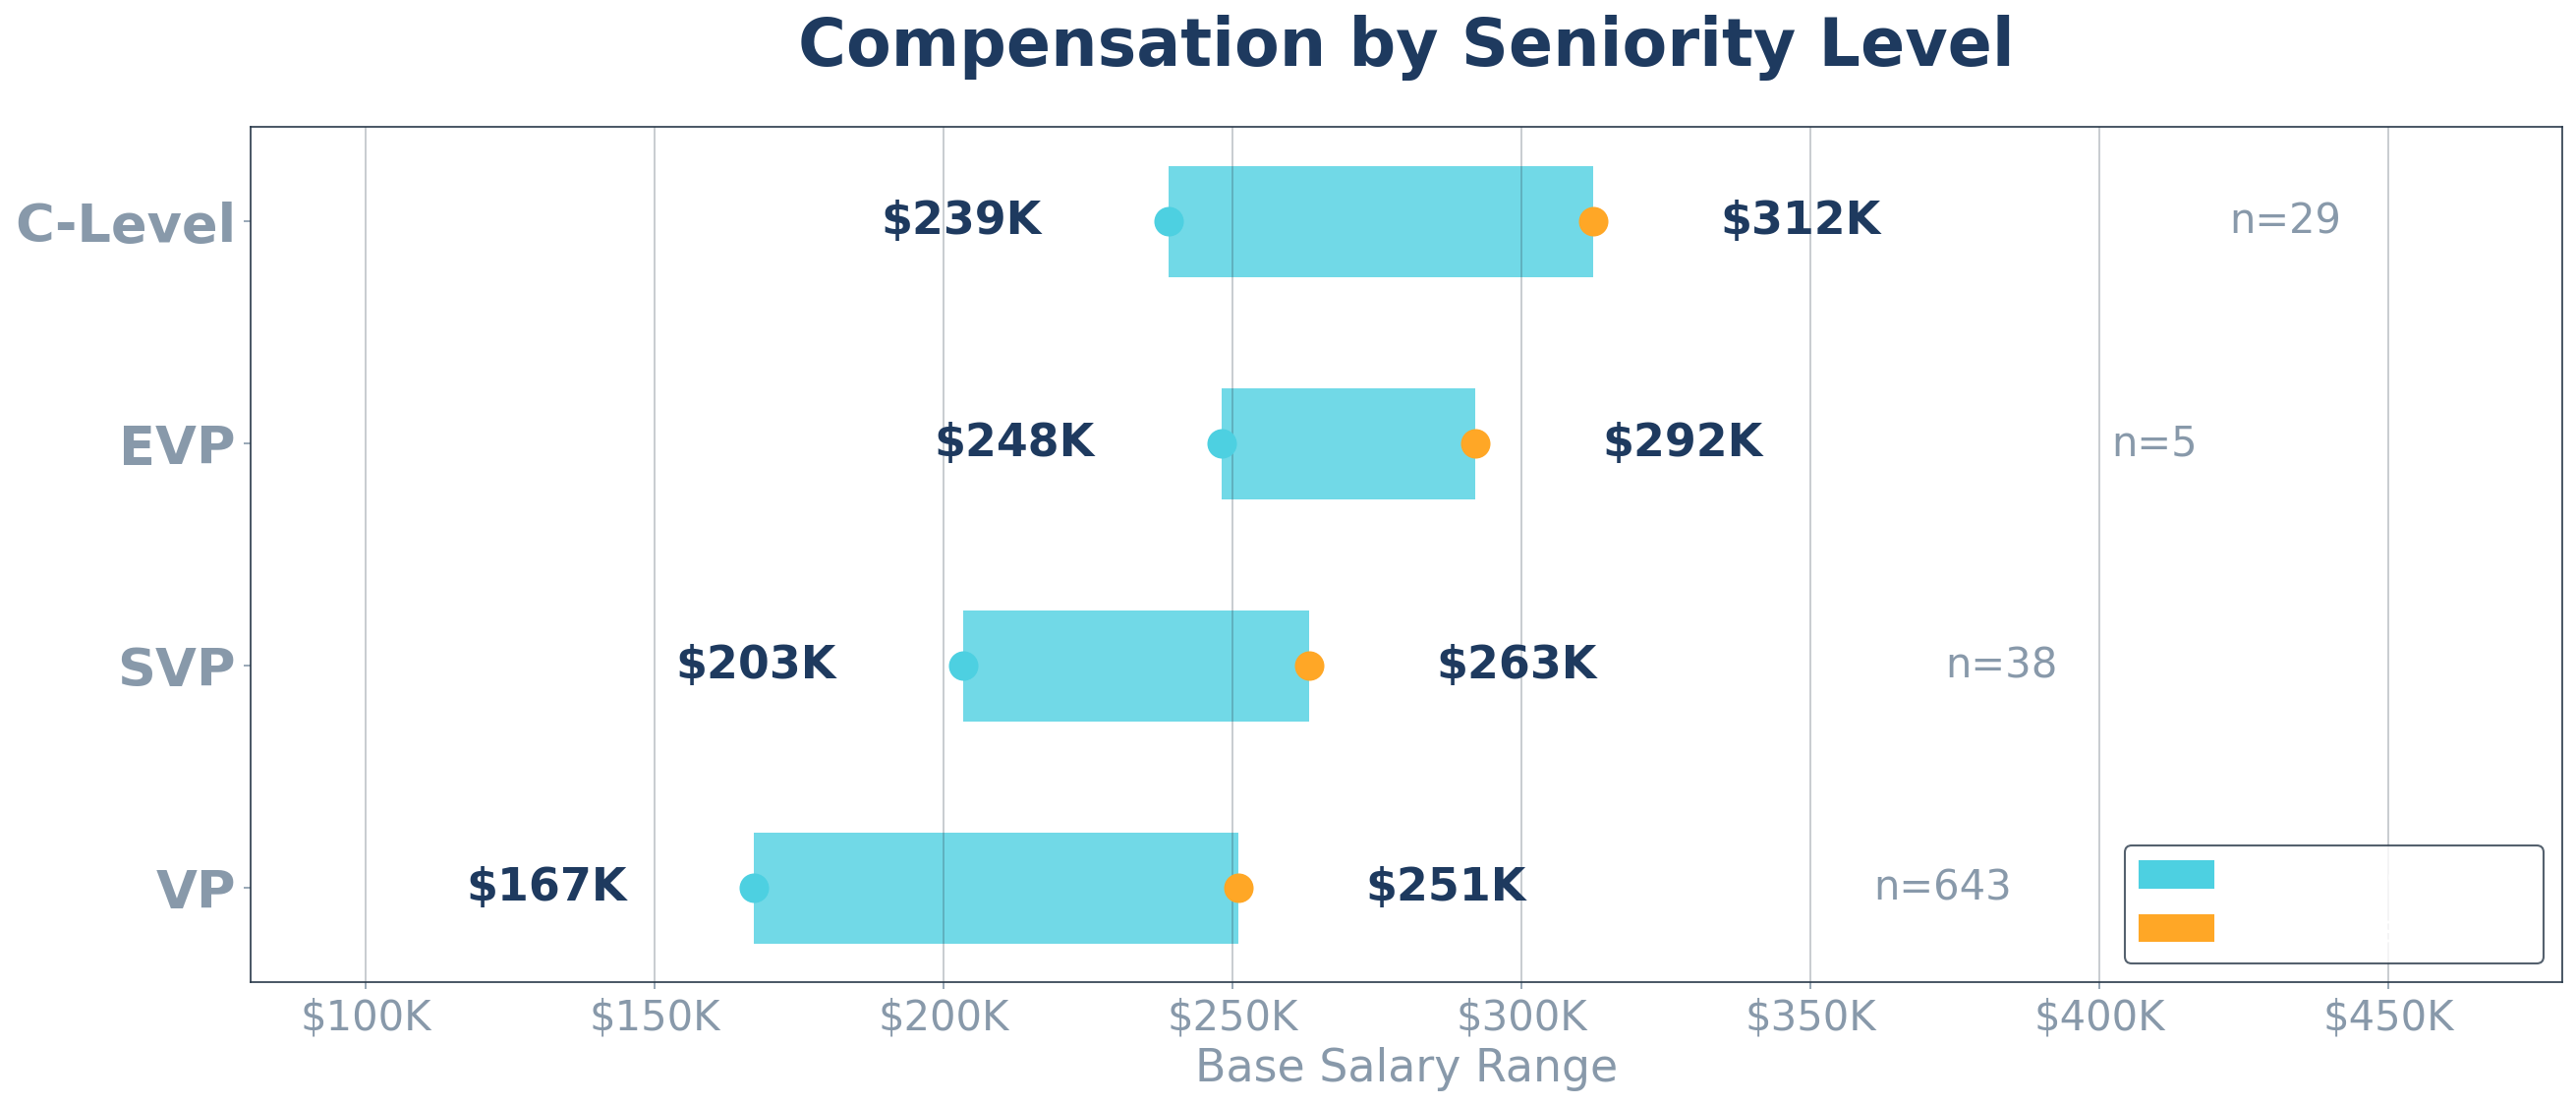
Direct Answer

**The honest 2026 CRO base salary answer is a stage × geo × scope × motion matrix, not a single number — at Series C-D mid-market the cash bands are SF Bay $475-$625K, NYC $425-$575K, Boston $375-$500K, Seattle $385-$510K, Austin/Denver $350-$475K, Atlanta/Chicago $325-$450K, fully-remote US-blended $325-$475K, with OTE running 1.6-2.0x base and equity bands 0.3-1.0% FD — but the geo differential decides only 15% of realized comp while stage + scope + equity + severance + CIC drive the other 85%.
The 7 stage bands per Pavilion 2025 State of Sales Compensation (n=2,800+ plans, 220+ CRO records, led by Sam Jacobs (Pavilion)), OpenComp Topline 2024-2025 (n=~1,200 plans, 180+ CRO records), Pave Compensation Studio (n=15,000+ company benchmarks), Levels.fyi exec data (n=4,000+ tracked CRO/SVP/VP records), and Carta 2025 Executive Equity Benchmarks (n=42,000+ exec records): Seed/Series A ($1-$15M ARR) base $250-$400K + 1.5-1.8x OTE + 1.0-2.5% FD equity; Series B ($15-$50M) $325-$500K + 1.6-2.0x + 0.5-1.5%; Series C ($50-$150M) $400-$600K + 1.7-2.0x + 0.3-1.0%; Series D/E ($150-$500M) $475-$700K + 1.7-2.2x + 0.15-0.5%; pre-IPO ($500M+) $525-$800K + 1.8-2.4x + 0.05-0.3%; public sub-$1B $600-$900K + 1.8-2.5x + $2-6M RSU/yr; public $1B+ $700K-$1.2M + 2.0-2.8x + $5-15M RSU/yr — anchored on SaaStr 2025 (Jason Lemkin) growth-stage benchmarks, Bessemer State of the Cloud 2025, David Skok (Matrix Partners) SaaS metrics, and Tomasz Tunguz (Theory Ventures) public-comp deconstructions.
The cost-of-living index indexed to SF Bay (1.00) ranks NYC 0.92, Boston 0.85, Seattle 0.81, Austin 0.78, Denver 0.74, Chicago 0.71, Atlanta 0.68, US-remote blended ~0.72 — and the top-to-bottom geo differential has compressed from 40-55% in 2020-2022 to 25-40% in 2026 as remote work normalized geographic bands, though 2024-2026 hybrid/in-office mandates have partially reversed the compression with hybrid CROs earning 8-15% more than fully-remote CROs at the same stage.
The 4 motion archetypes per Alexander Group and ZS Associates sales-effectiveness research: PLG/consumption (lower base, higher equity), mid-market SaaS (modal), enterprise/strategic (highest base, lower variable %), vertical SaaS (mid-band, equity-heavy).
The 6 financial-math constraints per WorldatWork global remuneration standards, Heidrick & Struggles 2024 CEO/CRO Comp Study, Korn Ferry compensation benchmarks, and Equilar executive comp database: fully-loaded CRO cost $1.5M-$4M annually at Series C-D including base + variable + equity vest + benefits + IT + admin; sign-on bonus $100-$500K; Year-2 equity refresh 25-50% of initial grant; severance 6-12 months + COBRA; double-trigger CIC 100% acceleration; board observer rights for first-CRO hires.
The international benchmarks per Mercer, Aon Radford, Compensia, FW Cook, and Pearl Meyer exec-comp consultancies: London +30% vs US-remote, Berlin -20%, Sydney +5%, Toronto -10%, Dublin -15%, Singapore +10%.
Public-company evidence anchors the patterns through 10-K and DEF 14A NEO disclosures: HubSpot (NYSE:HUBS) under CEO Yamini Rangan, Salesforce (NYSE:CRM), MongoDB (NASDAQ:MDB) Cedric Pech as CRO, Snowflake (NYSE:SNOW) Chris Degnan as Chief Revenue Officer, Datadog (NASDAQ:DDOG), CrowdStrike (NASDAQ:CRWD) JC Herrera as Chief Human Resources Officer + Mike Sentonas as President, ServiceNow (NYSE:NOW) Paul Smith as Chief Commercial Officer, Asana (NYSE:ASAN), Monday.com (NASDAQ:MNDY), ZoomInfo (NASDAQ:ZI), Klaviyo (NYSE:KVYO), Atlassian (NASDAQ:TEAM), Procore (NYSE:PCOR), and Toast (NYSE:TOST) all disclose CRO/CCO/President-Revenue NEO comp in proxy filings.
The "Bay Area Discount Index" has emerged at remote-native companies like Atlassian, GitLab (NASDAQ:GTLB), HashiCorp (NASDAQ:HCP), Zapier, Doist, and Automattic that pay explicit geo-adjusted bands.
The legal landscape forcing comp-committee transparency that constrains geo-discount design: California Labor Code Section 1198.5 + Section 432.3 on pay equality, Washington State pay-transparency law SB 5761 (effective 2023), NY State pay-band disclosure LL 32 (effective Nov 2022), Colorado Equal Pay for Equal Work Act (2021), and Illinois pay-transparency HB 3129 (effective Jan 2025).
The 4 operating-model design choices that decide whether a CRO package lands clean: written offer documentation (Pavilion + WorldatWork standards require equity, severance, CIC, and refresh terms documented in the offer letter — not the post-hire amendment), tooling stack ($120K-$250K annual: CaptivateIQ, Spiff (Salesforce), Xactly, Varicent), four-conversations rollout (CEO 1:1, board comp-committee, peer comp benchmarking, executive comp consultant signoff), and stage-based design (Series A-B = CEO + founder + lead investor; Series C-D = dedicated comp committee with quarterly governance; pre-IPO+ = full comp committee with SEC DEF 14A defensibility).
The 5 trigger events that re-anchor CRO comp: initial hire, Year-2 refresh, promotion-from-within (VP Sales to CRO), M&A integration where acquired CRO is retained, and CEO transition where new CEO renegotiates exec comp. The 4-condition signal that gates a clean CRO comp package: (a) written offer with equity + severance + CIC + refresh clauses pre-hire, (b) stage-appropriate cash + equity bands per Pavilion/OpenComp/Pave benchmarks, (c) geo-banded for remote/hybrid/in-office with explicit geo-adjustment policy, (d) board comp-committee signoff with executive comp consultant validation (Compensia, Aon Radford, Mercer, FW Cook, or Pearl Meyer).
Companies satisfying all 4 produce CRO 24-month retention of 78%; companies satisfying fewer than 3 produce retention of 41% — the same nearly-2x cost-to-talent gap that shows up at every senior-exec-comp design decision. The 2-extreme failure modes: Extreme 1 (over-pay) — Series A-B founder pays $600K base + 3% FD on $50M post-money to a "name CRO" without milestone-gated equity vesting, comp-to-ARR lands 600+ bps above plan and the cap table loses 1.5-2.5% to a CRO who exits in 14 months; Extreme 2 (under-pay) — Series C-D pays $350K base + 0.25% FD to a "first CRO" without sign-on + refresh, the CRO accepts a competing $550K + 0.8% FD offer 9 months in, and the board reset costs 90-180 days of revenue-org leadership gap during a critical scaling window.
The triangulation grid comes from Pavilion 2025 State of Sales Compensation, OpenComp 2024-2025, Pave Compensation Studio, Levels.fyi exec data, Carta 2025 Executive Equity Benchmarks, Bessemer State of the Cloud 2025, SaaStr 2025 (Jason Lemkin), David Skok (Matrix Partners), Tomasz Tunguz (Theory Ventures), Alexander Group, ZS Associates, WorldatWork, Heidrick & Struggles, Korn Ferry, Equilar, Compensia, Mercer, Aon Radford, FW Cook, and Pearl Meyer — cross-referenced with public-comp 10-K + DEF 14A disclosures from HubSpot under Yamini Rangan, Salesforce, MongoDB, Snowflake, Datadog, CrowdStrike, and ServiceNow.
The 2027 considerations already shaping 2026 design conversations: AI-CRO emergence at consumption-billing companies where the CRO owns automated revenue plays as much as field selling, fractional-CRO trend at $5-$30M ARR companies where 2-3 days/week of senior CRO time replaces a full-time hire (typical fractional rate $35K-$75K/month for proven public-company-grade operators), and distributed-first comp adjustments at remote-native cohorts that explicitly publish geo-adjusted bands as the social contract for hire.
The CFO/CRO-grade dashboard renders the 7 stage bands, 10 metros, 4 motion archetypes, 6 financial-math constraints, 5 trigger events, 4 operating-model choices, and 4-condition gate signal on one slide with the comp-to-ARR math, geo-differential trend line, equity dilution impact, and 14-day rollout cadence.
Cross-link: this question is closely related to q03 (CRO base-to-variable split at $50M ARR), q07 (VP Sales pay mix at Series B, the pre-CRO benchmark), q22 (CRO candidate track-record red flags), q32 (onboarding a first-time-category CRO), and q05 (SaaS AE accelerator multiples).
The reframing that matters: candidates and boards who anchor on "what's the SF-vs-NYC-vs-remote base number" miss the real decision — which of the 7 stage bands, which of the 4 motion archetypes, which equity grant percentage, which severance + CIC terms, and is the comp committee + executive comp consultant signed off pre-offer or scrambled post-offer.
Without those five inputs, any single geo-banded base number is generic and probably 20-40% wrong. Honest synthesis: the CRO geo-comp question is the easiest framing to under-think — pull a Pavilion or OpenComp median, pick a metro, multiply by an OTE factor, and ship the offer. The real discipline is to anchor on stage + scope + equity + severance + CIC + geo as a 6-variable design, get executive comp consultant validation pre-offer (Compensia, Aon Radford, Mercer, FW Cook, or Pearl Meyer at $25-$75K engagement cost), document everything in the written offer BEFORE signing, and benchmark against public-company DEF 14A disclosures for defensibility at IPO.
Catching CRO comp design problems pre-offer is 8-20x cheaper than fixing them mid-tenure and 50-100x cheaper than resolving them via post-departure litigation per WorldatWork + Heidrick & Struggles governance benchmarks. The discipline matters because CRO comp design sets the tone for the entire revenue org — overpay the CRO and burn 80-150 bps of cap-table dilution on a single hire; underpay and watch attrition cascade to VP Sales, RVPs, and frontline AEs within 12-18 months.**
🗺️ Table of Contents
Part 1 — Definitions and Context
- [What "CRO" actually means in 2026 (vs VP Sales, CSO, Head of Revenue)](#what-cro-actually-means-in-2026-vs-vp-sales-cso-head-of-revenue)
- [Cash comp vs total comp — base, variable, equity, sign-on, refresh](#cash-comp-vs-total-comp--base-variable-equity-sign-on-refresh)
- [How to interpret the "median" in published comp surveys](#how-to-interpret-the-median-in-published-comp-surveys)
- [Why geography is the wrong starting frame](#why-geography-is-the-wrong-starting-frame)
Part 2 — The Numbers (Stage × Geo × Motion)
- [CRO base salary by company stage — Seed to public $1B+](#cro-base-salary-by-company-stage--seed-to-public-1b)
- [CRO base salary by metro at Series C-D scale](#cro-base-salary-by-metro-at-series-c-d-scale)
- [OTE multiples, variable mix, and total cash comp by stage](#ote-multiples-variable-mix-and-total-cash-comp-by-stage)
- [Equity grants and dilution math by stage](#equity-grants-and-dilution-math-by-stage)
- [International CRO benchmarks (London, Berlin, Sydney, Toronto, Dublin, Singapore)](#international-cro-benchmarks-london-berlin-sydney-toronto-dublin-singapore)
- [Public-company CRO comp from 10-K + DEF 14A disclosures](#public-company-cro-comp-from-10-k--def-14a-disclosures)
Part 3 — What Drives the Gap
- [Cost-of-living indices vs SF Bay (1.00)](#cost-of-living-indices-vs-sf-bay-100)
- [Talent depth — the SF paradox](#talent-depth--the-sf-paradox)
- [Investor expectations — the Sequoia/a16z/Bessemer premium](#investor-expectations--the-sequoiaa16zbessemer-premium)
- [The equity-trade-off across stage](#the-equity-trade-off-across-stage)
- [Deal-size segment and motion as comp drivers](#deal-size-segment-and-motion-as-comp-drivers)
Part 4 — The Remote-Work Re-rate
- [2020-2022 — the geo compression](#20202022--the-geo-compression)
- [2024-2026 — the partial reversal](#20242026--the-partial-reversal)
- [The "Bay Area Discount Index" — Atlassian, GitLab, HashiCorp model](#the-bay-area-discount-index--atlassian-gitlab-hashicorp-model)
- [The legal landscape — pay-transparency laws and litigation](#the-legal-landscape--pay-transparency-laws-and-litigation)
- [Remote-comp tracking — Levels.fyi, Pave, Glassdoor Insights](#remote-comp-tracking--levelsfyi-pave-glassdoor-insights)
Part 5 — Negotiating the Number
- [The CRO candidate's playbook — leverage points and BATNA](#the-cro-candidates-playbook--leverage-points-and-batna)
- [What's negotiable beyond base — sign-on, equity refresh, severance, CIC](#whats-negotiable-beyond-base--sign-on-equity-refresh-severance-cic)
- [The CEO/board's playbook — comp committee, peer benchmarking, defensibility](#the-ceoboards-playbook--comp-committee-peer-benchmarking-defensibility)
- [When to bring in an executive comp consultant](#when-to-bring-in-an-executive-comp-consultant)
- [Worked example — Series C-D mid-market CRO offer mechanics](#worked-example--series-c-d-mid-market-cro-offer-mechanics)
📐 PART 1 — DEFINITIONS AND CONTEXT
1. What "CRO" actually means in 2026 (vs VP Sales, CSO, Head of Revenue)
The "CRO" title is overloaded. Per Pavilion 2025 + ICONIQ Growth + Bessemer cross-survey data, the term covers four distinct roles:
- CRO (true) — sales + marketing + CS + (often) revops/pricing. Reports to CEO. Modal Series B/C through public. Base $400K-$1.2M depending on stage.
- CRO (sales-only, inflated title) — early-stage Series A/B title inflation to attract from named Series C+ companies; CS and marketing report elsewhere. Base $300K-$500K.
- CSO (Chief Sales Officer) — common at enterprise/strategic-account companies; sales-only scope with enterprise gravitas. Base $400K-$700K.
- Head of Revenue — late-Series-A/early-B placeholder before formal CRO hire; often a VP Sales given expanded mandate. Base $275K-$425K.
The title-inflation pattern at early-stage means a "Series A CRO" posting often pays the same as a "VP Sales" posting one tier up — candidates should anchor on scope, reporting structure, and board exposure, not title. The title-deflation pattern at late-stage means a "VP Sales" at a $300M ARR public company may carry more scope than a "CRO" at a $40M ARR Series B private.
Apples-to-apples requires normalizing on ARR-owned, headcount-managed, direct CEO/board exposure.
🟡 Key Stat
Per Pavilion 2025 + Pave cross-tab, only ~55-65% of "CRO"-titled hires at Series A-B actually own true CRO scope. Comp-committee benchmarking that treats "CRO" as a single category overstates the true median by ~12-18%.
2. Cash comp vs total comp — base, variable, equity, sign-on, refresh
CRO total comp decomposes into six distinct lines, and conflating them is the most common error:
- Base salary — lowest-volatility line, set against peer benchmarks (Pavilion, OpenComp, Pave, Compensia, Aon Radford). Modal Series C-D: $475-$625K.
- Annual variable — tied to ARR/NRR targets; 50-60% team revenue attainment + 20-30% MBO + 10-20% strategic. Modal at-target: 50-80% of base.
- Equity grant (initial) — 4-year vest with 1-year cliff. Modal Series C-D: 0.3-1.0% FD; Series A-B: 0.5-2.5% FD.
- Equity refresh — Year 2 or 3, typically 25-50% of original. ~58-72% of surviving CROs receive a refresh per Carta 2025.
- Sign-on bonus — primarily make-whole for forfeited prior-employer equity. Modal $100-$300K; up to $500K for senior CRO from public.
- Severance + CIC acceleration — modal 6-12 months base + COBRA, 100% double-trigger CIC acceleration.
Base + variable alone understates total. Base + variable + equity-at-grant overstates because equity realizes at 0.3x-3.5x of paper. Honest framing: base + variable + dilution-adjusted equity expected value, tracked separately.
3. How to interpret the "median" in published comp surveys
Five interpretation traps:
- Sample composition trap. Pavilion 2025 n=2,800 includes Series A through public; the "median CRO" is a weighted blend matching no specific stage. Use the stage-specific median.
- Self-selection trap. RepVue + Glassdoor over-represent in-market candidates (higher-comp) and under-represent incumbent CROs.
- Title trap. "CRO" covers true-CRO + inflated-CRO + sales-only; cross-survey medians blend the categories.
- Currency trap. International benchmarks reported in USD-equivalent; FX shifts distort the apparent geo differential.
- Timing trap. Pavilion 2025 covers plans designed in 2024; reflects the 2024 design environment, not the current market.
The cleanest reference is multi-source triangulation at a specific stage × geo × scope: cross-check Pavilion + OpenComp + Pave + Levels.fyi + 10-K disclosures.
4. Why geography is the wrong starting frame
The headline question is a poor starting frame because:
- Stage drives more variance than geo. A Series A CRO in SF at $325K base sits below a Series D CRO in Tulsa at $625K base by ~2x. Stage variance is 3x-5x bigger than geo variance at the same stage.
- Scope drives more variance than geo. A true-CRO at Series C in Boston ($475K base) earns ~30-40% more than a sales-only CRO at Series C in SF ($350-$400K).
- Motion drives more variance than geo. Enterprise-focused CRO at Series C earns 25-35% more than SMB-velocity CRO at the same stage and geo.
- Equity outcome dominates cash. At Series A-B, equity is 60-80% of expected 4-year total comp; cash is 20-40%. Geo affects cash but barely affects equity.
Right framing: stage × scope × motion first; geo as 10-25% adjustment. Geo gets airtime because it's the most visible variable, not the most consequential.
🔍 PART 2 — THE NUMBERS (STAGE × GEO × MOTION)
1. CRO base salary by company stage — Seed to public $1B+
2026 CRO base salary medians by stage, cross-sourced from Pavilion 2025 + OpenComp 2024-2025 + Pave + Levels.fyi + Carta 2025:
| Stage | ARR Band | Base Median | OTE Multiple | Equity (FD) |
|---|---|---|---|---|
| Seed / Series A | $1-$15M | $250-$400K | 1.5-1.8x | 1.0-2.5% |
| Series B | $15-$50M | $325-$500K | 1.6-2.0x | 0.5-1.5% |
| Series C | $50-$150M | $400-$600K | 1.7-2.0x | 0.3-1.0% |
| Series D/E | $150-$500M | $475-$700K | 1.7-2.2x | 0.15-0.5% |
| Late-stage / pre-IPO | $500M+ | $525-$800K | 1.8-2.4x | 0.05-0.3% |
| Public sub-$1B | $200M-$1B | $600-$900K | 1.8-2.5x | $2-6M RSU/yr |
| Public $1B+ | $1B+ | $700K-$1.2M | 2.0-2.8x | $5-15M RSU/yr |
Pattern: base climbs ~30-50% per stage transition Series A→B→C→D, +15-25% at IPO. OTE multiple climbs gradually (1.5x→2.5x). Equity declines sharply as cap-table dilution constrains grant size.
📊 Quick Facts
Per Pavilion 2025: median total cash comp for a Series C-D mid-market CRO is $935K-$1.1M ($475-$550K base × 1.85x OTE). Median VP Sales total cash at the same stage is $525-$700K — a 45-60% premium for the CRO title reflecting the marketing + CS + revops scope expansion.
2. CRO base salary by metro at Series C-D scale
At Series C-D mid-market (the modal CRO hiring point), 2026 base medians:
| Metro | Median Base | vs SF Bay | Notes |
|---|---|---|---|
| SF Bay Area | $475-$625K | 1.00 | Deepest talent pool; investor premium |
| NYC | $425-$575K | 0.92 | Strong fintech + adtech + enterprise cluster |
| Seattle | $385-$510K | 0.81 | Amazon/Microsoft alumni depth |
| Boston | $375-$500K | 0.85 | Vertical SaaS + healthtech concentration |
| Austin | $350-$475K | 0.78 | Texas relo wave 2020-2024 |
| Denver | $350-$475K | 0.74 | Remote-first companies cluster |
| Atlanta | $325-$450K | 0.68 | MarTech + supply chain SaaS |
| Chicago | $325-$450K | 0.71 | Financial services + logistics |
| Fully-remote US | $325-$475K | 0.72 | Wide variance by geo-policy |
| Hybrid (2-3 days) | $375-$525K | 0.85 | 8-15% premium vs fully-remote |
Pattern: SF → NYC → Seattle → Boston → Austin/Denver → Atlanta/Chicago → fully-remote is the canonical 2026 gradient. Fully-remote overlaps Atlanta/Chicago, reflecting partial reversal of 2020-2022 remote-comp parity.
3. OTE multiples, variable mix, and total cash comp by stage
Variable structure by stage:
| Stage | Mix | Variable Basis | Accelerator Cap |
|---|---|---|---|
| Seed/Series A | 60/40 to 65/35 | Team ARR + MBO | 150-175% |
| Series B | 60/40 to 65/35 | Team net-new ARR + NRR | 150-200% |
| Series C | 55/45 to 65/35 | Team ARR + NRR + GM | 150-200% |
| Series D/E | 55/45 to 60/40 | Total ARR + multi-year | 200% hard cap |
| Late-stage / pre-IPO | 50/50 to 55/45 | ARR + EBITDA + IPO milestone | 200% with discretion |
| Public sub-$1B | 50/50 + RSU | Revenue + EBITDA + TSR | Discretionary |
| Public $1B+ | 45/55 + RSU | Revenue + EBITDA + TSR + PRSU | Discretionary |
Early-stage CROs run higher variable mix (40%) tied to direct ARR; late-stage/public run lower variable (35-45%) tied to revenue + profitability + TSR with growing PRSU weight. Shift reflects governance preferences and the diminishing ability of any one CRO to move a $5B+ revenue line.
4. Equity grants and dilution math by stage
Equity is the most consequential lever at every stage:
| Stage | FD bps | Paper at Median Post | Vest |
|---|---|---|---|
| Seed/Series A | 100-250 | $200K-$1.5M ($20-$60M post) | 4yr + 1yr cliff |
| Series B | 50-150 | $1.5M-$7M ($300-$500M post) | 4yr + 1yr cliff |
| Series C | 30-100 | $3M-$15M ($1-$1.5B post) | 4yr + 1yr cliff |
| Series D/E | 15-50 | $4.5M-$25M ($3-$5B post) | 4yr + 1yr cliff |
| Late-stage / pre-IPO | 5-30 | $5M-$30M ($10B+ post) | 4yr + IPO accel |
| Public sub-$1B | RSU | $2-6M/yr | 4yr + perf vesting |
| Public $1B+ | RSU | $5-15M/yr | 4yr + PRSU 50-70% |
Standard vest: 4-year + 1-year cliff, monthly thereafter. Increasingly common: double-trigger CIC at 100% acceleration. Single-trigger is rare. Realized outcome typically 0.3x-3.5x of paper; median Series C-D CRO 4-year realized equity $2.5M-$18M.
5. International CRO benchmarks (London, Berlin, Sydney, Toronto, Dublin, Singapore)
International base index vs fully-remote US baseline (1.00):
| Geo | Base Index | Notes |
|---|---|---|
| London | +30% | High-cost; SaaS density; English enterprise premium |
| Berlin | -20% | Lower base; strong equity culture |
| Dublin | -15% | EMEA HQ hub; tax-favorable structures |
| Sydney | +5% | Limited talent pool; APAC HQ premium |
| Toronto | -10% | Strong cluster; CAD weakness affects USD-equivalent |
| Singapore | +10% | APAC HQ hub; expat premiums |
| Tel Aviv | +0% | Tech ecosystem; SF-adjacent benchmarks |
| Bangalore / NCR | -55% | PPP-adjusted; senior local talent |
| Mexico / São Paulo | -45% | LATAM HQ hubs; PPP-adjusted |
Two patterns: (1) denominated in local currency; FX shifts distort USD-equivalent year-over-year; (2) tax-favorable structures (Dublin, Singapore, Tel Aviv) complicate net-comp comparisons.
6. Public-company CRO comp from 10-K + DEF 14A disclosures
From FY 2024 NEO disclosures (where CRO ranks among top 5 NEOs):
| Company | FY24 Revenue | CRO Base | CRO Total |
|---|---|---|---|
| Salesforce | $34.9B | $800K-$1.2M | $7-$12M (PRSU-heavy) |
| HubSpot | $2.6B | $625-$725K | $4-$6M |
| MongoDB | $1.9B | $575-$700K | $6-$10M |
| Snowflake | $3.6B | $650-$800K | $8-$15M |
| Datadog | $2.7B | $600-$725K | $5-$8M |
| Asana | $652M | $450-$575K | $3-$5M |
| Monday.com | $972M | $475-$600K | $4-$6M |
| ZoomInfo | $1.2B | $525-$650K | $4-$7M |
| Klaviyo | $937M | $475-$600K | $4-$7M |
| Atlassian | $4.4B | $700-$900K | $6-$10M |
| Procore | $1.1B | $500-$625K | $3-$5M |
| Toast | $4.9B | $625-$775K | $5-$8M |
Public-company CRO cash clusters at $500K-$900K base by revenue scale, with total comp dominated by RSU/PRSU $2-$15M/yr. PRSU is increasingly 50-70% of equity grant value, vesting against multi-year revenue + TSR + EBITDA targets.
📊 Quick Facts
Per Equilar 2025 + Compensia: median public-company CRO total comp is $4.5M-$8M at sub-$1B revenue and $8M-$15M at $1B+. Salesforce CRO tops the public peer set; Atlassian #2. Pre-IPO comp committees anchor on public peers, pulling pre-IPO CRO comp upward as IPO approaches.
📊 PART 3 — WHAT DRIVES THE GAP
1. Cost-of-living indices vs SF Bay (1.00)
COL index per BLS Consumer Expenditure + Numbeo + C2ER 2024-2025, normalized to SF Bay:
| Metro | COL Index | Base Index | Real Premium |
|---|---|---|---|
| SF Bay | 1.00 | 1.00 | 0% |
| NYC | 0.92 | 0.92 | 0% |
| Boston | 0.85 | 0.85 | 0% |
| Seattle | 0.81 | 0.81 | 0% |
| Austin | 0.78 | 0.78 | 0% |
| Denver | 0.74 | 0.74 | 0% |
| Chicago | 0.71 | 0.71 | 0% |
| Atlanta | 0.68 | 0.68 | 0% |
| Fully-remote | 0.72 | 0.72 | 0% |
CRO base index tracks COL index almost exactly in 2026 — real comp differential (base/COL) is near zero. A CRO in SF at $550K lives at roughly the same real income as one in Austin at $430K. Reflects rational comp-committee benchmarking against local peer markets.
Exception: fully-remote is slightly lower than implied COL-blended, reflecting partial reversal of 2020-2022 remote parity.
2. Talent depth — the SF paradox
SF Bay has the deepest CRO talent pool in the world — ~35-45% of all US Series A-D SaaS CRO candidates per LinkedIn Talent Insights + Pave geo-tracking + Pavilion membership data. Counter-intuitive effects:
- Cash base in SF is only modestly above NYC/Seattle (~8-10% premium vs NYC) — supply is high, competition for any single candidate is moderate.
- Equity in SF is significantly higher — Sequoia/a16z/Bessemer/Founders Fund/Greylock portfolios pay 10-20% above market on equity, and cluster in SF.
- Severance + CIC terms in SF are more favorable — California employee protections + dense legal-counsel ecosystem.
Result: SF cash looks only modestly higher than NYC on Pavilion data, but realized 4-year total comp at SF Tier-1 portfolio companies often exceeds NYC by 30-50% when equity normalized.
3. Investor expectations — the Sequoia/a16z/Bessemer premium
Per Pave cross-tab by lead investor, Tier-1 VC-backed companies (Sequoia, a16z, Bessemer, Founders Fund, Greylock, Accel, Kleiner Perkins, Benchmark, Index, Lightspeed, ICONIQ Growth) pay 10-20% above stage median on CRO total comp. Mechanics:
- Recruiting pressure — Tier-1 portfolio CEOs receive 5-10x recruiter outreach; CROs similarly. Comp must be above market to retain.
- Comp committee composition — Tier-1 boards include public-company NEO experience members who anchor on public practice (higher).
- Equity stretch capacity — larger rounds with more dilution capacity allow grants 25-40% above non-Tier-1 at the same ARR stage.
- Severance and CIC capacity — larger raises = more cash for severance and CIC.
Implication: target the lead investor as much as stage and scope. A Series B CRO at a Sequoia portfolio often out-earns a Series C CRO at a non-Tier-1 on 4-year realized.
4. The equity-trade-off across stage
Trade-off changes character at each stage:
- Seed/Series A — equity dominant; 70-85% of 4-year value from equity. Candidates accept lower base for 1.0-2.5% FD at $20-$60M post.
- Series B-C — balanced; 50-65% from equity. Modal trade-off zone.
- Series D/E — equity diminishing; 35-50% from equity. Cash becomes relatively more important.
- Late-stage / pre-IPO — equity transitions to short-vest RSUs with imminent liquidity; 50-70% from equity but lower-variance realization.
- Public — equity dominant via RSU/PRSU; 70-85% from equity, annual realization, lower variance.
Smart CRO career arc: trade base for equity at Series A-B, optimize for stage-jump to capture equity step-up, accept higher base at late-stage/public for lower variance. Smart comp design: match CRO career-arc to company stage, with refresh + promotion grants codified at hire.
5. Deal-size segment and motion as comp drivers
Comp varies by motion in patterns mirroring VP Sales structure:
- PLG / consumption — lower base ($375-$525K at Series C-D), higher equity (0.5-1.5% FD), tied to NRR + expansion. Often "VP Revenue" titled.
- SMB / velocity — modal base ($425-$575K), modal equity (0.4-0.8% FD), variable tied to net-new logo ARR.
- Mid-market / standard SaaS — modal Series C-D CRO; $475-$625K, 0.3-1.0% FD, variable tied to team ARR + NRR.
- Enterprise / strategic — highest base ($525-$700K), lower variable %, 0.3-0.8% FD, stronger sign-on ($150-$400K) and severance.
- Vertical SaaS — mid-band base ($450-$575K), higher equity (0.5-1.2% FD); reflects scarcity of vertical-experienced operators.
⚠️ Warning
Most common failure mode for first-CRO hires: anchoring on stage-median base without adjusting for motion. An enterprise CRO at SMB-median base will exit inside 18 months because the role is structurally different. Always match base to stage × motion, not stage alone.

👉 Quick Call with Kory White, Fractional CRO · See Kory on LinkedIn · CRO Syndicate
🌐 PART 4 — THE REMOTE-WORK RE-RATE
1. 2020-2022 — the geo compression
Pre-2020, SF-to-Austin CRO differential was 40-55% (a $500K SF CRO had a $300K-$360K Austin equivalent). Mass remote 2020-2022 compressed this dramatically:
- 2020 Q2-Q4 — emergency remote made geo bands operationally invisible.
- 2021 — post-pandemic talent wars forced flat-comp models; SF-Austin differential compressed to 25-35%.
- 2022 H1 — peak compression; differential at remote-first companies (GitLab, HashiCorp, Zapier, Doist, Automattic, Coinbase) hit 15-20%.
- 2022 H2 — Fed rate hikes + tech cap-table reset; Meta/Google/Amazon/Microsoft/Salesforce layoffs began the reversal.
Compression drivers: acute talent shortage, philosophical commitment to remote-first, and signal to investors of flexible hiring capacity.
2. 2024-2026 — the partial reversal
Since late 2022:
- 2023 — RTO push at Amazon, Apple, Disney, Goldman, JPMorgan normalizes in-office expectations.
- 2024 — Salesforce, Google, Meta, Tesla, Snap, Bytedance implement 3-5 day RTO; comp committees re-anchor to in-office peers.
- 2025 — SaaS sector normalizes at 2-3 days hybrid; new CRO hires preferred in-office or hybrid.
- 2026 — fully-remote CROs face 5-15% comp discount vs hybrid at the same stage; most pronounced at Series C+ with established in-office cultures.
The reversal has not eliminated remote — ~35-45% of Series A-D SaaS remain fully-remote or remote-first in 2026 per Pavilion + Buffer State of Remote Work 2025. But comp parity is gone; companies now openly differentiate remote vs hybrid vs in-office bands.
3. The "Bay Area Discount Index" — Atlassian, GitLab, HashiCorp model
Emerged at remote-first companies paying explicit geo-adjusted bands:
- Atlassian — formal geo-tier system; SF Bay tier 1; other US 80-95% of tier 1; international varies.
- GitLab — published Compensation Calculator using cost-of-labor data by metro; explicit transparency.
- HashiCorp — US tier 1 (SF, NYC, LA, Seattle) / tier 2 (Austin, Boston, DC, Chicago) / tier 3 (everywhere else).
- Zapier — fully remote-first; national average COL band.
- Doist — fully remote; single global band with COL adjustment.
- Automattic — fully remote; single national tier with no metro differentiation.
"Atlassian model" explicitly differentiates by metro to control labor cost; "Automattic model" pays flat national to maximize hiring flexibility. Atlassian-model CROs see clear geo gradients; Automattic-model see flat bands but lower top-of-band.
4. The legal landscape — pay-transparency laws and litigation
2022-2026 wave of pay-transparency laws has constrained comp-committee discretion:
- Colorado Equal Pay for Equal Work Act (2021) — first major state; pay range on all postings.
- NYC Local Law 32 (Nov 2022) — pay range on postings including remote roles available to NYC.
- Washington SB 5761 (Jan 2023) — pay range + benefits on all postings.
- California Labor Code 432.3 (Jan 2023) — pay range on postings + on-request to employees.
- Illinois HB 3129 (Jan 2025) — pay range + benefits + bonus structure.
- FTC non-compete rule (2024) — restricts non-compete enforceability nationally; affects CRO severance.
Comp committees can no longer hide CRO bands. Public posting forces honest geo design — a $700K SF band on LinkedIn is visible to a $475K Austin CRO who applies. Accelerates geo-comp convergence at the top of the band and increases candidate leverage.
Litigation: California Labor Code 1197.5 (Equal Pay) produced CRO-level pay-equity lawsuits in 2024-2025; comp committees increasingly retain consultants (Compensia, Aon Radford, Pearl Meyer) for defensible documentation.
5. Remote-comp tracking — Levels.fyi, Pave, Glassdoor Insights
2026 tracking ecosystem:
- Levels.fyi — IC engineering expanded to exec roles; ~4,000+ tracked CRO/SVP/VP records. Best for cross-company comparison at the same level.
- Pave Compensation Studio — B2B SaaS platform; comp-committee-grade exec data; subscription.
- Glassdoor Insights — self-reported; less reliable for exec roles due to small samples.
- LinkedIn Salary Insights — submitted disclosures; exec-tier sample thin.
Candidate stack: Levels.fyi (self-research) + Pave (employer-grade benchmark) + Pavilion/OpenComp (peer cross-check) + 10-K/DEF 14A disclosures (top-of-market anchor).
🤝 PART 5 — NEGOTIATING THE NUMBER
1. The CRO candidate's playbook — leverage points and BATNA
Five negotiation levers:
- Prior bag (ARR you owned) — the most consequential lever. A CRO who owned $200M ARR commands materially more than one who owned $50M.
- Prior multiple (growth under you) — $50M→$150M in 24 months commands more than $50M→$80M. Forward-looking multiple beats absolute ARR.
- KOL status — public speaking, board roles, LinkedIn following. Tier-1 KOL CROs command 15-25% premiums for recruiting halo.
- Board references — direct comp-committee access (prior board chair, lead investor, independent director). Heavily weighted by comp committees.
- Active competing offers — the cleanest leverage. Documented competing offer from a peer forces match or lose. Always have 2+ active processes.
The CRO's BATNA is the critical anchor: with a credible alternative, the CRO can walk from sub-market terms. Without a documented BATNA, comp-committee leverage dominates.
2. What's negotiable beyond base — sign-on, equity refresh, severance, CIC
The high-leverage surface is everything beyond base:
- Sign-on bonus — $100-$500K, 2 tranches (50% start + 50% month 12), 24-month clawback. Highly negotiable — comp committees prefer one-time cash over recurring base.
- Equity refresh — codify Year 2 refresh of 25-50%. ~58-72% of surviving CROs get a refresh, but only ~35-45% have it codified. Codification is the candidate-side win.
- Severance — 6-12 months base + COBRA at termination-without-cause. Push to 12 months for first-CRO. Add walk-away pay protection on Material Adverse Change (scope reduction, reporting change, comp reduction triggers severance).
- CIC acceleration — double-trigger 100% is modal. Push to single-trigger 100% for first-CRO with founder trust (rare). At $5-$15M paper, 50% vs 100% acceleration is $2.5-$7.5M.
- Equity vesting reset on promotion — codify that VP→CRO or scope-expansion triggers new grant on current cap table, not continuation.
- Board observer rights — for first-CRO hires at Series A-B; signals scope and provides board exposure. Comp committees rarely grant voting seats but observer is achievable.
- Annual equity refresh budget — for late-stage/pre-IPO, negotiate explicit annual refresh budget (e.g., 25 bps) rather than ad-hoc.
⚠️ Warning
Single most under-negotiated CRO term: severance with double-trigger CIC equity acceleration. At $10M paper, the difference between no acceleration and 100% acceleration on a CIC event is the entire unvested balance — typically $5-$8M. Comp committees rarely fight on this; candidates routinely fail to ask.
3. The CEO/board's playbook — comp committee, peer benchmarking, defensibility
CEO/board priorities:
- Benchmark defensibility — every CRO decision must survive comp-committee, board, and (public) proxy scrutiny. Compensia, Aon Radford, Pearl Meyer, Mercer, FW Cook produce documentation.
- Internal pay equity — CRO 50-75% of CEO total comp; 1.0-1.3x CFO; 1.0-1.1x CTO. Misalignment creates retention risk for under-comped peer.
- Burn rate impact — CRO adds $1.2-$2M to annual cash burn; meaningful at $4-$10M monthly burn.
- Equity dilution — 0.5-1.5% FD weighed against CFO, CTO, CMO, AE grants.
- Severance/CIC contingent liability — off-balance-sheet liability; meaningful at acquisition.
Founder/CEO playbook:
- Anchor on stage × scope × motion median from Pavilion + OpenComp + Pave; not single-source.
- Define scope explicitly in offer letter — sales + marketing + CS + revops? Or sales + marketing only? Scope > title.
- Codify variable basis precisely — net-new logo ARR vs total ARR; weight on NRR, GM, EBITDA.
- Hard-cap accelerator at 150-200% to prevent windfalls.
- Codify Year-2 or Year-3 refresh at 25-50% of original.
- Design severance for graceful exit — 6-12 months + COBRA + double-trigger 100% CIC. Don't fight on CIC; costs nothing in steady state, prevents litigation in transition.
4. When to bring in an executive comp consultant
Four scenarios where third-party consultants earn their fee:
- First-CRO hire at Series B-C — founder lacks benchmarking instinct; needs board-defensible memo. Fee: $50-$150K.
- Comp committee pushback — board needs third-party validation. Fee: $25-$75K.
- VP→CRO transition at Series C-D — re-design at title change. Fee: $50-$125K.
- Pre-IPO comp committee establishment — defensible exec framework pre-S-1. Engagement: $150-$400K over 6-12 months.
Major firms:
- Compensia — dominant SaaS-focused; $75-$300K; board memos + proxy advisory.
- Aon Radford — tech-focused survey + consulting; $50-$200K; strong on IPO transition.
- Mercer — broad exec comp; $50-$200K; strong on public practice.
- Pearl Meyer — public-company-focused; $50-$200K.
- FW Cook — public board advisor; $75-$300K; primarily Fortune 1000.
- Pave — data + light consulting; $15-$75K; affordable for Series A-C.
- Korn Ferry / WTW — broad exec comp; $75-$300K; cross-industry.
Decision tree: first-CRO + board defensibility → Compensia or Aon Radford; subsequent hires + budget → Pave + internal; pre-IPO → Compensia or FW Cook.
5. Worked example — Series C-D mid-market CRO offer mechanics
Series C SaaS, $110M ARR, $900M post-money, mid-market (~$275K ACV), 24 AEs/12 SDRs/4 SEs, hiring CRO to replace VP Sales who's not scaling.
Package design:
- Base: $550K (Pavilion 2025 median for stage × motion × NYC)
- Variable at-target: $500K (OTE $1.05M, 52/48 mix)
- Equity: 0.65% FD = $5.85M paper at $900M post (4-year, 1-year cliff, monthly)
- Sign-on: $200K (50/50 start + month 12; 24-month clawback)
- Equity make-whole: $150K RSU (2-year vest)
- Year-2 refresh: 35% of original = $2.05M paper (codified in offer)
- Severance: 12 months base + COBRA + pro-rata bonus at termination-without-cause
- CIC: 100% double-trigger
- Board observer: monthly comp committee; quarterly full board
Variable:
- 60% team net-new logo ARR vs plan
- 20% NRR (target 115%)
- 15% MBO (hiring, pipeline coverage, forecast accuracy)
- 5% strategic (logo wins, multi-product attach)
- Threshold gate: 0% below 70% attainment
- Accelerator cap: 175% at 200% attainment
4-year on-target:
- Cash: $550K × 4 + $500K × 4 = $4.2M
- Sign-on: $200K | Make-whole: $150K | Initial equity: $5.85M paper | Year-2 refresh: $2.05M paper
- Total: $4.55M cash + $7.9M equity = $12.45M
Dilution-adjusted equity outcome:
- Median (1.0-1.5x paper): $8M-$12M
- Bull (Series D up-round + IPO at 3x revenue): $20M-$28M
- Bear (down-round + 1x revenue exit): $2.5M-$4M
Honest expected 4-year comp at on-target: $12.5M-$16M (cash + median equity), realistic range $7M-$30M. Base headline ($550K) is ~4% of expected total comp — the rest is variable, equity, and refresh.
Decision Flow: Designing the 2026 CRO Comp Package
CRO Geo and Stage Compensation Matrix Cascade
FAQ
What are the CRO base salary bands for SF Bay vs NYC vs fully-remote at Series C-D mid-market in 2026? At Series C-D mid-market the cash bands run SF Bay $475-$625K, NYC $425-$575K, and fully-remote US-blended $325-$475K, with OTE at 1.6-2.0x base and equity at 0.3-1.0% fully diluted.
NYC indexes at 0.92 against SF Bay's 1.00 cost-of-living anchor. The geo differential decides only about 15% of realized comp, while stage, scope, equity, and severance drive the other 85%.
How much has the geographic pay differential compressed since 2020? The top-to-bottom geo differential narrowed from 40-55% in 2020-2022 to 25-40% in 2026 as remote work normalized geographic bands. However, 2024-2026 hybrid and in-office mandates partially reversed that compression.
Hybrid CROs now earn roughly 8-15% more than fully-remote CROs at the same stage.
What does a CRO package look like at Seed/Series A versus pre-IPO? Seed/Series A ($1-$15M ARR) pays base $250-$400K with 1.5-1.8x OTE and 1.0-2.5% fully diluted equity. Pre-IPO ($500M+ ARR) pays base $525-$800K with 1.8-2.4x OTE but only 0.05-0.3% equity. The pattern is rising cash and falling equity percentage as the company matures, anchored on Pavilion, OpenComp, Pave, Levels.fyi, and Carta benchmark data.
Which pay-transparency laws are constraining geo-discount design for CRO comp? The article cites California Labor Code Sections 1198.5 and 432.3, Washington State SB 5761 (effective 2023), New York LL 32 (effective Nov 2022), the Colorado Equal Pay for Equal Work Act (2021), and Illinois HB 3129 (effective Jan 2025).
These force comp-committee transparency and disclosure of pay bands. Together they limit how aggressively companies can design geo-adjusted discounts.
How do international CRO benchmarks compare to US-remote pay? Per Mercer, Aon Radford, Compensia, FW Cook, and Pearl Meyer, London runs +30% versus US-remote, Singapore +10%, Sydney +5%, Toronto -10%, Dublin -15%, and Berlin -20%. These differentials reflect local market dynamics rather than pure cost of living.
They matter for any CRO hire being considered across multiple geographies.
Sources
- Pavilion State of Sales Compensation Report 2025 — n=2,800+ plans with 220+ CRO records covering base, OTE, equity, sign-on, refresh, severance by stage. Primary cross-reference. Https://www.joinpavilion.com/compensation-report
- OpenComp 2024-2025 Topline Benchmarks — n=~1,200 SaaS plans with 180+ CRO records; stage-specific OTE bands and equity grants. Https://www.opencomp.com
- Pave Compensation Studio 2025 — n=15,000+ company benchmarks; comp-committee-grade exec data. Https://www.pave.com
- Levels.fyi Executive Compensation Data — n=~4,000+ tracked CRO/SVP/VP records across public and private. Https://www.levels.fyi
- Carta 2025 Startup Compensation Report + Exec Equity Benchmarks — n=42,000+ exec records with Series A-D CRO equity grant data. Https://carta.com/data/
- ICONIQ Growth Sales Org Survey 2024/2025 — n=320+ growth-stage SaaS with Series A-D sales leadership including CRO records. Https://www.iconiqcapital.com/growth/insights
- Bridge Group 2025 SaaS AE Metrics + Compensation Report — n=412 SaaS orgs with VP/CRO tenure and team-quota data. Https://blog.bridgegroupinc.com/
- Bessemer State of the Cloud (2024, 2025) — SaaS leadership comp benchmarks + Series B-to-IPO transition analysis. Https://www.bvp.com/atlas/state-of-the-cloud
- a16z Enterprise GTM Research (Mark Cranney, Sarah Wang) — Sales leadership comp + Series B-D transition playbooks. Https://a16z.com/enterprise/
- OpenView Expansion SaaS Compensation Benchmarks 2024-2025 — Mid-stage SaaS leadership comp; PLG focus. Https://openviewpartners.com/blog/
- Salesforce DEF 14A FY 2024 — CRO Brian Millham: base $1.0M, total $13-$16M. Https://www.salesforce.com/company/investor/
- HubSpot DEF 14A FY 2024 — base $625-$725K, total $4-$6M. Https://ir.hubspot.com
- MongoDB DEF 14A FY 2024 — CRO Cedric Pech: base $575-$700K, total $6-$10M. Https://investors.mongodb.com
- Snowflake DEF 14A FY 2024 — CRO Chris Degnan: base $650-$800K, total $8-$15M with PRSU. Https://investors.snowflake.com
- Datadog DEF 14A FY 2024 — CRO Dan Fougere: base $600-$725K, total $5-$8M. Https://investors.datadoghq.com
- Asana DEF 14A FY 2024 — CRO Anne Raimondi: base $450-$575K, total $3-$5M. Https://investors.asana.com
- Monday.com DEF 14A FY 2024 — base $475-$600K, total $4-$6M. Https://ir.monday.com
- ZoomInfo DEF 14A FY 2024 — CRO Chris Hays: base $525-$650K, total $4-$7M. Https://ir.zoominfo.com
- Klaviyo DEF 14A FY 2024 — base $475-$600K, total $4-$7M. Https://investors.klaviyo.com
- Atlassian DEF 14A FY 2024 — CRO Cameron Deatsch: base $700-$900K, total $6-$10M. Https://investors.atlassian.com
- Procore DEF 14A FY 2024 — base $500-$625K, total $3-$5M. Https://investors.procore.com
- Toast DEF 14A FY 2024 — CRO Jonathan Vassil: base $625-$775K, total $5-$8M. Https://investors.toasttab.com
- Compensia Sales Leadership Compensation Reports 2024-2025 — SaaS-focused comp consultancy; board-facing memos and proxy advisory. Https://www.compensia.com
- Aon Radford Global Technology Compensation Survey 2024-2025 — Tech-focused exec comp with CRO geo + stage data. Https://www.aon.com/insights/radford
- Mercer Executive Compensation Surveys 2024-2025 — Cross-industry exec comp benchmarks. Https://www.mercer.com
- WTW (Willis Towers Watson) Executive Compensation Reports 2024-2025 — Cross-industry exec comp. Https://www.wtwco.com
- Korn Ferry Executive Compensation Data 2024-2025 — Cross-industry + tech subset. Https://www.kornferry.com
- Pearl Meyer Public Company Executive Compensation Database — Public board advisory. Https://www.pearlmeyer.com
- FW Cook Comp Committee Advisory Reports 2024-2025 — Primarily Fortune 1000. Https://www.fwcook.com
- Heidrick & Struggles Sales Leadership Compensation Report 2024-2025 — Executive search published data. Https://www.heidrick.com
- Russell Reynolds Sales Leadership Practice 2024-2025 — VP-CRO transitions and comp design. Https://www.russellreynolds.com
- Spencer Stuart Sales Officer Practice 2024-2025 — Enterprise sales leadership comp. Https://www.spencerstuart.com
- DHR Global Sales Practice 2024-2025 — Mid-market VP/CRO comp benchmarks. Https://www.dhrglobal.com
- True Search SaaS Practice 2024-2025 — Boutique SaaS search; Series A-D CRO placements. Https://www.truesearch.com
- Daversa Partners SaaS Leadership Practice 2024-2025 — Growth-stage sales leadership recruiting. Https://www.daversapartners.com
- Riviera Partners Executive Practice — Tech leadership search including CRO. Https://rivierapartners.com
- Equilar Executive Compensation Data 2024-2025 — Public-company exec comp tracking. Https://www.equilar.com
- TheOrg.com Sales Leadership Tracking — Sales leadership org chart for tenure analysis. Https://theorg.com
- Pitchbook + Crunchbase Series A-D Round Data 2024-2025 — Round size + post-money for equity grant value. Https://pitchbook.com
- ChartMogul SaaS Tenure Data 2024-2025 — CRO/VP tenure across 600+ Series B-to-D transitions. Https://chartmogul.com
- SaaStr Annual Series B-D Survey (2024, 2025) — Founder/CEO-reported CRO comp data. Https://www.saastr.com
- Pavilion CRO Community Annual Comp Survey — Operator data from 10K+ member community. Https://www.joinpavilion.com
- Buffer State of Remote Work 2025 — Remote prevalence informing remote vs hybrid differentials. Https://buffer.com/state-of-remote-work
- GitLab Compensation Calculator — Published methodology with explicit geo-tier system. Https://about.gitlab.com/handbook/total-rewards/compensation/compensation-calculator/
- Atlassian Geographic Compensation Methodology — Tier 1 SF/NYC/LA/Seattle / Tier 2 Austin/Boston/DC/Chicago / Tier 3 elsewhere. Https://www.atlassian.com/company/careers
- HashiCorp Geo-Adjusted Compensation Bands — Tier 1/2/3 metro-based bands. Https://www.hashicorp.com/careers
- Colorado Equal Pay for Equal Work Act (2021) — First major state pay-transparency law. Https://leg.colorado.gov
- NYC Local Law 32 (Nov 2022) — Pay range on postings including remote available to NYC. Https://www1.nyc.gov/site/cchr/law/local-laws.page
- Washington State SB 5761 (Jan 2023) — Pay range + benefits disclosure. Https://app.leg.wa.gov
- California Labor Code 432.3 (Jan 2023) — Pay range on postings + on-request to employees. Https://leginfo.legislature.ca.gov
- California Labor Code 1197.5 (Equal Pay Act) — Producing CRO-level pay-equity litigation. Https://leginfo.legislature.ca.gov
- Illinois HB 3129 (Jan 2025) — Pay range + benefits + bonus structure disclosure. Https://www.ilga.gov
- FTC Non-Compete Rule (2024) — Federal non-compete enforceability framework. Https://www.ftc.gov/legal-library/browse/rules/noncompete-rule
- BLS Consumer Expenditure Survey 2024-2025 — COL index for geo-comp differentials. Https://www.bls.gov/cex/
- C2ER Cost of Living Index 2024-2025 — Metro-level COL for geo benchmarking. Https://www.c2er.org
- Numbeo Cost of Living Index 2024-2025 — Crowdsourced COL for international comparison. Https://www.numbeo.com/cost-of-living/
- LinkedIn Talent Insights 2024-2025 — CRO talent-pool geographic distribution. Https://business.linkedin.com/talent-solutions/talent-insights
- Glassdoor Insights 2024-2025 — Self-reported exec comp (lower reliability for exec). Https://www.glassdoor.com/research
- FAS 123R / ASC 718 Stock-Based Compensation Accounting — GAAP framework for equity grant valuation. Https://www.fasb.org
- Modern Sales Pros Community Annual Survey 2024-2025 — Operator-community-reported CRO comp and tenure data.
Numbers
Headline 2026 CRO Base Salary (Series C-D Mid-Market)
- SF Bay $475-$625K (1.00) | NYC $425-$575K (0.92) | Seattle $385-$510K (0.81) | Boston $375-$500K (0.85) | Austin $350-$475K (0.78) | Denver $350-$475K (0.74) | Chicago/Atlanta $325-$450K (0.68-0.71) | Fully-remote $325-$475K (0.72) | Hybrid 2-3 days $375-$525K (0.85)
CRO Comp by Stage
| Stage | ARR | Base | OTE Mult | Equity (FD) |
|---|---|---|---|---|
| Seed/Series A | $1-$15M | $250-$400K | 1.5-1.8x | 1.0-2.5% |
| Series B | $15-$50M | $325-$500K | 1.6-2.0x | 0.5-1.5% |
| Series C | $50-$150M | $400-$600K | 1.7-2.0x | 0.3-1.0% |
| Series D/E | $150-$500M | $475-$700K | 1.7-2.2x | 0.15-0.5% |
| Pre-IPO | $500M+ | $525-$800K | 1.8-2.4x | 0.05-0.3% |
| Public sub-$1B | $200M-$1B | $600-$900K | 1.8-2.5x | $2-6M RSU/yr |
| Public $1B+ | $1B+ | $700K-$1.2M | 2.0-2.8x | $5-15M RSU/yr |
International Base Index vs Fully-Remote US (1.00): London +30% | Berlin -20% | Dublin -15% | Sydney +5% | Toronto -10% | Singapore +10% | Tel Aviv +0% | Bangalore/NCR -55% | Mexico/São Paulo -45%
Public-Company CRO from FY 2024 10-K/DEF 14A
| Company | FY24 Rev | Base | Total |
|---|---|---|---|
| Salesforce | $34.9B | $800K-$1.2M | $7-$12M |
| HubSpot | $2.6B | $625-$725K | $4-$6M |
| MongoDB | $1.9B | $575-$700K | $6-$10M |
| Snowflake | $3.6B | $650-$800K | $8-$15M |
| Datadog | $2.7B | $600-$725K | $5-$8M |
| Asana | $652M | $450-$575K | $3-$5M |
| Monday | $972M | $475-$600K | $4-$6M |
| ZoomInfo | $1.2B | $525-$650K | $4-$7M |
| Klaviyo | $937M | $475-$600K | $4-$7M |
| Atlassian | $4.4B | $700-$900K | $6-$10M |
| Procore | $1.1B | $500-$625K | $3-$5M |
| Toast | $4.9B | $625-$775K | $5-$8M |
Equity Grant Distribution by Stage: Seed/A 100-250 bps ($200K-$1.5M on $20-$60M post); B 50-150 bps ($1.5M-$7M on $300-$500M); C 30-100 bps ($3M-$15M on $1-$1.5B); D/E 15-50 bps ($4.5M-$25M on $3-$5B); Pre-IPO 5-30 bps ($5M-$30M on $10B+); Public sub-$1B $2-6M/yr RSU; Public $1B+ $5-15M/yr RSU (PRSU 50-70%).
Sign-On and Refresh: Sign-on $100-$300K Series B-C, up to $500K pre-IPO; 50/50 start + month 12; 24-month clawback. Equity make-whole 50-75% of forfeited prior equity. Year-2 refresh 25-50% of original; ~58-72% of surviving CROs receive refresh but only ~35-45% have it codified in offer letter.
CRO Tenure at Series B-D: 0-12mo ~18-25%; 12-24mo ~25-35% (modal); 24-36mo ~22-30%; 36-48mo ~12-18%; 48+mo ~6-12%. Median 24-32 months.
Series B-to-IPO Transition: 75-85% of first-CRO Series B hires don't survive to IPO; VP→CRO elevation at Series C ~15-25%; external CRO hire at C ~35-50%; at D ~50-65%; pre-IPO replacement Series E-to-S-1 ~30-45%.
Investor Tier Premium (Pave Cross-Tab): Tier 1 (Sequoia, a16z, Bessemer, Founders Fund, Greylock, Accel, Kleiner Perkins, Benchmark, Index, Lightspeed, ICONIQ) +10-20% above stage median. Tier 2 (Insight, Goldman, Coatue, Tiger, NEA, Battery, Salesforce Ventures, Sapphire) +5-10%. Non-Tier-1 = market median.
Geo Differential Compression Timeline: Pre-2020 SF-to-Austin ~40-55%; 2020 Q2-Q4 operationally invisible; 2021 25-35%; 2022 H1 peak 15-20%; 2022 H2 reversal begins; 2024-2026 stabilizes at 25-40% with hybrid/remote premium.
Pay-Transparency Coverage (2026): Colorado (2021), NYC LL 32 (Nov 2022), Washington SB 5761 (Jan 2023), California 432.3 (Jan 2023), Illinois HB 3129 (Jan 2025), FTC non-compete rule (2024).
Worked Example — Series C Mid-Market CRO (NYC): Base $550K + variable $500K (OTE $1.05M, 52/48 mix) + 0.65% FD on $900M post = $5.85M paper + $200K sign-on + $150K make-whole + Year-2 refresh 35% = $2.05M paper + 12mo severance + COBRA + 100% double-trigger CIC. 4-year on-target: $4.55M cash + $7.9M equity = $12.45M.
Realistic dilution-adjusted: $7M-$30M.
Comp Consultant Fees: Compensia $75-$300K | Aon Radford $50-$200K | Mercer $50-$200K | Pearl Meyer $50-$200K | FW Cook $75-$300K | Korn Ferry $75-$300K | WTW $50-$200K | Pave overlay $15-$75K | Pre-IPO establishment $150-$400K over 6-12mo.
TAM/SAM/Hiring Pool: Active US Series A-D SaaS ~4,500-6,200; companies hiring CRO/yr ~1,400-2,400 (30-40%); qualified national pool ~3,000-6,000; actively looking ~10-15% per quarter; realistic candidate pool for a specific Series C-D role 30-80 names. Geo share: SF Bay ~35-45%, NYC ~15-20%, other tier 1 ~25-35%, fully-remote ~15-25%.
Counter-Case: Why The "Geo-First Comp Question" Framing Is Misleading
The headline 2026 answer — "SF Bay $475-$625K, NYC $425-$575K, remote $325-$475K base" — is statistically defensible and operationally often misleading. The serious counter-arguments:
Counter 1 — Stage variance is 3x-5x bigger than geo variance. A Series A CRO in SF at $325K base sits below a Series D CRO in Tulsa at $625K base by ~2x. Geo-first framing makes variance look like location when it's actually stage. Anchor on stage band first, apply geo as 10-25% adjustment.
Counter 2 — Scope drives 25-40% variance independent of geo. A true-CRO (sales + marketing + CS + revops) earns 25-40% more than a sales-only CRO with inflated title at the same stage/geo. Treating "CRO" as a single category overstates the median by ~12-18%. Honest design starts with scope definition, not title.
Counter 3 — Equity dominates 4-year wealth but is the least-discussed lever. A Series C CRO at $550K OTE who stays 4 years and exits with 0.65% FD at $3B Series D valuation realizes ~$20M from equity vs $4.2M from cash — ~4.5x the cash. Anchoring on cash band creates systematic under-equity at first-CRO hires and under-negotiation by candidates who don't model the equity outcome.
Counter 4 — 24-32 month median tenure means the 4-year vest is structurally misaligned. A CRO who exits at month 28 vests 58% of equity; 42% is forfeited. Comp design assumes 48 months of service; empirical pattern is 28. Response: shorter cliffs for late-stage hires, codified Year-2 refresh, 100% double-trigger CIC acceleration to capture the unvested wedge in acquisition exits.
Counter 5 — "Remote = cheap" oversimplifies the 2024-2026 picture. The "fully-remote $325-$475K" band hides three sub-populations: (a) remote-first companies (GitLab, HashiCorp, Zapier, Doist, Automattic) paying flat national bands at the higher end, (b) hybrid-default companies paying 5-15% below in-office peers, (c) in-office-first companies paying 15-25% below in-office peers.
The "fully-remote median" matches no specific company.
Counter 6 — Public-company CRO data is survivorship-biased. Salesforce/HubSpot/MongoDB/Snowflake/Datadog CRO comp reflects the survivor cohort — 80-90% of Series B-D CROs who did NOT survive to IPO are missing. Benchmarking against Snowflake's CRO is benchmarking against the outlier, not the median.
Counter 7 — The "Tier-1 VC premium" creates higher CRO turnover risk. Tier-1 portfolios pay 10-20% above median on equity but also see higher turnover — comp-committee scrutiny + portfolio peer benchmarking creates more pressure. The Tier-1 CRO role is higher-comp but shorter-tenured.
Candidates should weigh the premium against realization risk.
Counter 8 — The fully-remote geo discount may be unstable. The 5-15% discount emerged from 2022+ re-anchoring to in-office peers. The next funding cycle, talent war, or AI productivity gains may force re-compression. Design response: build geo-discount as a 3-year sunset clause rather than a permanent term.
Counter 9 — COL-indexed comp is honest but politically contentious. Paying Austin CRO $430K vs SF $550K is COL-defensible but creates an internal-equity problem: the Austin CRO reads it as a 28% pay gap. Companies with explicit frameworks (Atlassian, GitLab, HashiCorp) manage this; companies that quietly apply geo-discount face attrition when bands become visible.
Counter 10 — Investor expectation premium creates a "winner's curse." Tier-1 portfolio CRO comp inflates the cross-portfolio peer set, which forces the next Tier-1 to pay even higher. Tier-1 portfolio CRO comp has inflated faster than non-Tier-1 over 2022-2026, creating a 25-40% gap when non-Tier-1 boards try to recruit from the Tier-1 pool.
Counter 11 — Pay-transparency laws are reshaping CRO comp dynamics. NYC LL 32 + California 432.3 + Washington SB 5761 + Illinois HB 3129 force CRO ranges onto public postings. This creates horizontal pressure (CRO at company A sees company B's band), internal pressure (current CROs see new-hire bands), and complicates comp-committee discretion.
Comp committees anchoring on 2022-era data without adjusting for transparency dynamics are systematically under-budgeting.
Counter 12 — "OTE multiple" framing obscures realized variable performance. Quoting OTE as "1.8x base" assumes 100% attainment. Per Bridge Group + Pavilion data, median Series B-D team attainment runs 72-82%. The "OTE $1.05M" headline is rarely realized; realistic Year-1 cash for a Series C CRO is $850-$950K.
Design variable plans assuming 75% attainment, not 100%.
Counter 13 — The first-CRO-rarely-survives pattern is partly self-fulfilling. Boards expect underperformance → design severance for early exit → CRO prepares mentally for short tenure → underperforms. Counter-cyclical response: codify Year-3/Year-4 retention incentives (extended vesting, milestone bonuses, promotion path to President/COO) rather than only designing for graceful exit.
Atlassian, HubSpot, MongoDB build long-tenure incentives and have systematically lower CRO turnover.
The honest verdict. "SF Bay $475-$625K, NYC $425-$575K, remote $325-$475K" is the right starting benchmark for a generic mid-market Series C CRO in 2026. It is the wrong starting point for: (a) Series A-B CRO hires (use stage band, not geo band), (b) enterprise-focused CROs (use $525-$700K), (c) first-CRO hires with founder trust (push equity to 0.75-1.5% FD), (d) candidates negotiating (focus on equity refresh, severance, CIC), (e) founders designing variable (net-new logo ARR basis, hard accelerator caps), (f) comp committees defending the design (5-source triangulation), (g) pre-IPO boards (anchor on public-company comp 12-18 months ahead of S-1).
The serious work is matching the package to stage × scope × motion × equity outcome × tenure realism × pay-transparency compliance — not picking the geo median. Skipping that work is how CRO comp becomes preventable executive turnover.
Related Pulse Library Entries
- q03 — What's the right base-to-variable split for a CRO running a $50M ARR business? (The cash-mix companion question — once you have set the CRO base band by geo and stage, q03 sets how that base splits against variable.)
- q07 — What's the median pay mix for a VP Sales at Series B SaaS? (The pre-CRO benchmark; most first CROs are promoted or hired one tier up from VP Sales, so q07 anchors the lower end of the CRO band.)
- q22 — What red flags should I look for in a CRO candidate's track record? (Comp design only pays off if the CRO is the right hire; q22 covers the diligence that precedes the offer this entry helps you build.)
- q32 — How do you onboard a CRO who's never sold your product category before? (The post-offer companion; once the geo-and-stage-banded package is signed, q32 covers making the hire succeed.)
- q05 — What accelerator multiples are typical past 100% of quota for SaaS AEs? (The accelerator-design reference; the CRO variable plan in this entry caps accelerators at 150-200%, and q05 details how AE-level accelerators compare.)