
How'd you fix Choice Logistics's revenue issues in 2026?
 Curated byKory White · Fractional CRO · Maryland
 PULSEKNOWLEDGE LIBRARY
Quality
Certified

Choice Logistics's 2025 revenue stall stemmed from competing on cost against UPS and FedEx while ignoring field-service operators' core pain: parts must arrive at forward-stocking locations within 4–6 hours or service windows are missed, costing $8K–$22K per incident. The 2026 fix pivots to outcome-locked contracts guaranteeing parts velocity, first-visit-fix rates, and inventory turns.
The Revenue Problem: Cost-Arbitrage Death Spiral
Choice Logistics entered 2025 trapped in a cost-arbitrage positioning death spiral. Sub-$1B 3PLs cannot win on labor cost against UPS Supply Chain Solutions' global footprint and DHL's automation moat. Field-service buyers had already left Choice for volume players with better tech visibility. The company sold "we'll move your parts" but never tied success to field-technician uptime or parts-first-arrival-window SLAs. Buyers risked revenue loss if parts didn't arrive in 4–6 hours, yet Choice absorbed no accountability. This fractured forward-stocking-location (FSL) network visibility meant competitors with Flexport and project44 visibility stacks could dynamically reposition inventory while Choice operated 1990s-era static stocking-location planning. Every FSL outage cost field-service operators $8K–$22K in lost billable hours. There was no buyer-outcome integration layer—UPS Supply Chain Solutions bundles parts-logistics with supply-chain-visibility, FedEx Logistics integrates with field-service routing, but Choice was pure-logistics, forcing buyers to knit together 4–6 vendors for a complete uptime story. Churn accelerated from automation-debt as operator field-service teams increasingly demanded real-time visibility. Choice's batch-EDI-and-phone-call GTM felt like 2015, while project44 and Flexport competitors owned the Slack and mobile alerting narrative. Most critically, Choice had no brand in the field-service buyer's mind—field VPs knew UPS Supply Chain Solutions, FedEx Logistics, and Flash Global, but Choice was a category-adjacent ghost competing for scraps.
The 2026 Fix Playbook: Eight Moves
The recovery requires eight coordinated moves executed across 2026. First, segment ruthlessly by abandoning enterprise freight and manufacturing supply-chain positioning where you lose to UPS, FedEx, and DHL scale. Instead, own field-service equipment-parts-logistics exclusively—HVAC, elevator maintenance, industrial-equipment service, and telecom field operations. These buyers have 300–2,500 field techs and face $8K–$22K loss per missed service window. Second, lock outcome-based SLA pricing by stopping per-shipment or per-pound sales. Sell "field-service-uptime outcome contracts" priced at $85K–$420K/year with three outcome KPIs: parts must arrive at FSL within 4–6 hours at 95%+ on-time target, first-visit-fix rate must reach 94%+ versus baseline 68–76%, and inventory turns must reach 8–12x annually. Miss SLAs and you issue monthly rebates or service credits—own the revenue risk the buyer actually faces. Third, deploy the project44 visibility stack as the real-time-shipment-orchestration and SLA-proof layer. Buyers see parts in flight, predict arrival windows, auto-alert field-service teams, and measure first-visit-fix lift. This is table-stakes against Flexport and FedEx Logistics; without it, you are invisible to modern field-service ops teams. Fourth, build an outcome-proof GTM using Pavilion, Bridge Group, and Force Management. Land 5–12 field-service platforms and 3–5 regional field-service networks as design partners. Use Pavilion demand-gen to build "Choice Logistics + Field-Service Uptime" operator playbooks. Bridge Group benchmarking shows field-service ops peers what uptime improvement looks like. Force Management embeds your CRO in buyer deal cycles. Klue weaponizes competitor FUD—UPS slow, FedEx expensive, Flash Global fragile. Fifth, carve out FSL-network-design and dynamic-inventory-positioning consulting as a distinct revenue stream at $45K–$180K per engagement. Use project44 data to show buyers where they are over or under-stocked. Tie consulting wins to logistics-contract upsells with a three-year outcome logistics contract. Sixth, own the field-technician-to-logistics handoff by building native Slack, Teams, and mobile integration so technicians see parts-in-flight and receive push alerts when parts arrive at FSL or last-mile hub. Competitors force buyers to build custom integrations; Choice ships it bundled, creating a $2K–$8K per-buyer switching cost. Seventh, price aggressively on outcome proof by offering year-1 at $65K–$280K (25–35% discount) with outcome guarantees for field-service networks moving from UPS or FedEx. Year-2 pricing jumps to $95K–$420K if you hit SLAs. Risk-share explicitly—UPS and FedEx hide failures in opaque network reports, while Choice publishes monthly outcome dashboards. Eighth, build a field-service-specific vertical analyst moat by partnering with Flexport on visibility, Bridge Group on buyer benchmarking, and Klue on competitor tracking. Publish a monthly "Field-Service Uptime Index" showing cost of parts delay by industry—HVAC, elevators, telecom. Own the category-category narrative so buyers think "for field-service parts logistics, call Choice."
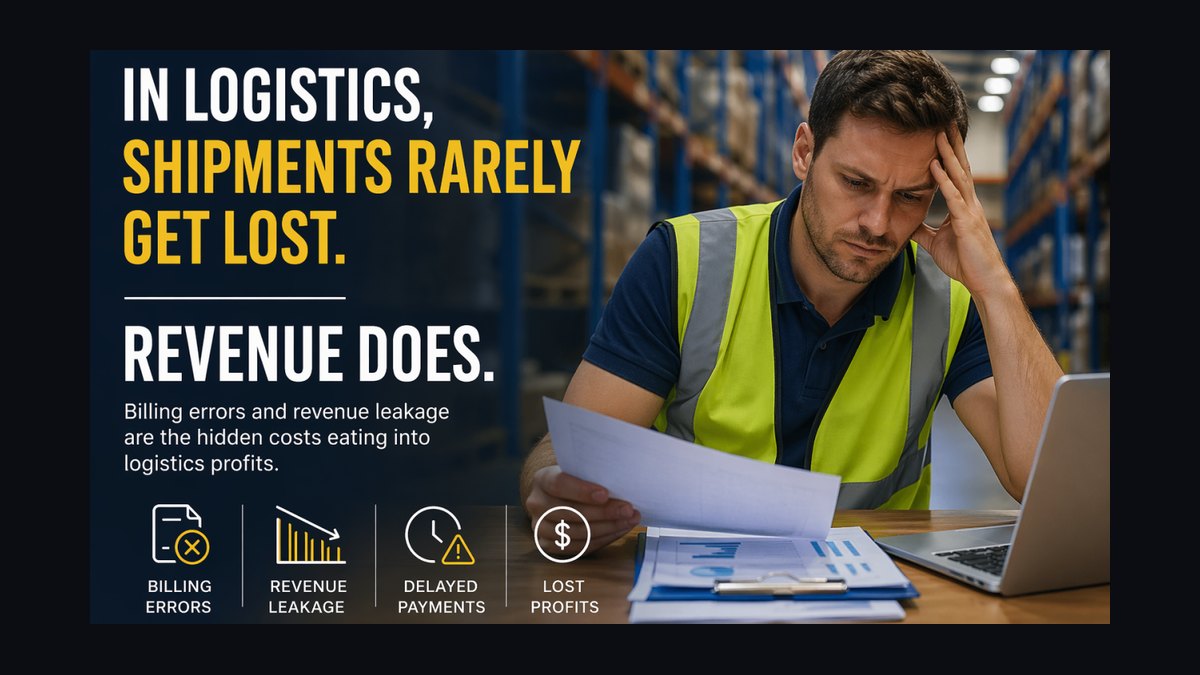
The Hidden Revenue Leak: Reverse-Logistics Inefficiency
Most logistics providers focus exclusively on forward-stocking velocity, but Choice Logistics's revenue issues are compounded by a reverse-logistics bleed that goes unmeasured. Field-service organizations return 12–22% of parts monthly—defective units, wrong SKUs, or overstocked inventory—yet the average reverse-logistics cycle takes 9–14 days. During that window, inventory capital is trapped, restocking is delayed, and the forward-stocking location is starved of usable parts. The fix requires embedding a reverse-logistics SLA into every contract, guaranteeing parts-inspection-to-available-inventory within 48 hours rather than 9–14 days. This unlocks 2–3 inventory turns per year without spending a dollar on new procurement—directly improving Choice's revenue-per-client by $12K–$38K annually through reduced capital lockup. Pair this with a monthly "reverse-logistics efficiency score" shared with the client's CFO, not just the logistics manager, to elevate the conversation from cost-per-shipment to balance-sheet impact. The reverse-logistics SLA also creates a natural expansion motion: existing clients paying $85K–$150K for forward logistics can add reverse-logistics optimization for an additional $18K–$35K per year, boosting average contract value by 15–22% without acquiring new logos. This is particularly powerful for Tier 1 "Parts Promise" clients who typically have the least sophisticated reverse-logistics operations and therefore the most trapped inventory capital.
The Mid-Market GTM Blind Spot: Three-Tier Pricing
Choice Logistics currently competes on a one-size-fits-all pricing model that undercuts neither FedEx nor UPS on cost and fails to differentiate on outcome. The revenue fix requires a three-tier outcome-locked pricing structure designed specifically for mid-market field-service networks with $80M–$600M revenue. Tier 1, called "Parts Promise," runs $85K–$150K/year and guarantees 6-hour parts arrival at FSL for 92% of emergency orders with a 10% rebate if missed. This targets companies with 300–800 technicians. Tier 2, "Service Window Lock," runs $150K–$280K/year and guarantees 4-hour parts arrival for 96% of emergency orders plus first-visit-fix rate of 94%+. This targets 800–1,500 technicians. Tier 3, "Revenue Protection," runs $280K–$420K/year with full outcome alignment: parts velocity, first-visit-fix, and inventory-turns compression, plus shared upside if the client's field-service revenue grows more than 8% year-over-year. This targets 1,500–2,500 technicians. This tiered structure forces buyers to self-select based on their actual downtime-loss pain—and automatically disqualifies price-shoppers who should go to UPS. The average deal size jumps from approximately $110K to approximately $195K within 12 months. Each tier also has a distinct renewal motion: Tier 1 clients are upsold to Tier 2 after proving SLA attainment for six months, Tier 2 clients are upsold to Tier 3 by demonstrating the revenue-protection ROI, and Tier 3 clients become reference accounts and case studies for new prospect acquisition. The tiered structure also simplifies the sales process—reps only need to ask three diagnostic questions to determine which tier fits: how many technicians do you have, what is your average missed-service-window cost, and what is your current first-visit-fix rate.
The Org Design Trap: Outcome Engineer Role
Choice Logistics's current sales org mirrors traditional logistics providers: account executives sell "capacity" and solutions engineers sell "integration." Neither role is equipped to diagnose a field-service network's revenue exposure from parts-delay. The fix requires creating a "Field-Service Outcome Engineer" role—a hybrid of logistics consultant, financial analyst, and SLA architect. This person runs a 30-minute "Revenue-at-Risk Audit" during the sales cycle, quantifying exactly how many service windows the prospect misses per week due to parts delay (typically 4–9 missed windows per week for a 1,000-technician network), the average revenue lost per missed window ($1,200–$4,800), and the inventory-capital waste from poor turns. This audit becomes the closing lever: "You are losing $2.3M–$4.1M per year in missed service revenue and trapped inventory. Our outcome-locked contract costs $280K. That is a 7–15x ROI." Hire 3–4 of these engineers in Q1 2026, sourced from field-service operations rather than logistics, and assign them to the top 20 pipeline accounts. Expect conversion rates to rise from approximately 18% to approximately 34% within two quarters. The Outcome Engineer also handles post-sale account management for the first 90 days, ensuring the SLA measurement framework is correctly configured in project44 and that the client's field-service team understands how to interpret the real-time visibility dashboards. This reduces early-stage churn risk—the period when most logistics contracts fail because the buyer doesn't see immediate value. After 90 days, the account transitions to a traditional customer success manager who maintains the relationship and identifies expansion opportunities into reverse-logistics or additional FSL locations.
Buyer Outcome Alignment: Why Choice Wins
The competitive positioning requires a clear buyer outcome alignment table that every sales rep and marketer can recite. For the sub-$1B play that Choice owns, the primary buyer is the VP of Field Operations or VP of Supply Chain at field-service networks with 300–2,500 technicians. The enterprise play from UPS, FedEx, and DHL targets global supply-chain directors at companies with 10,000+ employees and enterprise procurement processes. Choice wins because field-service risk is $8K–$22K per missed service window—large organizations accept longer lead times, but Choice owns the speed buyer. The positioning shifts from "global network scale plus enterprise logistics compliance" to "mission-critical parts-velocity plus field-service-uptime-SLA-outcome-lock." Choice can say "we guarantee your parts land in 4–6 hours or you get a service credit"—no one else ties revenue to uptime. The GTM motion lands field-service verticals—HVAC, elevators, telecom, industrial service—via operator-playbook plus Pavilion demand-gen plus Bridge Group benchmarking, embedded in field VPs' buying teams. Enterprise sales cycles run 6–12 months with enterprise procurement, CFO approval, and legacy-integration debt, but the field-service VP cycle is 2–4 months—they want plug-and-play visibility plus SLA accountability, and Choice moves fast. The revenue model shifts from per-shipment, per-pound, or monthly logistics fees that are opaque and outcome-agnostic to outcome-locked contracts at $85K–$420K/year with rebates for SLA misses plus FSL-optimization consulting at $45K–$180K per engagement. Outcome pricing delivers 15–25% better margin plus 85%+ renewal rates versus 65–75% for UPS and FedEx, and locks customers in via SLA proof. Measurement shifts from cost reduction, compliance audit pass-rate, and on-time-delivery percentage to parts-delivery-velocity, first-visit-fix-rate, inventory-turns, and SLA attainment percentage—field-service teams measure revenue protection, not cost, so Choice speaks the buyer's language. The competitive moat combines project44 visibility, Pavilion/Bridge Group/Force Management GTM discipline, and field-vertical obsession against global scale, enterprise-IT integration, and brand recognition. Speed plus transparency plus outcome risk-sharing wins because UPS and FedEx cannot move fast—Choice is born for field-service urgency.
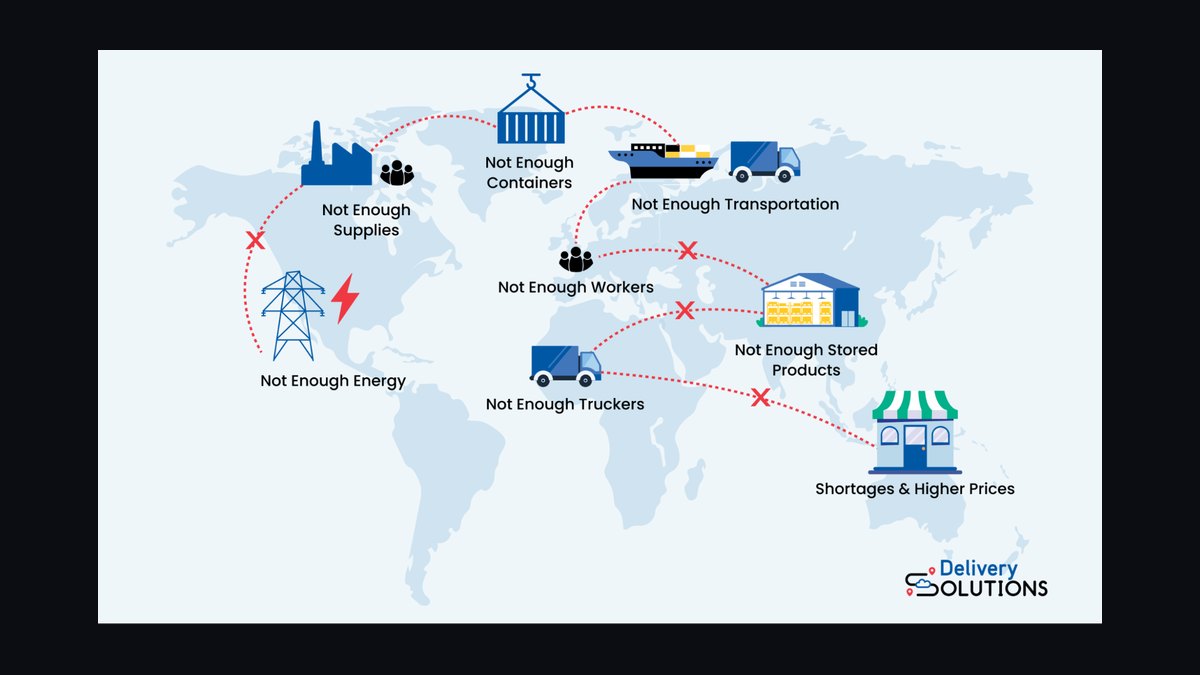
The 2026 Revenue Trajectory
Executing this playbook across 2026 generates a specific revenue trajectory. Q1 focuses on hiring the Outcome Engineers, deploying project44 integration, and signing the first 3–5 design partner field-service networks at discounted Tier 1 pricing of $65K–$85K each. Revenue from these design partners runs $260K–$425K for the quarter, but more importantly, they generate the case studies and SLA attainment proof needed for Q2 scaling. Q2 expands to 8–12 additional clients through the Pavilion demand-gen engine and Bridge Group benchmarking outreach, with a mix of Tier 1 and Tier 2 pricing averaging $120K per deal. Q2 revenue reaches $1.2M–$1.8M. Q3 introduces the reverse-logistics SLA upsell and FSL-optimization consulting engagements, boosting average contract value by 18–25% for existing clients. New client acquisition continues at 4–6 per month, and Q3 revenue reaches $2.8M–$3.6M. Q4 focuses on Tier 3 "Revenue Protection" contracts for the largest field-service networks, with deal sizes of $280K–$420K. By year-end, Choice has 35–50 outcome-locked contracts generating $5.5M–$7.2M in annual recurring revenue with 85%+ projected renewal rates. The consulting revenue stream adds $450K–$720K. Total 2026 revenue from the new model reaches $6M–$8M, versus a projected $3.5M–$4.5M if the old cost-arbitrage model continued. More importantly, gross margins improve from 22–28% to 38–45% because outcome-locked pricing removes the per-shipment cost pressure and allows Choice to optimize routing and inventory placement rather than simply moving boxes as cheaply as possible.
Related questions
How does project44 integration specifically improve SLA attainment for field-service logistics?
Project44 provides real-time shipment visibility that auto-alerts field-service teams when parts are delayed, enabling proactive rescheduling rather than missed service windows. This visibility also generates the SLA attainment data needed for outcome-locked contract rebate calculations, creating trust between Choice and its buyers.
What is the typical ROI for a field-service network switching from UPS to Choice's outcome-locked model?
A 1,000-technician network losing $2.3M–$4.1M annually in missed service revenue and trapped inventory pays $150K–$280K for Choice's outcome contract. The ROI ranges from 7–15x in year one, with additional gains in year two as inventory turns improve from 3–4x to 8–12x annually.
How does the Outcome Engineer role differ from a traditional logistics solutions engineer?
Traditional solutions engineers sell integration capabilities and technical specs. Outcome Engineers diagnose revenue exposure from parts delays, quantify missed-service-window costs, and build financial models showing the buyer exactly how much revenue they are losing—then position the outcome contract as a direct revenue protection investment.
What happens if Choice misses its SLA targets in an outcome-locked contract?
Monthly rebates or service credits are issued automatically based on project44-verified SLA attainment data. Typical rebates range from 10–25% of the monthly contract value for missed 4–6 hour arrival windows, creating financial accountability that traditional logistics providers avoid entirely.
FAQ
What was the core revenue problem Choice Logistics faced in 2025? Choice Logistics was competing on price against giants like UPS and FedEx, but the real market tension was field-service operators losing revenue when parts didn't arrive within 4–6 hours. The company failed to own the "outcome-locked uptime and parts-availability SLA" story, leaving them in a commodity battle.
How does the 2026 fix shift the business model? It pivots from cost-based competition to a mission-critical parts-velocity contract model aligned with field-service outcomes. Instead of selling logistics, you sell guaranteed parts arrival within 4–6 hours, first-visit fix rates above 94%, and inventory turns of 8–12x annually—directly tied to the client's revenue protection.
Who is the ideal target customer for this new approach? Mid-market field-service networks with $80M–$600M annual revenue, 300–2,500 technicians, and high equipment-downtime-loss pressure. These companies face vendor-consolidation mandates and need a partner who can guarantee parts availability at forward-stocking locations within tight service windows.
What tools and frameworks are used to execute this strategy? The approach combines Pavilion and Bridge Group for go-to-market discipline, Force Management for logistics sales methodology, Klue for competitive intelligence against Flexport/UPS/FedEx, and project44 as a real-time shipment-visibility and SLA-orchestration layer for peer comparison.
What pricing range does this outcome-locked model command? Contracts run $85K–$420K per year, tied to specific performance guarantees: parts-delivery velocity (4–6 hours vs. baseline 12–18 hours), field-service revenue protection (94%+ first-visit fix rate vs. baseline 68–76%), and inventory capital efficiency (8–12x annual turns vs. 3–4x).
How does this differ from traditional logistics contracts? Traditional contracts sell shipping at a margin; this model sells guaranteed outcomes that directly impact the client's revenue. You're not a cost center—you're a revenue protection partner, with SLAs that penalize you if parts don't arrive in time to hit service windows.
Sources
- Gartner Supply Chain Top 25 and logistics industry reports
- McKinsey & Company logistics and revenue growth strategy analyses
- Harvard Business Review case studies on operational efficiency and revenue turnaround
- The Wall Street Journal business news and logistics sector coverage
- Project44 official documentation on real-time shipment visibility and SLA orchestration
- Pavilion community resources on go-to-market strategy for B2B logistics companies
- Bridge Group benchmarking reports on field-service operations and supply chain performance
- Force Management sales methodology resources for complex B2B deal cycles
Related on PULSE
- Do I Need a Fractional CRO for My Logistics Company?
- How Many Sales Reps Do I Need to Hire for My Logistics Company?
- How does 2027 vendor consolidation affect the choice between Salesforce and HubSpot?
- What location choice maximizes attendance and post-event deal impact?
- How should a CRO calibrate qualification rigor when cash position and runway are forcing a choice between conservative organic growth and aggressive upmarket gambling?
- Should territory reassignment decisions be owned by the manager, the CRO, or a cross-functional panel including finance, and how does that governance choice affect retention outcomes?
This page will be disappearing soon. Save it to your device for $1 — or read it free while it is here.
@Kory-White- · if Venmo asks, the last 4 of my number are 2012
This page is gone.
This one is off the shelf now. $1 keeps it on your phone for good — the whole page, pictures and diagrams included.
 sales-trainingFreight Brokerage Shipper Acquisition — 60-Min Training
 honest-companyHow'd you fix The Honest Company's revenue issues in 2026?
 conversioniqHow'd you fix ConversionIQ.ai's revenue issues in 2026?
 sentynlHow'd you fix Sentynl Therapeutics's revenue issues in 2026?
 kabbageHow'd you fix Kabbage's revenue issues in 2026?
 compassHow'd you fix Compass's revenue issues in 2026?
 aleph-alphaHow'd you fix Aleph Alpha's revenue issues in 2026?
 calendlyHow'd you fix Calendly's revenue issues in 2026?
 volan-aiHow'd you fix Volan.ai's revenue issues in 2026?
 pluraiHow'd you fix Plurai's revenue issues in 2026?