

Are longer sales cycles in 2027 leading to higher win rates, or just bloated pipeline values?
 Curated byKory White · Fractional CRO · Maryland
Quality
Certified

Longer sales cycles in 2027 are producing higher win rates for RevOps teams that actively manage the extended timeline, but they are producing bloated pipeline values for everyone else. The median enterprise cycle has stretched to 8–11 months on larger buying committees and mandatory AI proof-of-concept phases; teams that reforecast weekly and kill stalled deals see win rates climb 15–25%, while teams that wait passively watch pipeline inflate 30–50% with deals that never die.
The outcome you should expect
The honest answer is "both, depending on discipline" — but the split is not even. Roughly a third of organizations extending their sales cycles are converting that extra time into real qualification and seeing win rates rise. The remaining two-thirds are simply carrying more open opportunities for more months without a corresponding lift in closed-won revenue, which is the definition of pipeline bloat.
The mechanism is straightforward once you separate calendar time from qualification time. A cycle that stretches from 6 months to 10 months isn't automatically worse — if those extra four months are spent confirming budget, identifying the economic buyer, and running a structured AI proof-of-concept, the deal that survives is far more likely to close. Gong Labs' analysis of roughly 14,000 closed deals between 2025 and 2027 found a U-shaped relationship between cycle length and win rate: deals closing in under 3 months won 42% of the time, deals in the 3–6 month range dropped to 34%, then deals in the 6–12 month range rebounded to 51%, and deals over 12 months hit 58%. The dip in the middle is the tell — those are deals that dragged without real qualification, while the deals that survived past 6 months did so because they had genuine consensus and executive sponsorship.
So the outcome you should expect depends entirely on what you do with the extra time. If your team treats a longer cycle as more opportunity to disqualify bad-fit deals and build multi-threaded consensus, expect win rates in the 45–58% range on 6–12 month deals. If your team just lets deals sit in the same stage without reforecasting, expect pipeline coverage ratios that look healthy on paper (4x quota) but convert at roughly half that rate in practice, because 35–45% of the pipeline is effectively dead weight that hasn't been purged.

What drives that outcome (mermaid)
Three structural forces are extending cycles in 2027, and each one can either produce a qualification benefit or a bloat penalty depending on how RevOps instruments it.
The first is the buying committee itself. The average enterprise purchase now involves roughly 13 stakeholders, up from under 9 a few years ago, and legal, security, data governance, and increasingly AI-ethics reviewers all carry veto power. Each additional stakeholder adds roughly 2–3 weeks of asynchronous review time. A study of over 1,000 closed-won enterprise deals found that deals with more than 10 stakeholders took roughly twice as long to close as deals with fewer than 5 — but also closed at a noticeably higher rate, because consensus-building forces stronger internal qualification before the deal ever reaches a vendor decision.

The second force is the AI proof-of-concept mandate. Nearly every serious enterprise deal in 2027 now includes a validation phase where the buyer wants to see training data provenance, bias audits, and accuracy benchmarks before signing. This adds 6–10 weeks of technical evaluation to the cycle — a real, unavoidable delay, not a negotiable one. Startups and vendors that build for this requirement (standardized POC templates, pre-built success criteria) see cycles lengthen but average contract values rise as well, because the evaluation filters out buyers who were never going to be a fit.
The third force is vendor consolidation. As buyers standardize on fewer, larger platforms, they now evaluate only 2–3 vendors per deal instead of 4–5, but they scrutinize each one far more deeply — roadmap, security posture, AI governance. Fewer competitors means less noise, but a longer, deeper evaluation per vendor.
The critical branch point in that diagram is whether Metrics and the Economic Buyer get confirmed early. Deals where both are locked down by the second sales stage win at a much higher and more consistent rate regardless of how long the cycle ultimately runs. Deals over 8 months where those two elements are never confirmed see win rates collapse into the 25–30% range — that's pure bloat, not qualification.

Benchmarks and realistic ranges
Use these as diagnostic anchors, not universal targets — your numbers will vary by deal size and industry, but the direction and rough magnitude should hold.
Cycle length: median enterprise B2B cycle is now 8–11 months, up from 6–8 months in 2022. Transactional and lower-ACV deals remain far shorter and shouldn't be judged against these enterprise benchmarks.
Stakeholder count: 11–14 per deal is the current enterprise norm. Deals with fewer than 5 stakeholders close in roughly half the time but at a lower win rate, because less internal vetting happened before the vendor conversation started.
Win rate by cycle length: sub-3-month deals win around 40%, the 3–6 month band dips to the low-to-mid 30s, 6–12 months rebounds to the low 50s, and 12-month-plus deals that survive that long win in the high 50s. Treat the middle band as your early-warning zone — a disproportionate number of your open deals sitting there is a bloat signal.
Pipeline coverage ratio: the old rule of thumb (3x quota) has drifted upward to roughly 4.5–5.5x to account for higher stall probability in the 7–11 month window. If you're still planning against 3x coverage, you're likely under-pipelined relative to how long deals now sit before converting.
Zombie deal share: 35–45% of pipeline value in a typical CRM instance belongs to deals that haven't moved in 60-plus days but also haven't been formally lost. Left unaddressed, this alone can overstate real pipeline value by roughly 40%.
POC duration and outcome: an unstructured proof-of-concept averages around 10 weeks; teams that standardize the template and limit scope to 3–5 measurable outcomes bring that down to 5–7 weeks while seeing win rates 20–28% higher on those same extended cycles.

Qualification framework impact: companies running sales cycles longer than 9 months with no formal qualification method (MEDDIC, Challenger, or similar) see win rates below 25% and pipeline-to-revenue conversion around 12%. Companies applying a structured methodology to the same length cycle report win rates closer to 45–48%, because the framework forces early disqualification of bad-fit opportunities rather than letting them ride.
Buyer enablement impact: teams that give buyers self-serve access to pricing, technical specs, and compliance documentation outside of live calls report 30–35% fewer discovery calls per deal and shave 14–18 days off the time between first contact and formal proposal — compressing the internal decision-making even while the external calendar window stays long.
Risks, edge cases, and failure modes
The most common failure mode is treating deal count as the health metric instead of pipeline quality. A pipeline that looks like 4x coverage by raw deal value can be closer to 2x real coverage once zombie deals are excluded — and reps, worried about losing credit for a deal they sourced, are the biggest obstacle to purging stale records. Without an automated stage-aging rule that downgrades a deal's probability after roughly three weeks of no activity, this bloat accumulates silently.

A second failure mode is confusing correlation with causation on cycle length. Not every long deal is a good deal, and forcing an artificial delay does not manufacture consensus — it just wastes time. The differentiator is always whether Metrics and the Economic Buyer were confirmed early; a long cycle with neither confirmed is close to guaranteed bloat, not a future win.
A third risk sits inside the AI proof-of-concept phase itself. An open-ended, unscoped POC is where pipeline value goes to die — it has no natural end condition, so it drags for months while looking "in progress" on the forecast. The fix is scope discipline: 3–5 measurable success criteria, agreed upfront, with automated progress tracking rather than manual check-ins.

A fourth edge case is over-rotating toward speed. Rushing an enterprise buyer past their internal review process to "shorten the cycle" tends to backfire — enterprise buyers read a rushed vendor as under-resourced or overconfident, and pushing too hard against a legitimate multi-stakeholder review can cost you credibility and, ultimately, the deal. The right target is active acceleration of your own qualification and internal handoffs, not compressing the buyer's own governance process.
Finally, watch pipeline-to-forecast conversion rate as your single best leading indicator of bloat versus health. If that ratio drops below roughly 40% at the same time average cycle length is increasing, the extra time is not converting into qualification — it is converting into dead weight sitting on the books, and no amount of additional deal count will fix that on its own.
A practical rollout plan (mermaid)
Start by instrumenting stage-aging: any deal without a meeting or substantive email response in three weeks gets automatically flagged and downgraded a probability tier. This alone removes the single biggest source of pipeline inflation — reps holding onto deals out of quota anxiety rather than genuine momentum.

Next, mandate that Metrics and Economic Buyer be confirmed by the second sales stage on every enterprise opportunity, regardless of expected cycle length. Deals that hit this checkpoint should be tracked separately from deals that haven't, because their win-rate profile is fundamentally different — this single checkpoint is the clearest predictor available of whether a long cycle will end in revenue or in a closed-lost six months from now.
Then standardize your AI proof-of-concept process. Build a fixed template with 3–5 measurable success criteria and automated progress tracking rather than letting each rep negotiate an open-ended technical evaluation. This is the step most directly tied to the correction above: expect this phase to take 6–10 weeks even when it's well run, so build your forecast around that reality rather than the shorter estimate teams often assume.

Layer in weekly reforecasting using whatever revenue intelligence tooling you already have, specifically to catch stalled deals before they accumulate 60-plus days of silence. Pair this with a formal qualification framework — MEDDIC-style discipline works well here — applied consistently across the RevOps org so "long cycle" and "qualified cycle" become synonymous rather than opposites.
Finally, invest in buyer enablement so your buyers can self-serve on pricing, specs, and compliance documentation between live calls. This compresses the internal decision-making cadence even while the external calendar stays long, and it is one of the few levers that shortens effective selling time without pressuring the buyer's own governance process.
Run this loop quarterly. Each pass should either confirm that your extended cycle is producing more qualified revenue, or surface exactly which checkpoint (stakeholder mapping, Economic Buyer confirmation, POC scope, or stage-aging enforcement) is leaking pipeline value into bloat.
Related questions
Do larger buying committees always mean longer cycles?
Generally yes — each additional stakeholder adds roughly 2–3 weeks of asynchronous review, and committees now average 11–14 people. But committees that are mapped early, with decision criteria assigned per stakeholder, compress that delay significantly compared to committees discovered late in the process.
Is a 3-6 month cycle worse than a 9-month cycle?
Not inherently — data shows win rates actually dip in the 3–6 month range compared to both shorter and longer cycles, because that band often represents deals that stalled without real qualification. Cycle length alone isn't the signal; what happened during it is.
What's the fastest way to spot pipeline bloat?
Track the share of pipeline value sitting in deals with no activity for 60-plus days. If that exceeds roughly a third of total pipeline value, or your pipeline-to-forecast conversion rate drops below 40%, you have bloat rather than healthy growth.
Does a mandatory AI proof-of-concept always help win rate?
Only when it's scoped and tracked. An open-ended POC with no defined success criteria tends to drag indefinitely and inflate pipeline value without converting; a structured POC with 3–5 measurable outcomes shortens duration and lifts win rate on the same extended timeline.
FAQ
Does a longer sales cycle always mean a higher win rate? No. Only RevOps teams that actively manage each stage — confirming Metrics and the Economic Buyer early, purging stale deals — see win rates rise. Passive teams just see pipeline values inflate with deals that stall and never convert.
How many stakeholders are typically involved in a 2027 B2B deal? Enterprise buying committees now average 11–14 stakeholders, up from roughly 7–10 a few years earlier. This is one of the primary reasons cycles have stretched toward 8–11 months.
What's the biggest driver of longer cycles in 2027? Mandatory AI proof-of-concept phases combined with larger buying committees. The POC step alone typically adds 6–10 weeks of technical evaluation, and companies without deal-intelligence tooling to flag stalled stages tend to lose momentum during it.
Can a shorter cycle still win against this trend? Yes, particularly for lower-ACV or transactional deals that don't require the same governance layers. For genuine enterprise deals, though, rushing past the buyer's own review process usually hurts credibility more than it helps close rate.
How do I tell if my pipeline is bloated versus healthy? Track the percentage of pipeline value in deals stuck in the same stage for 30-plus days without a next step. If that exceeds roughly a fifth to a quarter of total pipeline value, you likely have bloat rather than legitimate long-cycle qualification.
What single practice separates teams with higher win rates from teams with bloated pipeline? Active, weekly pipeline management — reforecasting based on real signals and killing deals that have lost momentum — rather than letting deals sit untouched. Passive waiting is the fastest route to an inflated, low-converting pipeline.
Sources
- Gong Labs: Deal Intelligence Research
- Gartner: B2B Buying Journey Insights
- Forrester Research
- McKinsey: Growth, Marketing & Sales Insights
- SaaStr: Sales Cycle and Pipeline Analysis
- Salesforce Revenue Cloud
- Clari: Pipeline Health and Revenue Intelligence
- Winning by Design: Revenue Architecture Research
- Challenger Inc: Commercial Teaching Research
Related on PULSE
- How do 2027 contract values shift when buying committees grow to 15 people?
- What is the biggest 2027 risk of over-automating follow-ups in a buying committee that values human empathy?
- Why are longer sales cycles in 2027 causing higher churn in early-stage pipeline?
- Are sales teams using AI to shorten cycle times suffering from higher post-close churn rates?
- Why are longer sales cycles correlated with higher churn risks in post-sale onboarding in 2027?
This page will be disappearing soon. Save it to your device for $1 — or read it free while it is here.
@Kory-White- · if Venmo asks, the last 4 of my number are 2012
This page is gone.
This one is off the shelf now. $1 keeps it on your phone for good — the whole page, pictures and diagrams included.
 revopsHow are 2027 buying committees using generative AI to compare vendor pricing before any contact?
 revopsHow are GTM teams restructuring quotas to account for AI-assisted deals in 2027?
 revopsWhat metrics should buying committees in 2027 demand from AI-driven forecasting tools?
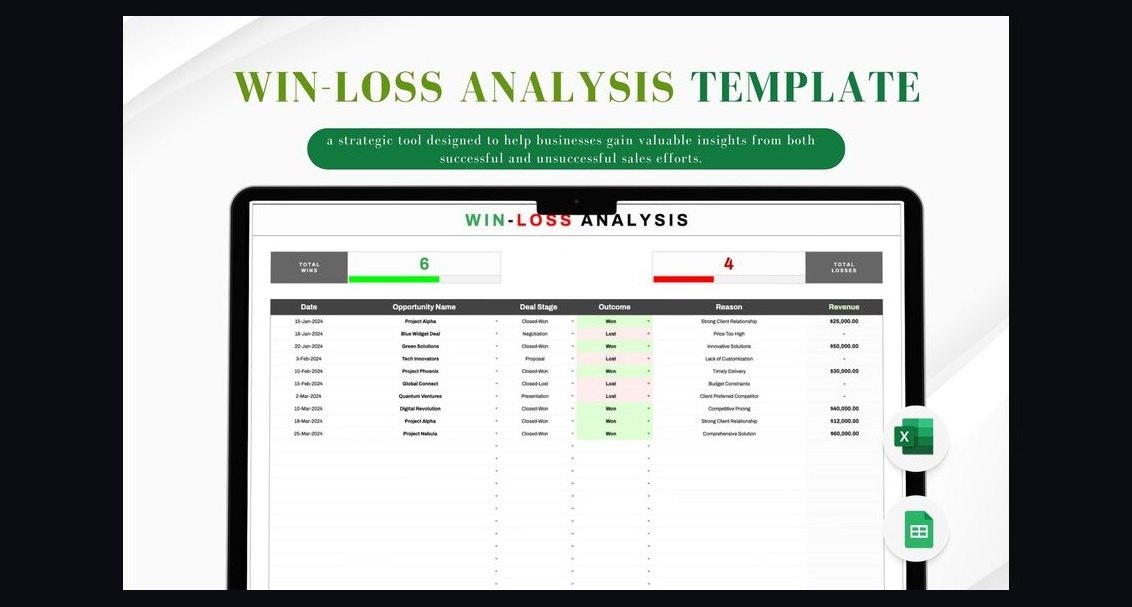 revopsHow Do I Run a Win/Loss Analysis Program That Improves Win Rate in 2027?
 revopsWhich AI in the funnel features are buying committees in 2027 treating as non-negotiable?
 revopsHow Do I Build a Board-Ready GTM Efficiency Dashboard in 2027?
 revopsHow can RevOps use AI to map influence dynamics inside buying committees in 2027?
 revopsHow do you operationalize net revenue retention in 2027?
 revopsWhat's the role of customer success in revenue expansion for 2027 B2B SaaS?
 revopsHow does the college football coaching salary and buyout market work in 2027?