 Pulse Reviews and Analysis
Loan-to-Deposit Ratio as a Liquidity and Revenue Metric for Credit Unions
 Curated by Chief Revenue Officer Kory White · CRO Syndicate · 📄 1-Page Resume
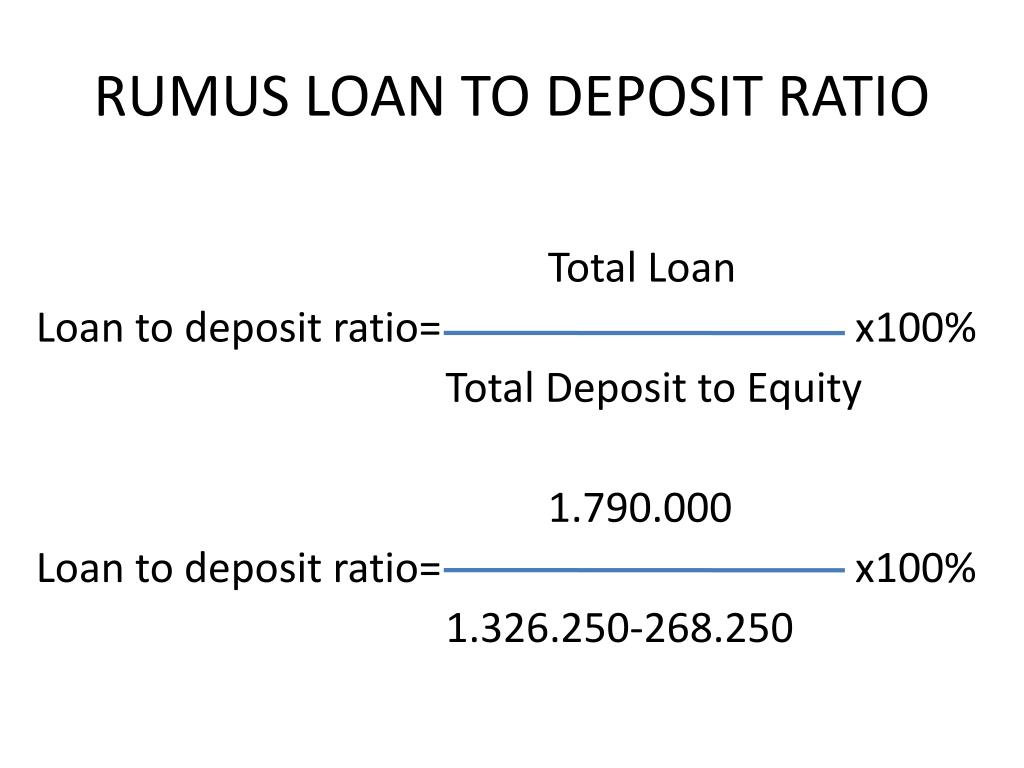
Direct Answer
Why Credit Unions Measure Differently
Credit unions are not banks. They are member-owned cooperatives with a statutory mission to serve their field of membership, not maximize shareholder returns. This structural difference fundamentally changes how LDR is managed.
Banks optimize LDR for net interest margin (NIM) and can raise wholesale funding (Fed funds, brokered CDs) to cover shortfalls. Credit unions have no equity holders; they rely almost exclusively on member deposits (shares) and retained earnings. If LDR gets too high, a credit union cannot easily tap capital markets—it must either slow lending, raise deposit rates to attract more shares, or reduce loan pricing to spur paydowns.
The NCUA (National Credit Union Administration) closely monitors LDR as a liquidity risk indicator. A credit union with LDR above 90% for two consecutive quarters triggers a CAMELS rating review on the "L" (liquidity) component. Failure to maintain adequate liquidity can lead to administrative action, including restrictions on new lending.
Real numbers: The median credit union LDR in 2023 was 77.4% (NCUA Quarterly Data). Top-quartile performers (by ROA) had LDRs between 72% and 82%. Credit unions below 60% LDR had an average ROA of 0.45%—half the industry median of 0.90%.
The Most Important KPIs to Track
1. Loan-to-Deposit Ratio (LDR)
Formula: Total Loans Outstanding / Total Shares (Deposits) × 100
Why it matters: LDR directly measures liquidity and revenue potential. Every dollar of deposits not lent out is a dollar earning near-zero return (typically sitting in a Fed account earning the IORB rate, currently 5.4% as of June 2024, vs. A 7.5% auto loan yield).
A 10-point drop in LDR from 80% to 70% on a $500M credit union reduces annual net interest income by roughly $1.05M (assuming 3.5% spread on loans vs. Deposits).
Benchmarks:
- Optimal: 70–80%
- Warning: >90% (liquidity risk) or <60% (earnings risk)
- Regulatory trigger: >90% for two quarters (NCUA)
2. Net Interest Margin (NIM)
Formula: (Interest Income – Interest Expense) / Average Earning Assets
Why it matters: NIM captures the profitability of the lending-deposit spread. A high LDR with a low NIM means you’re lending at thin margins—often a sign of aggressive pricing to grow loan volume. The median credit union NIM in 2023 was 3.12% (NCUA). Top performers (top quartile) had NIM >3.50%.
Real vendor: Clari (revenue intelligence) can surface NIM trends against loan origination velocity, but for actual NIM calculation, most credit unions use Symphony Ayasdi (AI-driven ALM) or QwickRate (liquidity management). QwickRate charges $12,000–$25,000/year for a credit union of $200M–$1B assets.
3. Loan Growth Rate (YoY)
Formula: (Current Year Loans – Prior Year Loans) / Prior Year Loans × 100
Why it matters: LDR is a stock metric; loan growth is a flow metric. Rapid loan growth without matching deposit growth pushes LDR up. The median credit union loan growth in 2023 was 8.2% (NCUA). If loan growth exceeds 15% YoY while deposit growth is <5%, expect LDR to breach 90% within 12 months.
4. Deposit Beta
Formula: (Change in Deposit Rate) / (Change in Fed Funds Rate)
Why it matters: Deposit beta measures how much of a rate hike a credit union passes to members. A low beta (e.g., 0.30) means you’re not raising deposit rates as fast as the market—great for NIM, but it slows deposit growth and can cause outflows. In 2023, credit unions had a median deposit beta of 0.45 (vs.
Banks at 0.55). Outreach (sales engagement) is not directly used here, but credit unions use Salesforce Financial Services Cloud to track member deposit behavior and segment by rate sensitivity.
5. Non-Maturity Deposit (NMD) Runoff Rate
Formula: (Monthly NMD Balance Decline) / (Beginning NMD Balance)
Why it matters: NMDs (checking, savings, money market) are the cheapest funding source. If runoff exceeds 2% per month, LDR will spike. The NCUA requires credit unions with >$50M in assets to model NMD runoff under stress scenarios.
Real vendor: Cornerstone Advisors (consulting) runs ALM models for credit unions; their standard engagement for a $500M credit union is $35,000–$50,000 for a full liquidity stress test.
Real Operators
1. Navy Federal Credit Union ($170B assets, LDR ~72%) Navy Federal deliberately keeps LDR below 80% because they have a massive deposit base from active-duty military. They use Salesforce for member engagement and Gong for call coaching on loan origination—but their LDR strategy is conservative: they prioritize liquidity over marginal loan growth.
2. State Employees’ Credit Union (SECU, $53B assets, LDR ~85%) SECU runs a high-LDR model because they have sticky deposits from state employees. They use Clari to forecast loan pipeline against deposit inflows. In 2023, they maintained LDR at 85% while the industry median was 78%, achieving a 3.40% NIM—above peer average.
3. Alliant Credit Union ($20B assets, LDR ~68%) Alliant is digital-first and uses Outreach for B2B member acquisition (business loans). Their LDR is low because they have a high proportion of non-interest-bearing checking accounts. They’re actively pushing auto loan origination via Salesloft sequences to raise LDR to 75%.
4. BECU ($35B assets, LDR ~82%) BECU uses MEDDIC framework (Metrics, Economic Buyer, Decision Criteria, Decision Process, Identify Pain, Champion) for commercial lending. Their LDR hovers near 82%—they trigger a pricing review on deposit rates when LDR hits 85%.
Failure Modes
Failure Mode 1: Ignoring LDR in a Rising Rate Environment In 2022, the Fed raised rates 425 bps. Credit unions with LDR >90% (like many in Texas and Florida) saw deposit outflows accelerate because they couldn’t raise deposit rates fast enough. One $300M credit union in Oklahoma saw LDR spike from 88% to 96% in six months, triggering an NCUA liquidity directive.
They had to halt all new lending for 90 days.
Failure Mode 2: Chasing Loan Growth Without Deposit Strategy A $150M credit union in Ohio grew auto loans 25% YoY in 2023 but deposits grew only 3%. LDR went from 72% to 91%. They had to raise CD rates to 5.75% APY (vs. Market 5.25%) to attract deposits, crushing NIM from 3.2% to 2.1%.
Failure Mode 3: Using LDR as a Lagging Indicator Only LDR is a backward-looking metric. If you only review it monthly, you miss the inflection point. One $500M credit union in California saw LDR jump from 78% to 87% in 45 days because a large commercial borrower drew down a $20M line of credit. They had no real-time LDR dashboard.
Real vendor: Clari offers real-time pipeline-to-cash forecasting that can flag LDR risk 30 days ahead. Pricing starts at $15,000/year for teams of 10.
Reporting Cadence
| Metric | Frequency | Owner | Trigger Action |
|---|---|---|---|
| Loan-to-Deposit Ratio | Weekly | CFO/Treasurer | If >85%, raise deposit rates 25 bps |
| Net Interest Margin | Monthly | ALCO Committee | If <2.8%, review loan pricing |
| Loan Growth Rate | Monthly | Head of Lending | If >15% YoY, stress-test liquidity |
| Deposit Beta | Quarterly | Treasury | If <0.30, model runoff risk |
| NMD Runoff Rate | Weekly | CFO | If >2% monthly, activate retention campaign |
Tooling: Use Salesforce dashboards for real-time LDR tracking. Many credit unions build custom LDR reports in Tableau or Power BI connected to core systems (Symitar, Episys, DNA). A typical implementation costs $20,000–$40,000.
30-60-90 Plan for Improving LDR
Days 1–30: Audit and Baseline
- Pull daily LDR for last 12 months from core system. Calculate average, min, max.
- Benchmark against NCUA peer group (same asset size, field of membership). Use NCUA’s Call Report data (free).
- Identify top 5 deposit outflows (by member segment) using Salesforce data. If >50% of outflows come from members aged 55+, run a retention campaign.
- Set a target LDR range (e.g., 72–78%). If current LDR >85%, implement a 30-day deposit rate increase of 25 bps on money market accounts.
Days 31–60: Operationalize Monitoring
- Build a weekly LDR dashboard in Tableau or Power BI with alerts when LDR crosses 80% and 85%.
- Integrate loan pipeline data from Salesloft or Outreach into the dashboard to see forward LDR pressure.
- Run a deposit beta analysis using last 12 months of rate changes. If beta <0.35, model a 100 bps rate hike scenario.
- Train lending team on LDR impact: every $1M in new loans without matching deposits raises LDR by ~0.2% on a $500M credit union.
Days 61–90: Optimize and Automate
- Implement dynamic deposit pricing: use QwickRate or Curql (credit union CUSO) to adjust CD rates weekly based on LDR.
- Create a loan-to-deposit matching rule: for every $10M in new loan originations, require $8M in new deposit commitments (from the same member or new members).
- Run a stress test using Cornerstone Advisors’ ALM model: simulate a 200 bps rate hike and a 10% deposit runoff. If LDR exceeds 95% under stress, reduce loan origination targets by 15%.
- Review LDR quarterly with the board. Use Gong recordings of ALCO meetings to ensure consistent messaging.
Mermaid Diagram 1: LDR Flow and Decision Tree
Mermaid Diagram 2: LDR Impact on NIM and ROA
FAQ
? What is the ideal loan-to-deposit ratio for a credit union? The ideal LDR is 70–80%. Below 60% means you’re not lending enough; above 90% means you’re at liquidity risk. The NCUA considers 90%+ a red flag.
? How often should I calculate LDR? Weekly. Monthly is too slow—LDR can shift 5 points in 30 days if a large deposit leaves or a loan funds. Daily is best if your core system supports it.
? Does LDR affect my CAMELS rating? Yes. The "L" (liquidity) component of CAMELS directly considers LDR. A ratio above 90% for two consecutive quarters can drop your CAMELS score by one notch, potentially triggering regulatory action.
? Can I use LDR to set loan pricing? Absolutely. If LDR is below 70%, lower loan rates to stimulate demand. If above 85%, raise loan rates to slow origination and improve NIM. Many credit unions use a LDR-based pricing matrix in their loan origination system.
? What tools can help me track LDR in real time? Salesforce Financial Services Cloud with custom dashboards, Tableau connected to your core system, or Clari for pipeline forecasting. For ALM-specific tools, QwickRate ($12k–$25k/year) and Symphony Ayasdi are the market leaders.
? How does LDR differ between credit unions and banks? Banks can use wholesale funding (Fed funds, brokered CDs) to manage liquidity. Credit unions cannot—they rely on member deposits and retained earnings. This makes LDR a more binding constraint for credit unions.
Sources
- NCUA Quarterly Credit Union Data (Q4 2023)
- Cornerstone Advisors: Credit Union Liquidity Benchmarks 2023
- QwickRate: Liquidity Management for Credit Unions
- Salesforce Financial Services Cloud: Deposit and Lending Analytics
- Clari: Revenue Intelligence for Financial Institutions
- Gong: Coaching Loan Origination Teams
- NCUA CAMELS Rating System