
What are the best tools for tracking student behavior data without a complicated system in 2027
 Curated byKory White · Fractional CRO · Maryland
 PULSEKNOWLEDGE LIBRARY
The best tools for tracking student behavior data without a complicated system in 2027 are the ones you likely already have: a simple two- or three-field form (Google Forms or Microsoft Forms) connected to a spreadsheet (Google Sheets or Excel Online) with pivot table dashboards.
The Two Options Compared
This "assembled stack" approach costs nothing incremental if your school already uses Google Workspace or Microsoft 365, requires an afternoon to set up, and keeps teacher entry time under 20 seconds per incident. The alternative is a dedicated behavior platform like SWIS (School-Wide Information System from the University of Oregon's PBIS Center), or the behavior module built into your existing student information system (PowerSchool, Infinite Campus, Skyward). The deciding factor is not features—it is whether your school has a named person willing to spend two hours per week maintaining the spreadsheet. Without that owner, buy the platform. With that owner, the lightweight stack consistently produces more complete data because teachers actually use it.
---
Every school evaluating behavior tracking lands on the same fork: build a lightweight capture layer out of tools you already own, or buy a dedicated behavior platform. Both work. They fail in different ways, and the failure mode matters far more than the feature list.
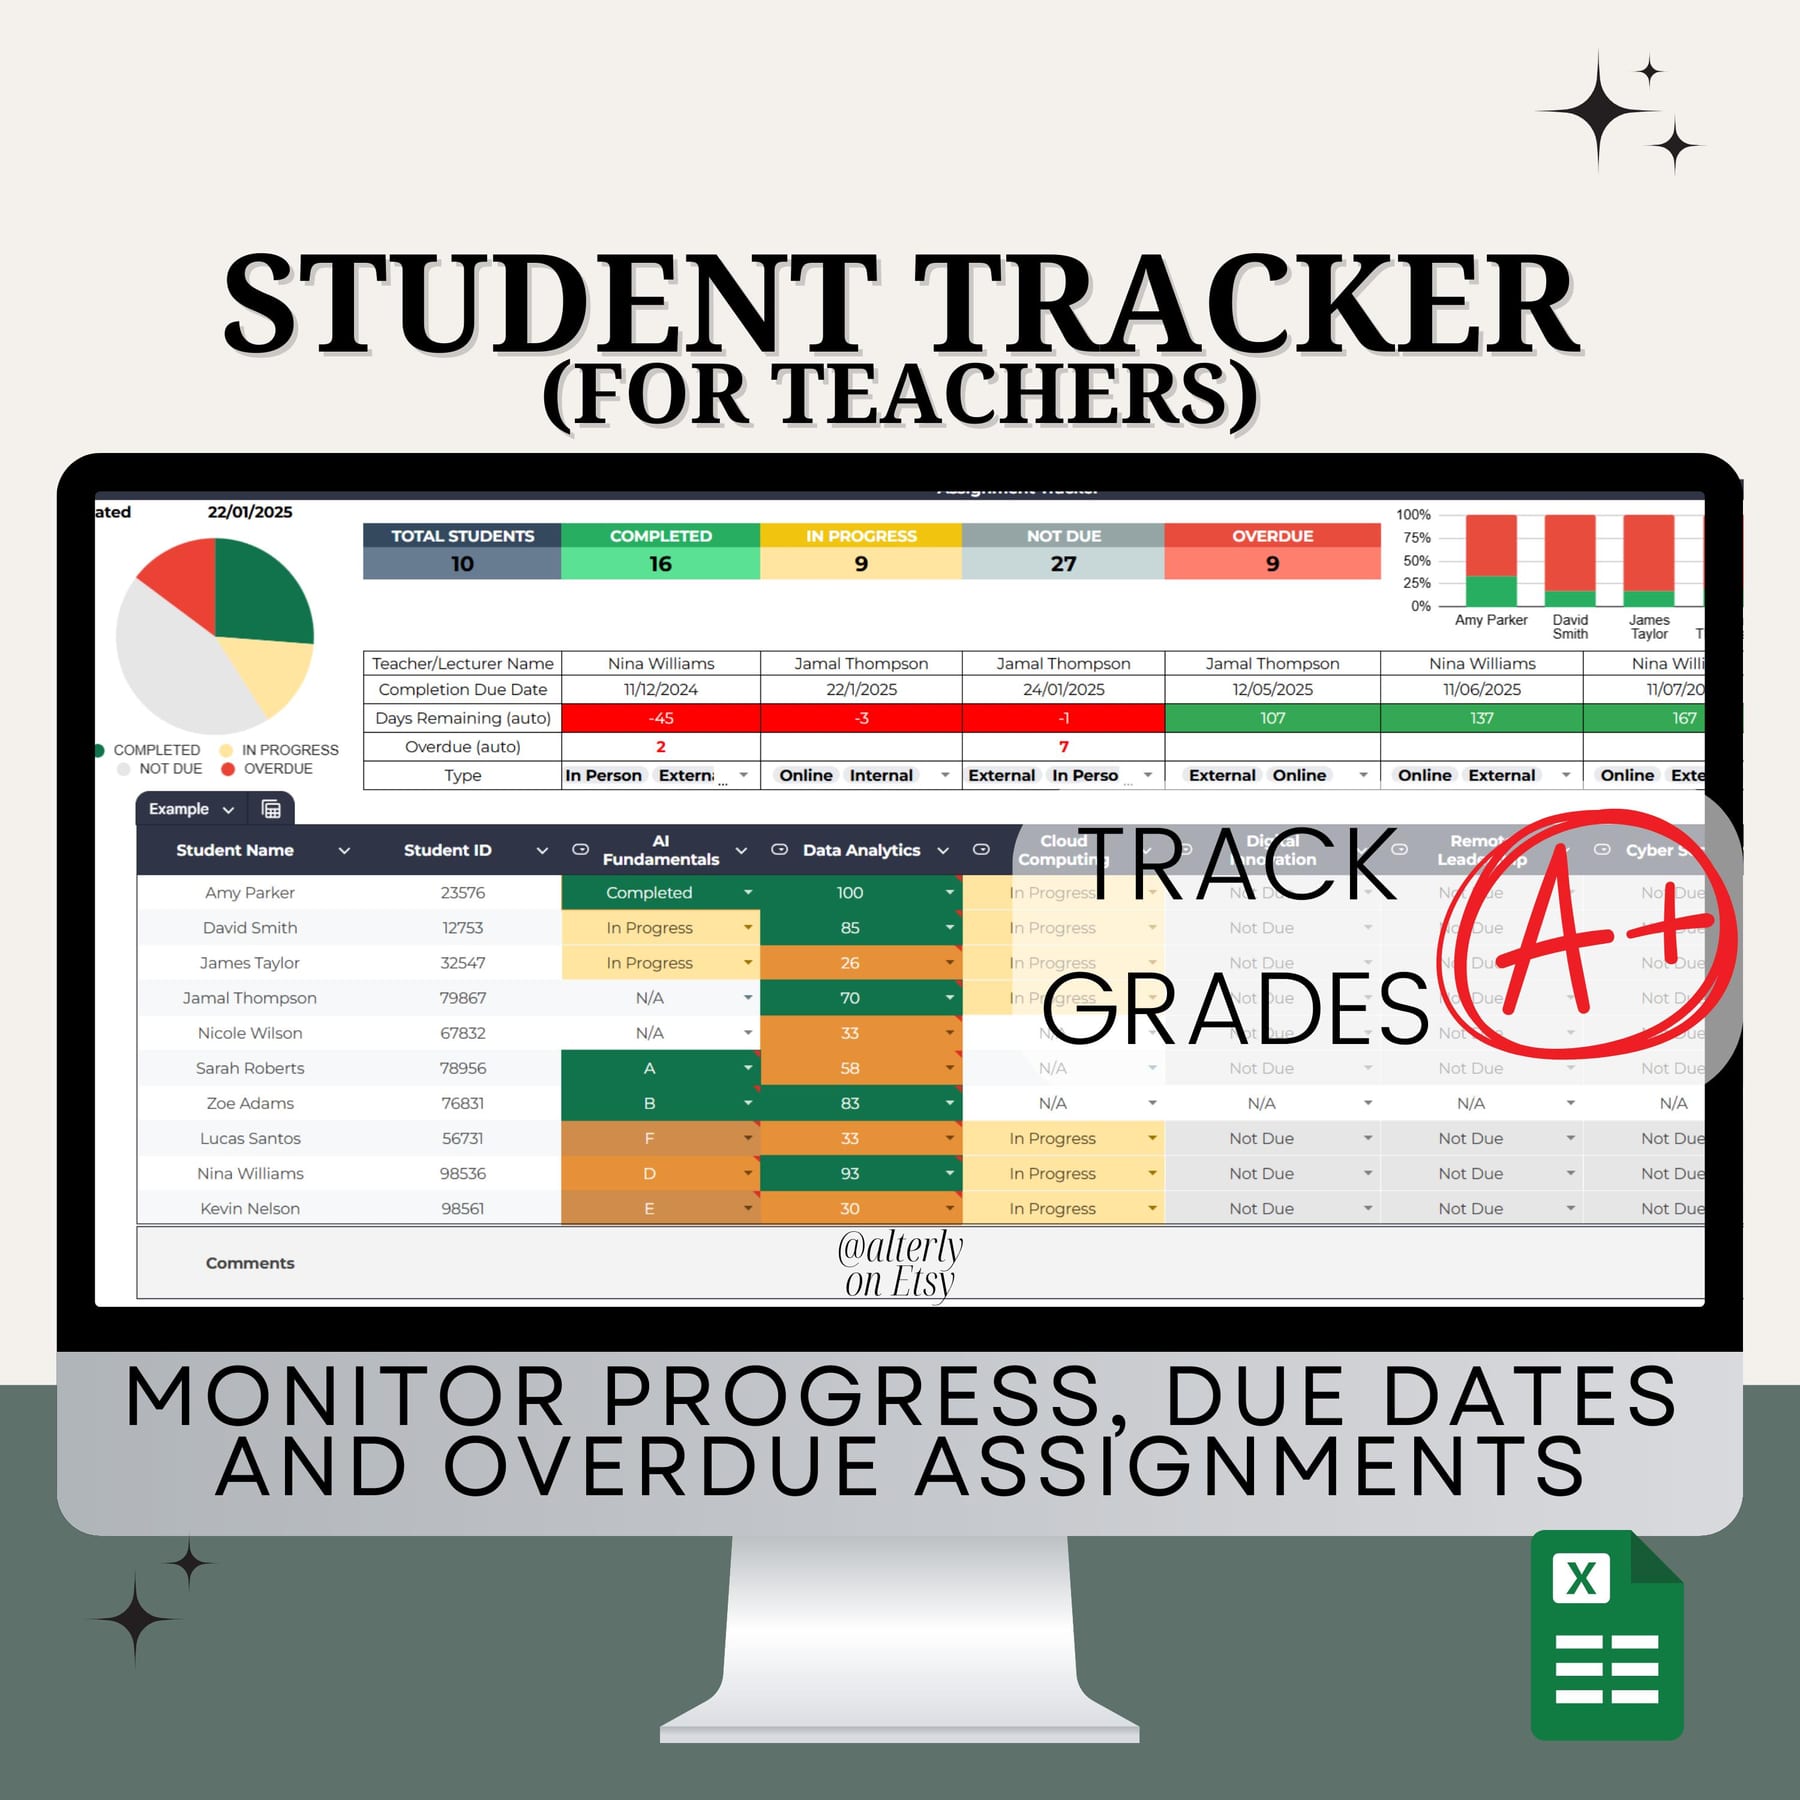
Option A — the assembled stack. A form (Google Forms, Microsoft Forms), a spreadsheet backing it (Sheets, Excel Online), and a dashboard tab built on pivot tables. Cost is effectively zero because the district already pays for Workspace or Microsoft 365. Setup runs an afternoon. The teacher-facing surface is a bookmarked link or a QR code taped inside a classroom door. Every entry writes one row: timestamp, student, location, behavior category, and an optional free-text note. Everything else—frequency counts, by-period heat maps, repeat-referral lists—comes from pivots over that one table.

The assembled stack's weakness is that nothing enforces consistency. If one teacher writes "disruptive" and another writes "Disruption," your counts split. You solve that with a dropdown instead of a text box, but you have to remember to solve it. There is no vendor to call when the spreadsheet gets slow at 40,000 rows, and no built-in parent notification, no automated FERPA-aligned access control beyond whatever your Workspace admin configures. Someone on staff owns it, and if that person leaves, the tracking often leaves with them.
Option B — the dedicated platform. PBIS-oriented systems and SIS behavior modules (PowerSchool, Infinite Campus, Skyward, Clever-connected tools, and the long-standing SWIS system from the University of Oregon's PBIS Center) give you referral workflows, tiered-intervention tracking, parent communication, and reports designed around the questions administrators actually get asked at a board meeting. Roster syncing is automatic. Access control is role-based out of the box. Historical data survives staff turnover.
The dedicated platform's weakness is friction and cost. A referral form with 14 required fields, three dropdowns nested inside conditional logic, and a mandatory narrative box takes a teacher four to six minutes. A two-field form takes fifteen seconds. Multiply across a 60-teacher building and the difference between a fifteen-second capture and a four-minute capture is the difference between 900 logged incidents a month and 120. The platform with the better reporting engine often holds the worse data, because the reporting engine is downstream of whatever teachers were willing to type.
The hybrid that most schools actually end up running. Lightweight capture at the classroom level, formal referral in the SIS only when the incident escalates past a defined threshold. Teachers log minors in fifteen seconds; office-managed majors go through the SIS with full documentation. This is the shape the PBIS framework already assumes—the minor/major split is baked into it—and it maps cleanly onto a two-tool setup where the cheap tool handles volume and the expensive tool handles consequence.
The word "complicated" is doing real work in the original question, and it deserves a precise definition. A system is complicated when the number of decisions a teacher must make to log one incident exceeds three. Student, category, submit—that is three. Adding "which intervention did you attempt first," "what was the antecedent," and "select the tier" pushes past the threshold, and compliance falls off a cliff. Keep the classroom capture at three decisions and put every other field in a follow-up the office fills in later.
---
How to Decide Between Them
Decision-making here is not about feature comparison. It is about answering four questions in order, and the first "no" you hit routes you.
Question one: do you have a named owner with at least two hours a week? If nobody owns the spreadsheet, the assembled stack decays inside a semester. Formulas break, someone sorts a column without expanding the selection, and the data becomes untrustworthy. No owner means buy the platform, where the vendor owns maintenance.
Question two: is the data going anywhere official? State reporting, a grant deliverable, a due-process file, a discipline appeal—anything with a legal or funding consequence needs an audit trail, defined retention, and controlled access. Spreadsheets can technically do this; in practice they rarely do. Official destination means SIS or platform.
Question three: how many staff will enter data? Under 15 entering staff, the assembled stack is comfortable. At 40-plus, training and consistency costs start rivaling a platform subscription, and the platform's built-in validation earns its price.
Question four: what is your actual budget? Not the aspirational one. If the number is zero, you have already answered—build the assembled stack well rather than buying a platform badly and abandoning it in year two.
A pilot is non-negotiable regardless of which branch you land on. Five teachers, three weeks, and one metric: what percentage of incidents that those five teachers say happened actually got logged? You find that by asking them at the end of week three to estimate their real incident count and comparing it to the row count. If logged is under 70 percent of estimated, the form is too long—not the teachers' fault, and no amount of reminder emails fixes a structural friction problem.
One more decision input that often gets skipped: what happens to the data at the end of the year? A platform archives it and rolls students forward automatically. A spreadsheet needs someone to duplicate the file, clear the current-year tab, and update the student roster from the new enrollment export. If nobody does that in August, September's data lands in last year's file and the pivots quietly report nonsense.
---
Concrete Numbers Behind Each Option
Numbers are where the "complicated system" argument gets settled. Treat every figure as a planning range to verify against your own quotes and your own clock—vendor pricing varies by district size, state, and contract year, and the time figures below are the ones you should measure locally rather than assume.
Setup time. Assembled stack: three to five hours for a competent spreadsheet user, front to back. That is roughly 45 minutes building the form, an hour setting up the linked sheet with data validation and a lookup table for the student roster, 90 minutes on the pivot dashboard, and an hour of testing on a phone. Platform: implementation is measured in weeks, not hours, because it involves roster integration, role provisioning, and usually a vendor-led training session. Budget four to eight weeks of calendar time even though the actual labor is smaller.
Per-incident entry time. This is the number that decides everything. A two-field mobile form: 10 to 20 seconds. A four-field form with one dropdown and one short note: 30 to 45 seconds. A full SIS referral with narrative, antecedent, intervention attempted, and parent-contact log: three to six minutes. If a teacher logs six minor incidents a day, the assembled stack costs them about two minutes daily and the full referral form costs them 20 to 35 minutes daily—which is why the full referral form does not get used for minors anywhere, ever.

Data volume. A 600-student building running honest minor-incident tracking generates somewhere in the range of 40 to 120 rows a day, so 7,000 to 20,000 rows a school year. Google Sheets handles that without complaint; performance problems do not typically start until you are well past 50,000 rows with heavy formulas. If you are a district rolling up multiple buildings into one sheet, you will cross that line, and that is the point where you move the backing store to a database or accept the platform.
Cost. The assembled stack costs nothing incremental—you already pay for Workspace or Microsoft 365. The staff-time cost is the real one: one owner at two hours a week is roughly 70 hours a school year. Dedicated platforms and SIS behavior modules are typically priced per student per year, and behavior modules are frequently bundled into an SIS contract you are already paying for, which is why the first move is always to check whether you already own the thing you are about to buy. Get an actual quote before you assume either direction; do not budget from a number you read anywhere, including here.
Training. Assembled stack: a 10-minute staff-meeting demo plus a laminated card with the QR code and the three-field rule. Platform: expect a 60- to 90-minute initial session plus a refresher, plus ongoing support for the 20 percent of staff who will not retain conditional-logic forms.
Reporting turnaround. Pivot table on a clean sheet: a by-student, by-period, by-location report in under five minutes once the pivots exist. Platform: instant, because the reports are pre-built—but only for the reports the vendor built. Any custom question means an export to a spreadsheet anyway, which is a real and frequently underrated argument for keeping spreadsheet fluency on staff regardless of what you buy.
The break-even. Rough rule: if your total staff time spent maintaining the assembled stack exceeds what the platform would cost, buy the platform. For a single building with a competent owner, the assembled stack usually stays ahead. At district scale—multiple buildings, roll-up reporting, staff turnover across sites—the platform usually wins, and it wins mostly on continuity rather than features.
---
Implementation Details and Sequencing
Build it in this order and you will not have to redo anything.

Week zero—define the categories before you build anything. Six to eight behavior categories, maximum, written as observable actions rather than judgments. "Out of assigned area," "physical contact," "disrespect toward staff," "property misuse," "off-task after redirect," "positive recognition." Include the positive one; behavior tracking that only records deficits trains staff to see the tool as punitive, and usage drops. Getting these categories agreed on takes longer than building the form and is the single highest-leverage hour in the project.
Week zero, part two—draw the minor/major line explicitly. Write down which categories are always classroom-managed, which are always office-managed, and which depend on severity. Put that list on the same laminated card as the QR code. Ambiguity here is what generates both over-referral and under-logging.
Week one—build capture. The form gets exactly these fields: student (dropdown, populated from your roster export), category (dropdown, the six to eight above), and optional note (short text, capped). Timestamp and submitter are captured automatically—never ask a teacher to type either. Location and period can be inferred from the timestamp and the teacher if your schedule is stable; if it is not, add location as a dropdown and accept a fourth field.
The student dropdown is the part people get wrong. Typing student names free-text guarantees spelling variants that break every downstream count. Export your roster, paste it into a hidden sheet, and drive the dropdown from that range. Re-export in August. If your roster is large enough that a single dropdown is unwieldy, split the form by grade level or use a searchable dropdown, but never fall back to free text.

Week two—build the sheet and the pivots. One raw tab that the form writes to, untouched by humans. One lookup tab holding the roster and the category list. One dashboard tab with pivots: incidents by student descending, incidents by category, incidents by time of day, incidents by submitting staff member. That last pivot is politically sensitive and operationally essential—wide variance in referral rates between teachers teaching similar populations is a coaching signal, not an accusation, and you should decide in advance who sees it.
Week three—pilot. Five teachers, real use, no reminders. At the end, compare logged rows against their estimate of actual incidents. Under 70 percent means cut a field. This is also where you find out that the QR code is in the wrong place, that the form does not autofill on the school-issued tablets, or that the dropdown is too long to scroll on a phone.
Week four—access and privacy. Student behavior data is an education record. Restrict the sheet to named individuals rather than "anyone with the link," turn off download and copy for viewers, and document who has access and why. Check your district's retention schedule and set a deletion or archive date. If you are using a platform instead, this step is mostly configuration rather than construction, but it still requires an actual decision about role permissions—defaults are usually more permissive than you want.

Week five and beyond—the review rhythm. A 20-minute weekly look at the top-10 repeat list, and a monthly look at category and time-of-day patterns. Data nobody reviews stops being entered within about six weeks, and that decay is the most reliable failure mode of any behavior tracking system regardless of cost. The review meeting is the product. The tool is just what feeds it.
What to do when the pilot fails outright. If logged incidents come in under 40 percent of estimated, the problem is usually not the form—it is that staff do not believe anything happens with the data. The fix is to run one review cycle publicly: show the top-10 list, name the intervention that came out of it, and report back two weeks later on whether the pattern changed. Compliance follows visible consequence, not reminders.
Migrating later. If you start with the assembled stack and later buy a platform, your historical data ports cleanly as long as you kept the raw tab clean and used stable student identifiers. Use the student ID from your SIS as a hidden column in the roster lookup rather than relying on names—names change, IDs do not. That one column is the difference between a 20-minute import and a week of reconciliation.
---
Related Questions
Do I need a dedicated app if we already have a student information system?
Usually not. Check the SIS behavior module first—most major systems include one, and you may already be paying for it. Buy separately only if the built-in referral form is too long to use for minor incidents and cannot be shortened.
How many behavior categories should we track?
Six to eight, written as observable actions rather than judgments, with at least one positive category. Fewer than five loses useful signal; more than ten produces inconsistent classification because staff stop reading past the first few dropdown options.
What's the fastest way to get teacher buy-in?
Cut the form to three fields and run one visible review cycle. Show the data, name the intervention that came from it, report the change two weeks later. Buy-in follows visible consequence far more reliably than it follows training or reminders.
Can we track behavior data on paper and digitize it later?
You can, but the digitization never happens consistently. Paper capture at scale reliably produces a backlog nobody clears. A QR code to a mobile form takes the same fifteen seconds and lands in the sheet already structured.
How long should we keep student behavior records?
Follow your district's retention schedule and your state's education-records rules rather than a default. Set an explicit archive or deletion date when you build the system, because indefinite retention of behavior notes is both a privacy risk and a practical liability.
---
FAQ
Is a Google Form and a spreadsheet really enough for a whole school?
For a single building with a named owner, yes. A 600-student school generating 40 to 120 entries a day produces roughly 7,000 to 20,000 rows a year, which a spreadsheet handles without strain. The constraint is not the tool's capacity—it is whether one person owns maintenance, roster refresh, and the weekly review. Lose that person and the system decays inside a semester regardless of how well it was built.
What makes a behavior tracking system "complicated" in practice?
Decision count per entry. If a teacher must make more than three decisions to log one incident, completion rates fall sharply. Conditional logic, required narrative boxes, tier selection, and antecedent fields all add decisions. Push every one of those into an office-side follow-up form and keep the classroom-facing capture to student, category, submit.
Does behavior data need to live in the SIS for compliance?
Anything with a legal, funding, or due-process consequence should live in the system of record with an audit trail and controlled access. Minor classroom incidents used for pattern-spotting generally do not. The practical split is to log minors lightly wherever capture is fastest and enter office-managed majors formally in the SIS.
How do we stop student names from being entered inconsistently?
Drive the student field from a dropdown populated by a roster export on a hidden sheet, and carry the SIS student ID as a hidden column alongside the name. Free-text names produce spelling variants that fragment every count and make later migration to a platform far more expensive than it needs to be.
What's the single most common reason these systems fail?
Nobody reviews the data. Entry volume reliably declines within about six weeks once staff conclude that logging goes into a void. The weekly 20-minute review of the repeat list is the actual product; the form and the dashboard just feed it. If volume starts dropping, check whether the review meeting is still happening before you blame the tool.
Can this approach handle multiple buildings in one district?
Up to a point. Roll-up reporting across several buildings pushes row counts and formula load past what a spreadsheet comfortably serves, and staff turnover across sites makes single-owner maintenance fragile. At district scale the platform usually wins—not on features, but on continuity and role-based access that survives people leaving.
---
Sources
- https://www.pbis.org/
- https://www2.ed.gov/policy/gen/guid/fpco/ferpa/index.html
- https://studentprivacy.ed.gov/
- https://ies.ed.gov/ncee/wwc/
- https://support.google.com/docs/answer/9331169
- https://support.google.com/a/answer/60781
- https://nces.ed.gov/
- https://www.pbisapps.org/products/swis
- https://support.microsoft.com/en-us/office/create-a-form-with-microsoft-forms-4ffb64cc-7d5d-402f-b82e-b1d49418fd9d
---
Related on PULSE
- [What are the best ways to give meaningful feedback on student work without overwhelming yourself in 2027](/knowledge/tr12)
- [How do you handle a student who refuses to work without triggering a power struggle](/knowledge/tr11)
- [What are the best methods for providing accommodations during a whole-class assessment in 2027](/knowledge/tr20)
- [How do you structure a math block to include direct instruction, guided practice, and independent work](/knowledge/tr19)
@Kory-White- · if Venmo asks, the last 4 of my number are 2012
 pulse-teacher-resourcesWhat are the top 10 concrete steps to create a parent-teacher communication calendar that stays on track in 2027
 pulse-teacher-resourcesWhat are the top 10 concrete steps to create a grading scale that is fair across all assignment types in 2027
 pulse-teacher-resourcesWhat are the top 10 ways to make your lesson plans more engaging for reluctant learners in 2027
 pulse-teacher-resourcesWhat are the top 10 ways to create a differentiated homework policy that respects all learners in 2027
 pulse-teacher-resourcesWhat are the top 10 ways to create a weekly parent communication log that is easy to maintain in 2027
 pulse-teacher-resourcesWhat are the top 10 ways to create a lesson plan that meets 504 plan requirements in 2027
 pulse-teacher-resourcesWhat are the top 10 ways to use formative assessment data to adjust your lesson plan mid-class in 2027
 pulse-teacher-resourcesWhat are the top 10 ways to create a classroom management plan that works for a new teacher in 2027
 pulse-teacher-resourcesWhat are the top 10 concrete steps to create a differentiated lesson plan for mixed-ability classrooms in 2027
 pulse-teacher-resourcesHow do you design a unit plan that naturally incorporates spiral review