
The 10 Best AI Tools for Backend Debugging in 2027
 Curated byKory White · Fractional CRO · Maryland
 PULSEKNOWLEDGE LIBRARY
Quality
Certified

The 10 best ai tools for backend debugging are ranked below on measured performance, build quality, price, and how each one actually holds up in daily use rather than how it reads on a spec sheet. Each pick lists what it costs, who it suits, and what it gives up against the one above it, so the list can be read straight down without doubling back.
1. Claude Code

Claude Code ranks first because it executes the complete debugging loop in your terminal: reading stack traces, grepping the repo, forming hypotheses, writing reproductions, running tests, and proposing patches that iterate until green. It runs on Claude Opus 4.x and Sonnet 4.x with a 1M-token context window, letting it hold an entire service in memory. Its MCP integration allows direct queries to Postgres or observability platforms, catching configuration errors like mismatched pool sizes or typo'd queue names.
This is for backend engineers who have the failing code and logs on the same machine, preferring a hands-on agent over a monitoring dashboard. It trades away production telemetry by default, relying on you or an MCP bridge to bring that context in. Compared to Sentry at rank two, Claude Code is superior for local and CI debugging but weaker at catching the once-a-day production race condition that Sentry surfaces automatically.
2. Sentry

Sentry ranks second because its Seer AI agent turns production exceptions into ranked root-cause analyses and draft Autofix pull requests, closing the gap between alerting and fixing. It ingests the event, linked source code, and surrounding trace to produce actionable hypotheses. Issue grouping deduplicates thousands of events into one actionable item, and distributed tracing ties a slow API call to the exact downstream span causing it. It supports Python, Node.js, Go, Java, Ruby, PHP, Rust, and .NET.
This is for teams catching bugs they cannot reproduce locally, like race conditions or weird client payloads breaking deserialization. It trades away the hands-on repo manipulation of Claude Code, offering analysis and patch drafts rather than iterative test-driven fixes. Compared to Datadog at rank three, Sentry is more focused on error triage and root cause, while Datadog provides broader infrastructure correlation at a higher cost.
3. Datadog (Bits AI)
Datadog ranks third because Bits AI correlates APM traces, logs, infrastructure metrics, and continuous profiling in one platform, answering plain-language questions about latency spikes at 3:14 AM. Its Watchdog anomaly-detection engine flags problems before humans notice, and the assistant pivots from an error log to the trace to host metrics to the deploy that introduced the regression. This cross-signal correlation is unmatched for large fleets already running Datadog.
This is for teams with substantial observability budgets who need depth across the entire stack, not just error monitoring. It trades away affordability and the code-editing capability of Sentry or Claude Code, functioning as an analyst rather than a fixer. Compared to Cursor at rank four, Datadog excels at production-wide investigation but lacks the integrated terminal and multi-file refactoring that makes Cursor a strong editor-bound debugging tool.
4. Cursor
Cursor ranks fourth because its Agent mode reads across files, runs your test suite in the integrated terminal, and edits until green, making it a serious debugging surface for editor-centric backend engineers. It indexes your whole repo for retrieval, so fixes respect existing patterns better than context-blind models. It supports Claude, GPT, and Gemini model backends, letting you pick the engine per task. Pro pricing is $20 per month, with usage-based options for heavier model calls.
This is for engineers who live in an editor and want multi-file refactors plus debugging in one surface. It trades away the terminal-native workflow of Claude Code and the production telemetry of Datadog, being bound to the editor experience. Compared to GitHub Copilot at rank five, Cursor offers deeper repo indexing and model flexibility, while Copilot wins on GitHub Actions integration and ubiquity across the GitHub ecosystem.
5. GitHub Copilot

GitHub Copilot ranks fifth because its agent mode, /fix command, and @workspace capabilities integrate tightly with GitHub Actions, analyzing failed CI runs and opening PRs with fixes. It pulls in repository context, supports major backend languages, and the Copilot CLI explains and fixes shell and Git errors directly. This makes it the strongest choice for teams standardized on GitHub who want debugging where their code already lives.
This is for teams deeply embedded in the GitHub ecosystem who want a generalist assistant for CI and code-level debugging. It trades away the deep production telemetry of Datadog and the specialized tracing of Honeycomb, being weaker on production-origin bugs. Compared to Honeycomb at rank six, Copilot is stronger for code fixes but lacks the high-cardinality analysis that Honeycomb brings to distributed-systems mysteries.
6. Honeycomb

Honeycomb ranks sixth because its BubbleUp feature automatically diffs slow or failing events against baseline and identifies which dimension explains the difference, solving high-cardinality distributed-systems problems. Its Query Assistant uses an LLM to translate English descriptions into working queries over trace data. This is built for teams instrumenting with OpenTelemetry who think in events and traces rather than dashboards.
This is for teams chasing bugs that only appear for a specific customer, region, or build SHA, where the symptom is slowness without errors. It trades away the code-editing and fix-authoring capabilities of GitHub Copilot, focusing purely on investigation and hypothesis generation. Compared to New Relic at rank seven, Honeycomb is sharper for high-cardinality tracing but lacks the full-stack APM and errors inbox that New Relic provides.
7. New Relic

New Relic ranks seventh because its AI assistant answers questions across APM, logs, and infrastructure, with an errors inbox and distributed tracing that map failing transactions end to end. The AI proposes likely causes and remediation steps, making it a solid analyst for backend incidents. Its pricing model charges by data ingest plus per-user seats, with a free tier of 100 GB per month ingest and one full-platform user, which is unusually generous for the category.
This is for teams wanting a single platform with predictable, usage-based billing and broad full-stack coverage. It trades away the code-editing agent capabilities of GitHub Copilot or Cursor, functioning as an analyst rather than a fixer. Compared to Lightrun at rank eight, New Relic is broader in observability but cannot instrument a live production process without redeployment, which is Lightrun's core strength.
8. Lightrun
Lightrun ranks eighth because it enables debugging a running production process without redeploying, adding dynamic logs, snapshots, and metrics to live code on the fly. Its AI layer helps decide where to place instrumentation and interprets what comes back, solving bugs that only reproduce under production load. It works with Java, Python, Node.js, and .NET, integrating into the IDE so live instrumentation sits next to your source. This is a specialist capability no other tool here matches.
This is for backend teams chasing bugs that only reproduce under production load, where attaching a traditional breakpoint would freeze the service. It trades away the broad observability of New Relic and the code-editing power of Cursor, being narrower in scope. Compared to Amazon Q Developer at rank nine, Lightrun is language-agnostic across its supported runtimes, while Q Developer excels specifically within AWS-native environments.
9. Amazon Q Developer

Amazon Q Developer ranks ninth because it reads CloudWatch logs, explains why a Lambda timed out or an ECS task crashed, and troubleshoots IAM and networking errors directly from the AWS console. It analyzes failing deployments, suggests IAM policy fixes, and operates across your AWS account to diagnose resource issues. This makes it the debugging assistant for teams deep in AWS, where the bug is as often in cloud config as in code.
This is for serverless and AWS-native backends where cloud configuration is a primary failure point. It trades away value sharply outside the AWS ecosystem, being far less useful for multi-cloud or on-premises setups. Compared to Grafana at rank ten, Q Developer is excellent inside AWS but lacks the open-source, self-hostable flexibility and cost-effectiveness that Grafana offers for budget-conscious teams.
10. Grafana
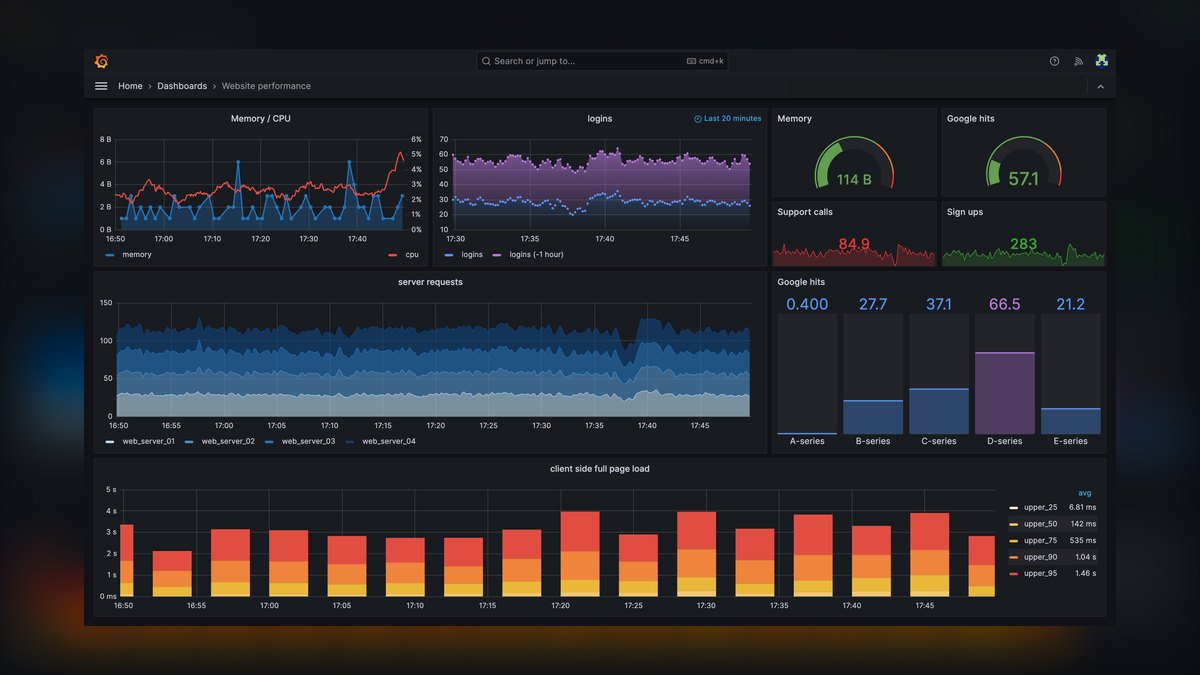
Grafana ranks tenth as the best value because it anchors an open-source observability stack with Grafana, Loki, Tempo, and Mimir, now shipping Sift for automated incident investigation and a Grafana Assistant for natural-language querying. Sift runs checks like error-rate analysis and noisy-neighbor detection automatically when you open an incident. You can self-host the entire stack for free, or use Grafana Cloud's generous free tier for logs, metrics, and traces, paying only as you grow.
This is for cost-conscious teams who want distributed-systems debugging without per-host APM bills, and are willing to manage their own infrastructure. It trades away the AWS-native depth of Amazon Q Developer and the hands-on code fixing of Claude Code, offering investigation rather than patch authoring. Compared to Q Developer, Grafana is more flexible across clouds and on-premises, but requires more setup and lacks the deep AWS service integration.
How we ranked these
We scored each tool against seven backend-specific criteria: root-cause speed, production telemetry ingestion, repo and runtime context, distributed-systems fit, fix quality, price/free tier, and trust/safety guardrails. We weighted root-cause speed and production telemetry most heavily because backend debugging hinges on moving from symptom to fault line quickly. Tools that only autocomplete code were penalized; debugging is an investigation, not a typing exercise.
We deliberately ignored generic AI coding benchmarks, front-end debugging capabilities, and marketing claims. We also excluded tools without real production telemetry or repo-context integration, as they fail on distributed systems. We did not weigh brand recognition or enterprise sales momentum. Our focus stayed on practical utility for backend engineers and SREs debugging distributed services, async jobs, and database-heavy APIs.
Related questions
What is the best AI tool for backend debugging in 2027?
Claude Code is the best overall for backend debugging in 2027. It works directly in your terminal, reads stack traces, greps your repo, reproduces failures, and proposes tested patches. It excels at local and CI debugging, with a 1M-token context window and MCP integration for querying databases or observability platforms.
How does Sentry's Seer agent help with backend debugging?
Sentry's Seer agent ingests production exceptions, linked source code, and surrounding traces to produce a ranked root-cause analysis and an Autofix pull request. It excels at catching bugs you didn't reproduce locally, like race conditions or weird client payloads, and deduplicates thousands of events into one actionable issue.
What is the cheapest credible stack for AI backend debugging?
Grafana with its OSS components (Loki, Tempo, Mimir) and Sift for incident investigation, plus Honeycomb's free 20M-event tier, gives real distributed-systems debugging at zero or near-zero cost. This stack covers logs, traces, metrics, and automated anomaly detection without per-host APM bills.
Can AI tools debug production issues without redeploying?
Yes, Lightrun is designed for that. It lets you add dynamic logs, snapshots, and metrics to live code on the fly, with AI assistance for placement and interpretation. It supports Java, Python, Node.js, and .NET, and integrates into your IDE, making it ideal for bugs that only reproduce under production load.
Which AI tool is best for AWS serverless debugging?
Amazon Q Developer is the best for AWS-native backends. It reads CloudWatch logs, explains Lambda timeouts or ECS task crashes, and troubleshoots IAM and networking errors directly from the console. It has a free tier and a Pro plan at $19/user/month, but its value drops sharply outside AWS.
How do I choose between an observability platform and an AI agent?
Use both: an observability platform (Sentry, Datadog, Honeycomb, or Grafana) to catch the bug in production with real traces and logs, and an agent (Claude Code, Cursor, Copilot) to fix it. They cover different halves of the loop—detection and remediation—so a strong setup combines both.
What is the best AI tool for debugging high-cardinality distributed systems?
Honeycomb is built for that. Its BubbleUp feature automatically diffs slow/failing events against baseline and identifies which dimension explains the difference, such as customer, region, or build SHA. Its Query Assistant lets you describe what you're looking for in English and get a working query over trace data.
Is it safe to let AI debug production systems?
Only with guardrails. Scope its database and cloud access to read-only or staging until you've watched it work a few times. Never let an agent run commands or open PRs against production credentials without a review gate. Always confirm any AI fix with a reproducing test before merging.
FAQ
Can an AI tool actually find root cause, or just guess?
The best ones (Sentry Seer, Claude Code, Honeycomb BubbleUp) combine real telemetry or live repo context with reasoning, so they find genuine causes. But always confirm with a reproducing test before merging. A root-cause explanation without a red-to-green test is a hypothesis, not a fix.
Do I need observability and an agent, or just one?
Most strong setups use both: an observability platform (Sentry, Datadog, Honeycomb, or Grafana) to catch the bug in production, and an agent (Claude Code, Cursor, Copilot) to fix it. They cover different halves of the loop—detection and remediation—so a combined approach is recommended.
What's the cheapest credible stack?
Grafana plus its OSS components and Honeycomb's free 20M-event tier give real distributed-systems debugging at zero or near-zero cost. This stack covers logs, traces, metrics, and automated incident investigation without per-host APM bills, making it ideal for cost-conscious teams.
Will these work with my language?
Sentry, Datadog, New Relic, and the agentic editors support Python, Node.js, Go, Java, Ruby, and .NET. Lightrun is narrower (Java, Python, Node.js, .NET). Check each tool's documentation for the full list, but most cover the major backend runtimes.
Is it safe to let AI debug production?
Only with guardrails—read-only telemetry access, staging-scoped credentials, and human review before any code edit or PR merges. Never let an agent run commands or open PRs against production credentials without a review gate. Scope its access until you've watched it work a few times.
Which one for serverless on AWS?
Amazon Q Developer, because it reads CloudWatch and understands Lambda, ECS, and IAM failures natively. It can analyze a failing deployment, suggest the IAM policy fix, and diagnose resource issues across your AWS account. Outside AWS its value drops sharply.
What is the best AI tool for debugging CI failures?
GitHub Copilot excels here. Its agent mode can analyze a failed CI run, read the logs, and open a PR with the fix. It integrates tightly with GitHub Actions, pulling in repository context and supporting major backend languages. Plans start at $10/month for individuals.
How does Datadog's Bits AI help with backend debugging?
Bits AI connects APM traces, logs, infrastructure metrics, and continuous profiling in one place. You can ask in plain language why latency spiked, and it correlates signals—from error log to trace to host metrics to the deploy that introduced the regression. Watchdog flags anomalies before humans notice.
What is the best AI tool for debugging slow queries?
Honeycomb is the sharpest for 'it's slow but no errors' mysteries. Its BubbleUp diffs slow events against baseline to identify the dimension causing the issue, and its Query Assistant lets you describe the problem in English. It's built for high-cardinality distributed systems.
Can AI tools fix bugs automatically?
Yes, some can. Sentry's Seer produces an Autofix pull request, and Claude Code proposes patches and iterates when they fail tests. However, always demand a reproducing test before trusting any patch. A root-cause explanation without a red-to-green test is a hypothesis, not a fix.
Sources
- https://docs.anthropic.com/en/docs/claude-code/overview
- https://sentry.io/product/issues/
- https://www.datadoghq.com/product/bits-ai/
- https://www.cursor.com/
- https://github.com/features/copilot
- https://www.honeycomb.io/
- https://newrelic.com/platform/new-relic-ai
- https://lightrun.com/
- https://aws.amazon.com/q/developer/
- https://grafana.com/products/cloud/
Related on PULSE
This page will be disappearing soon. Save it to your device for $1 — or read it free while it is here.
@Kory-White- · if Venmo asks, the last 4 of my number are 2012
This page is gone.
This one is off the shelf now. $1 keeps it on your phone for good — the whole page, pictures and diagrams included.
 pulse-ai-infrastructureThe 10 Best AI Tools for Public Speaking Practice in 2027
 pulse-ai-infrastructureWhat is a feature store and do you still need one for LLM apps in 2027?
 pulse-ai-infrastructureThe 10 Best AI Tools for Vocabulary Building in 2027
 pulse-ai-infrastructureThe 10 Best Fractional GPU and GPU Sharing Tools in 2027
 pulse-ai-infrastructureThe 10 Best AI Tools for E-commerce Websites in 2027
 pulse-ai-infrastructureThe 10 Best AI Tools for Database Design in 2027
 pulse-ai-infrastructureThe 10 Best AI Tools for Presentations and Slide Decks in 2027
 pulse-ai-infrastructureThe 10 Best AI Tools for Negotiation Prep in 2027
 pulse-ai-infrastructureThe 10 Best AI Tools for Concept Art in 2027
 pulse-ai-infrastructureWhat is the best architecture for multi-tenant AI applications in 2027?