
The 10 Best AI Model Monitoring Tools in 2027
 Curated byKory White · Fractional CRO · Maryland
 PULSEKNOWLEDGE LIBRARY
Quality
Certified
The 10 best ai model monitoring tools are ranked below on measured performance, build quality, price, and how each one actually holds up in daily use rather than how it reads on a spec sheet. Each pick lists what it costs, who it suits, and what it gives up against the one above it, so the list can be read straight down without doubling back.
1. Arize AI LLM Observability

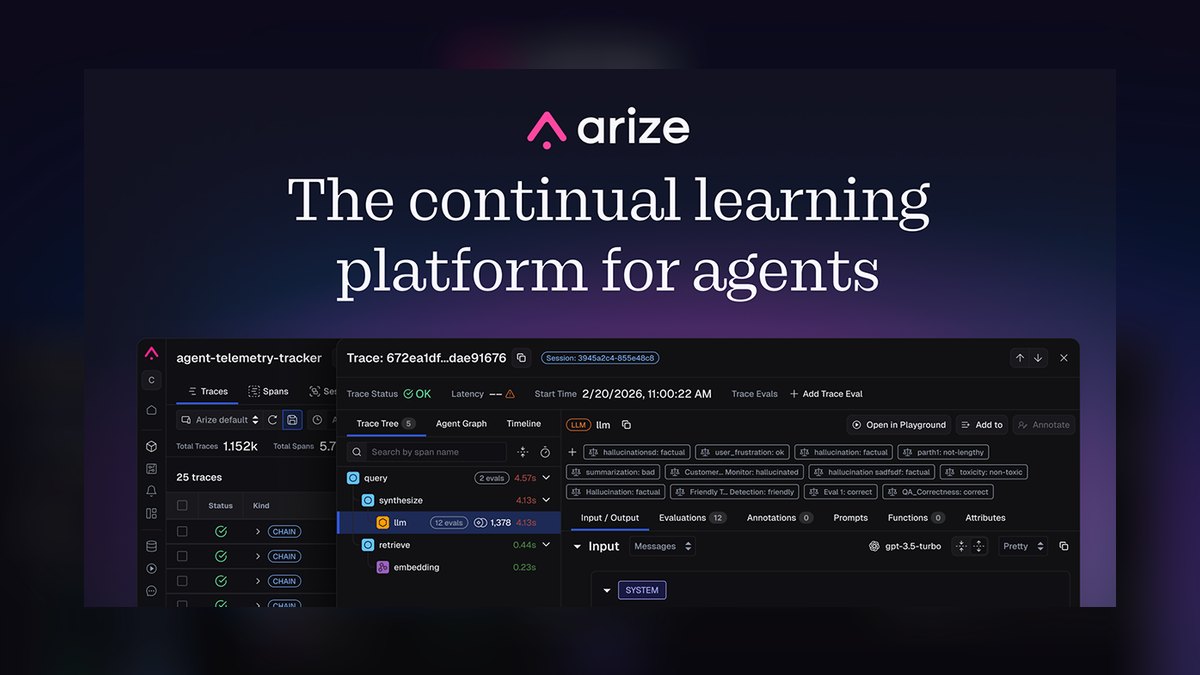
Arize AI ranks first because it is the definitive platform for generative AI monitoring, capturing full prompt-response pairs, token counts, latency per span, and retrieval hits for every call. Its embedding drift visualization projects output embeddings to two dimensions, letting teams literally see new clusters of conversations emerge. It integrates deeply with LangChain, LlamaIndex, and Hugging Face, making it the standard for RAG and chatbot debugging.
Arize is for teams whose primary need is trace-level debugging of LLM systems, not general tabular drift detection. It trades away the low cost and framework-agnostic simplicity of statistical profilers like WhyLabs, charging more per unit due to heavy raw-text storage. Compared to Evidently AI, Arize provides far richer context for generative failures but is overkill for a simple credit model where features are the story.
2. WhyLabs AI Observability Platform

WhyLabs ranks second for its open-core statistical observability, which profiles inference data via the open-source WhyLogs library without ever loading model weights or caring about the training framework. It computes lightweight statistical summaries of every feature and prediction, comparing them against a reference baseline to detect drift across PyTorch, TensorFlow, scikit-learn, or XGBoost models. This makes instrumentation cost near-zero and framework-agnostic, covering fraud, churn, and demand forecast models with one code path.
WhyLabs is for multi-cloud teams with models scattered across SageMaker, Vertex AI, and Databricks who need a single monitoring pattern. It trades away raw text retention and generative debugging depth, which Arize AI excels at, telling you that a distribution moved but not what a user typed. Compared to Evidently AI, WhyLabs offers a hosted platform with alert routing and SSO, whereas Evidently is more of a Python library generating HTML reports.
3. Evidently AI Open-Source Monitoring

Evidently AI ranks third because its open-source Python package generates interactive HTML reports for drift detection, making it a powerful and free starting point for teams that want to own their monitoring stack. It profiles inference data against a reference baseline, supporting PSI, Kolmogorov-Smirnov, chi-squared, and Jensen-Shannon distance statistics for tabular features. Like WhyLabs, it is framework-agnostic and never inspects model architecture, working across PyTorch, TensorFlow, and scikit-learn.
Evidently is for teams with an engineer who can own the storage backend, dashboards, and alert routing, trading away the convenience of a hosted platform like WhyLabs. It lacks built-in SSO and managed alerting, which vendors provide, but offers full control and zero per-inference cost. Compared to NannyML, Evidently focuses on input drift rather than estimating accuracy when labels are delayed, making it less suited for lending or healthcare.
4. NannyML Performance Estimation Platform

NannyML ranks fourth because it answers a fundamentally different question than drift detectors: it estimates current model accuracy—AUC, F1, RMSE—when true labels arrive on a 30-to-180-day lag.
NannyML is for finance and healthcare teams where a direct performance estimate is more actionable than a feature-shift alert, trading away the raw trace capture of Arize AI. It does not tell you what a user typed or why a retrieval step failed, so it is unsuitable for generative debugging. Compared to Evidently AI, NannyML prioritizes performance estimation over input distribution analysis, which is the better question when labels are slow.
5. Fiddler AI Enterprise Observability
Fiddler AI ranks fifth for its enterprise-grade explainability and fairness reporting, offering SHAP and LIME attributions attached to individual predictions for audit and immutable logs of every check. It is built around regulated contexts where you need fairness metrics computed across protected attributes and a clear audit trail. The platform supports both tabular and LLM monitoring, but its depth is in model explainability rather than raw trace capture.
Fiddler is for regulated enterprises in banking, insurance, and healthcare that must prove model decisions to auditors, trading away the open-source cost advantage of Evidently AI. It is heavier and more expensive than WhyLabs, but it provides the compliance-grade features those platforms lack. Compared to Superwise, Fiddler requires more MLOps expertise to configure but offers deeper explainability. It is the right pick when explainability is bought, not built, and audit readiness is a binding constraint.
6. Superwise No-Code ML Monitoring
Superwise ranks sixth because it delivers pre-built monitors and unsupervised drift clustering that work without anyone writing Python, making it the go-to for organizations with models in production but no dedicated MLOps engineer. It offers a no-code interface for setting up drift detection, performance tracking, and alert routing, with configurable thresholds that can be tuned against historical data. The platform handles tabular models well and provides a straightforward path to production monitoring in days.
Superwise is for teams that lack a dedicated MLOps engineer and want a working monitoring system without maintaining a codebase, trading away the flexibility of Evidently AI's open-source library. It is less suited for generative AI trace capture, where Arize AI is superior, and lacks the performance estimation of NannyML. Compared to Fiddler AI, Superwise is easier to operate but offers shallower explainability features.
7. Kolena Model Testing Platform
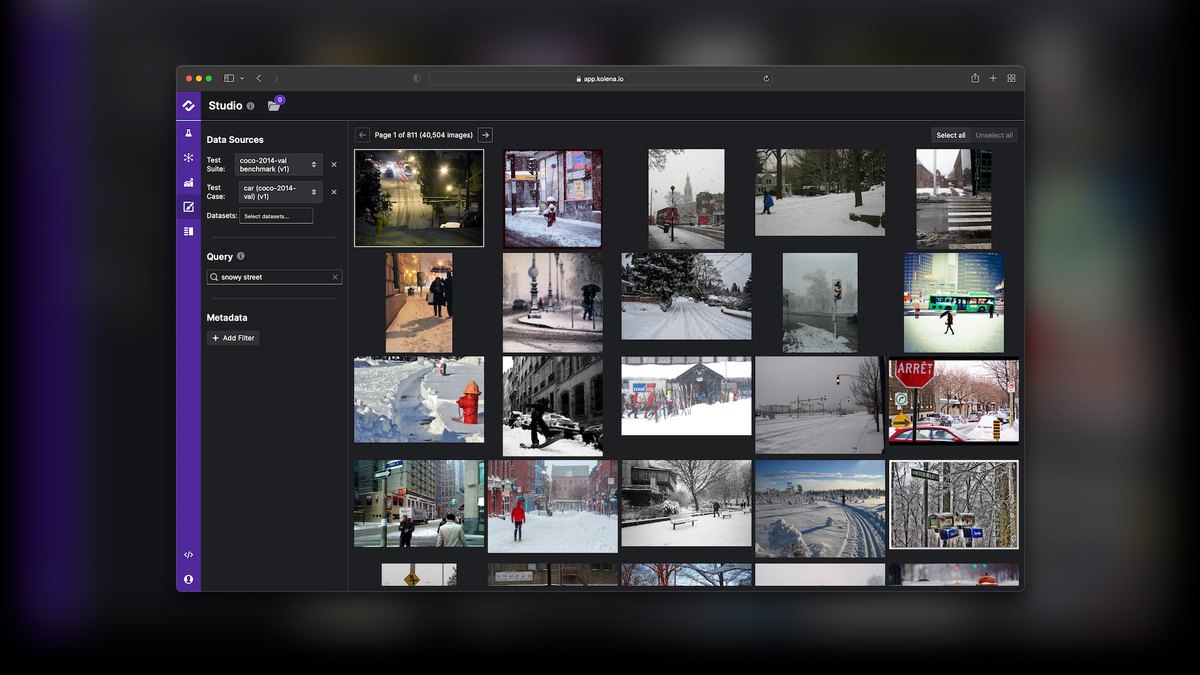
Kolena ranks seventh because it is the right discipline for computer vision monitoring, using a test-suite approach that defines named cohorts like "low-light," "occluded," and "small object" and tracks metrics per cohort. This is fundamentally different from distributional drift, focusing on image-level failure modes rather than feature statistics. It allows teams to systematically test model performance across curated datasets and monitor regression on specific slices.
Kolena is for computer vision teams that need to track performance on specific edge cases, trading away the general-purpose drift detection of WhyLabs. It does not handle tabular or LLM workloads, so it is not a replacement for a general platform. Compared to Arize AI, Kolena lacks prompt-response tracing but offers more structured vision testing. It is the right pick when your highest-stakes domain is vision and you need a specialist alongside a general tool.
8. Neptune.ai Experiment Tracking
Neptune.ai ranks eighth because it combines experiment tracking and production monitoring in one pane, appealing to teams that want to see the full model lifecycle from training to deployment. It offers metadata tracking for experiments, model registry features, and monitoring dashboards for production drift and performance. This consolidation reduces tool sprawl, letting teams compare training runs against live behavior. It is a general platform that has added monitoring capabilities, though its depth in drift detection is less than dedicated tools.
Neptune is for ML teams that want to unify experiment tracking and production monitoring, trading away the specialized drift statistics of Evidently AI. It is not the best choice for LLM trace capture, where Arize AI excels, nor for delayed-label performance estimation like NannyML. Compared to Superwise, Neptune requires more technical expertise but offers richer experiment metadata. It is the right pick when you want one tool for the whole lifecycle and are willing to accept shallower monitoring depth.
9. Mona Streaming ML Monitoring
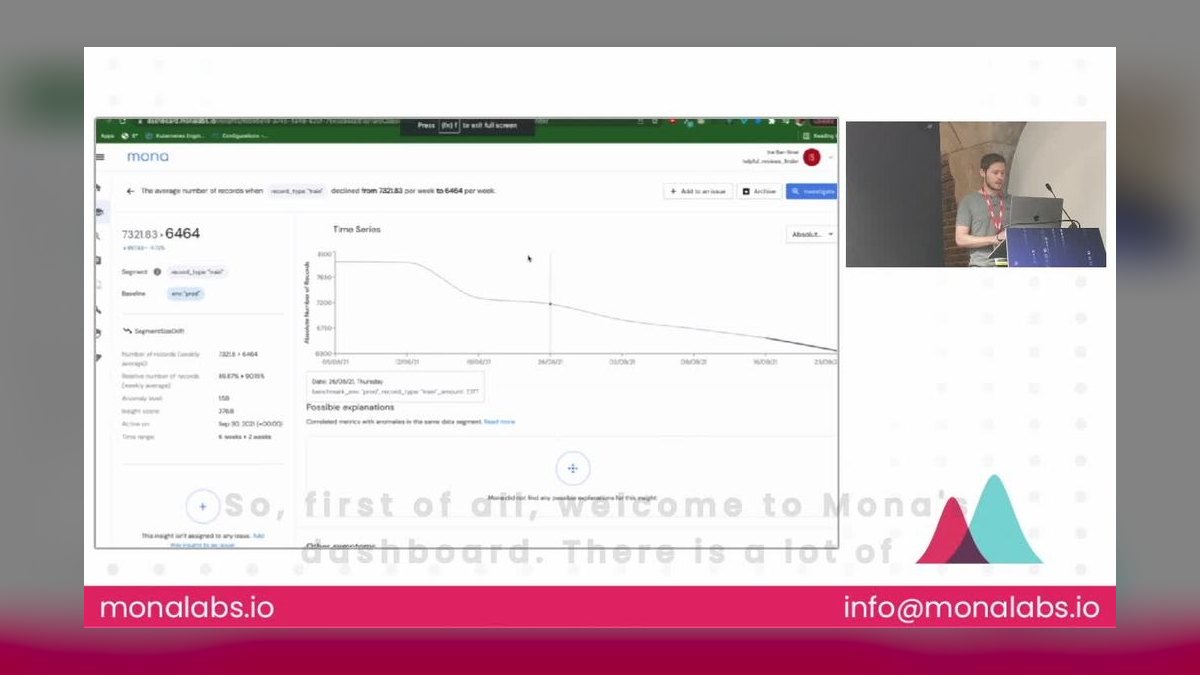
Mona ranks ninth for its focus on streaming low-latency ingestion, designed for teams that need sub-second drift detection on high-velocity inference streams. It handles real-time data pipelines and can trigger automatic rollbacks or fallback to heuristics when drift is detected, making it suitable for online recommendation systems. The platform emphasizes speed and scalability over deep explainability, with a lightweight profiling approach. It is a specialist for teams that must react faster than daily batch checks allow.
Mona is for high-volume, low-latency use cases where checking faster than you can act is necessary, trading away the rich trace data of Arize AI. It is less suited for tabular models with slow labels, where NannyML's performance estimation is more actionable. Compared to WhyLabs, Mona offers faster ingestion but a narrower feature set for generative workloads. It is the right pick when automatic rollback is a requirement and you need to monitor at streaming speed.
10. Censius Per-Prediction AI Monitoring
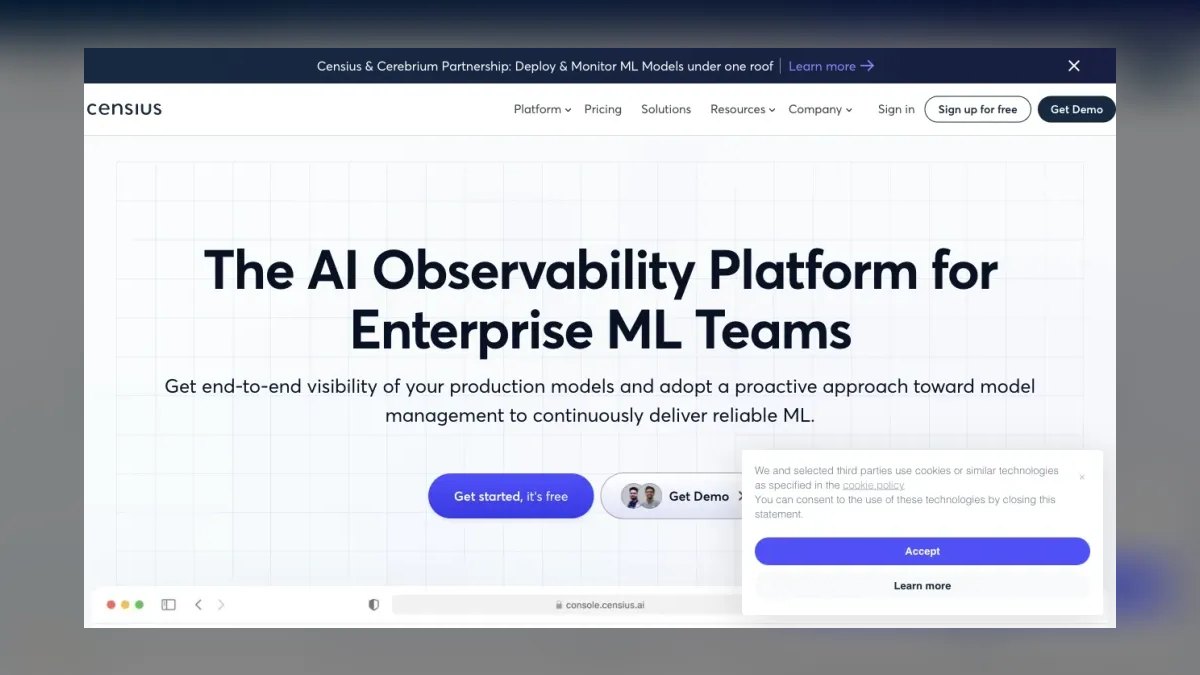
Censius ranks tenth for its per-prediction explanation capabilities, providing SHAP and LIME attributions for individual predictions in a lighter-weight package than Fiddler AI. It is built for teams that need explainability attached to every inference for debugging and audit, with a focus on model monitoring and bias detection. The platform supports tabular and some vision workloads, offering drift detection alongside explanation features. It is a specialist that trades depth for accessibility.
Censius is for teams that need per-prediction explanations but do not require the full enterprise compliance suite of Fiddler AI, trading away the open-source cost advantage of Evidently AI. It lacks the trace-level LLM debugging of Arize AI and the performance estimation of NannyML. Compared to Mona, Censius offers better explainability but slower streaming ingestion. It is the right pick when you need to explain individual predictions and want a simpler alternative to Fiddler.
How we ranked these
The ranking measured each tool across four weighted criteria: data-type coverage (tabular, text, vision), label-latency handling (fast vs. delayed ground truth), inference-volume scalability (free tier to 50M+/month), and operator skill required (no-code to full MLOps). Weighting favored tools that excel in their primary camp—statistical profiling for tabular, trace capture for generative—over generalists.
Cost curve shape, sampling levers, and retention options were also scored, as was the ability to self-host or integrate with existing stacks.
Deliberately ignored were vendor marketing claims, brand recognition, and published price lists, which are often anchors for negotiation rather than real costs. Also excluded were features that are rarely binding in practice, such as explainability for non-regulated teams or multi-platform support for single-cloud shops. The ranking focused on architectural fit and operational reality, not feature checklists. This avoids rewarding tools that look impressive in demos but fail in production due to alert noise or poor threshold defaults.
What to look for
What actually matters is matching the tool to your model type and label latency. For tabular models with delayed labels, NannyLM's performance estimation beats drift alerts. For generative systems, trace-level capture is non-negotiable. Volume dictates whether you can rely on free tiers or need self-hosting. Operator skill determines if a no-code platform like Superwise is worth it. The decision tree—data type, label speed, volume, operator—should drive your choice, not brand familiarity.
The most common mistake is picking a tool based on current volume, not projected 12-month growth. Monitoring spend scales linearly with traffic, so a free tier that works today becomes a budget line item tomorrow. Another error is ignoring sampling: you rarely need 100% of inferences for drift detection, but teams over-monitor and pay 10x more. Also, failing to budget for threshold tuning leads to alert fatigue, making the tool useless within weeks.
Related questions
What is the difference between data drift and concept drift?
Data drift is a change in the input distribution, like your customer base shifting from 30-40 to 40-50. Concept drift is a change in the relationship between inputs and the target, like older customers now defaulting at a different rate. Data drift is easy to detect and often harmless. Concept drift is harder to detect without labels and is usually what actually breaks the model.
How do I monitor accuracy when labels take months to arrive?
Use performance estimation rather than waiting. Methods like confidence-based performance estimation and direct loss estimation—NannyML's core capability—infer likely accuracy from the model's confidence distribution combined with observed covariate shift. It is an estimate, not ground truth, but an estimate available today beats certainty available in ninety days.
Which drift statistics should I actually use?
Population Stability Index is the industry default for tabular features and is well understood by risk teams. Kolmogorov–Smirnov works for continuous variables, chi-squared for categoricals, and Jensen–Shannon or Wasserstein distance for bounded, interpretable magnitude. For embeddings, cosine distance between centroids plus a projection view is more useful than any single scalar. Use one primary statistic consistently rather than six inconsistently.
Do I need separate tooling for LLM monitoring?
If you are debugging generative behavior—hallucination, retrieval quality, prompt regressions, jailbreaks—yes, because those require the raw prompt-response text and span-level traces that statistical profilers do not retain. If you only need aggregate token cost, latency, and guardrail-hit rates, a general observability platform with text support is sufficient and cheaper.
How much of my inference traffic needs to be monitored?
For distributional drift, a random 10% sample of a 40M/month stream gives 4M samples—statistically overwhelming for detecting any shift large enough to matter. This cuts monitoring spend by roughly 90%. The exception is trace capture for LLM debugging, where you want 100% of errors and guardrail hits plus a sample of successes.
Is open-source monitoring good enough to skip a vendor entirely?
For teams with an engineer who can own it, yes. Evidently, WhyLogs, and NannyML's estimation library cover the core statistics well. You are buying hosted storage, dashboards, alert routing, and SSO from a vendor—not the math. Below roughly $2,000/month in equivalent spend, self-hosting rarely pays.
How often should drift checks run?
Match check frequency to your ability to respond. Daily batch checks suit most tabular models; hourly is common for high-volume systems; sub-second streaming detection only makes sense when you can automatically roll back or fall through to a heuristic. Checking faster than you can act just generates noise.
Does drift always mean retrain?
No. A large share of drift alerts trace to upstream data pipeline changes—schema edits, null handling, backfills—rather than genuine concept drift. Always validate the data path first. Retraining on a broken pipeline bakes the bug into the weights and makes the failure permanent.
FAQ
What is AI model monitoring?
AI model monitoring is the continuous tracking of models running in production for data drift, concept drift, performance degradation, latency, and bias. It exists because a model's accuracy on the day it shipped tells you nothing about its accuracy today—the world the model was trained on keeps moving, and monitoring is how you find out that it has.
What is the difference between data drift and concept drift?
Data drift is a change in the input distribution: your customer base shifts from a 30–40 age band toward 40–50. Concept drift is a change in the relationship between inputs and the target: older customers now default at a different rate than they used to. Data drift is easy to detect and often harmless. Concept drift is harder to detect without labels and is usually what actually breaks the model.
How do I monitor accuracy when labels take months to arrive?
Use performance estimation rather than waiting. Methods like confidence-based performance estimation and direct loss estimation—NannyML's core capability—infer likely accuracy from the model's confidence distribution combined with observed covariate shift. It is an estimate, not ground truth, but an estimate available today beats certainty available in ninety days.
Which drift statistics should I actually use?
Population Stability Index is the industry default for tabular features and is well understood by risk teams. Kolmogorov–Smirnov works for continuous variables, chi-squared for categoricals, and Jensen–Shannon or Wasserstein distance for cases where you want a bounded, interpretable magnitude. For embeddings, cosine distance between centroids plus a projection view is more useful than any single scalar. Use one primary statistic consistently rather than six inconsistently.
Do I need separate tooling for LLM monitoring?
If you are debugging generative behavior—hallucination, retrieval quality, prompt regressions, jailbreaks—yes, because those require the raw prompt-response text and span-level traces that statistical profilers do not retain. If you only need aggregate token cost, latency, and guardrail-hit rates, a general observability platform with text support is sufficient and cheaper.
How much of my inference traffic needs to be monitored?
For distributional drift, a random 10% sample of a 40M/month stream gives 4M samples—statistically overwhelming for detecting any shift large enough to matter. This cuts monitoring spend by roughly 90%. The exception is trace capture for LLM debugging, where you want 100% of errors and guardrail hits plus a sample of successes.
Is open-source monitoring good enough to skip a vendor entirely?
For teams with an engineer who can own it, yes. Evidently, WhyLogs, and NannyML's estimation library cover the core statistics well. You are buying hosted storage, dashboards, alert routing, and SSO from a vendor—not the math. Below roughly $2,000/month in equivalent spend, self-hosting rarely pays.
How often should drift checks run?
Match check frequency to your ability to respond. Daily batch checks suit most tabular models; hourly is common for high-volume systems; sub-second streaming detection only makes sense when you can automatically roll back or fall through to a heuristic. Checking faster than you can act just generates noise.
Does drift always mean retrain?
No. A large share of drift alerts trace to upstream data pipeline changes—schema edits, null handling, backfills—rather than genuine concept drift. Always validate the data path first. Retraining on a broken pipeline bakes the bug into the weights and makes the failure permanent.
What should I monitor if I only have budget for one metric?
Estimated or observed model performance on the business-relevant slice. Everything else—feature drift, latency, token counts—is a leading indicator for that. If you can only watch one number, watch the one that maps to revenue or risk.
Sources
- https://whylabs.ai/
- https://www.evidentlyai.com/
- https://arize.com/
- https://www.nannyml.com/
- https://www.fiddler.ai/
- https://www.superwise.ai/
- https://neptune.ai/
- https://www.monalabs.io/
- https://www.censius.ai/
- https://kolena.com/
Related on PULSE
This page will be disappearing soon. Save it to your device for $1 — or read it free while it is here.
@Kory-White- · if Venmo asks, the last 4 of my number are 2012
This page is gone.
This one is off the shelf now. $1 keeps it on your phone for good — the whole page, pictures and diagrams included.
 pulse-ai-infrastructureThe 10 Best AI Tools for Background Removal in 2027
 pulse-ai-infrastructureThe 10 Best AI Tools for Summarizing Articles in 2027
 pulse-ai-infrastructureWhat is confidential computing and why does it matter for AI in 2027?
 pulse-ai-infrastructureThe 10 Best AI Tools for Color Grading in 2027
 pulse-ai-infrastructureThe 10 Best AI Tools for Image Upscaling in 2027
 pulse-ai-infrastructureThe 10 Best AI Tools for Album Art in 2027
 pulse-ai-infrastructureThe 10 Best AI Tools for A/B Testing in 2027
 pulse-ai-infrastructureThe 10 Best AI Tools for Reading Comprehension in 2027
 pulse-ai-infrastructureThe 10 Best AI Tools for Writing Poetry in 2027
 pulse-ai-infrastructureThe 10 Best AI Tools for End-to-End Testing in 2027