


Highest-revenue franchises to own in 2027
Quality
Certified
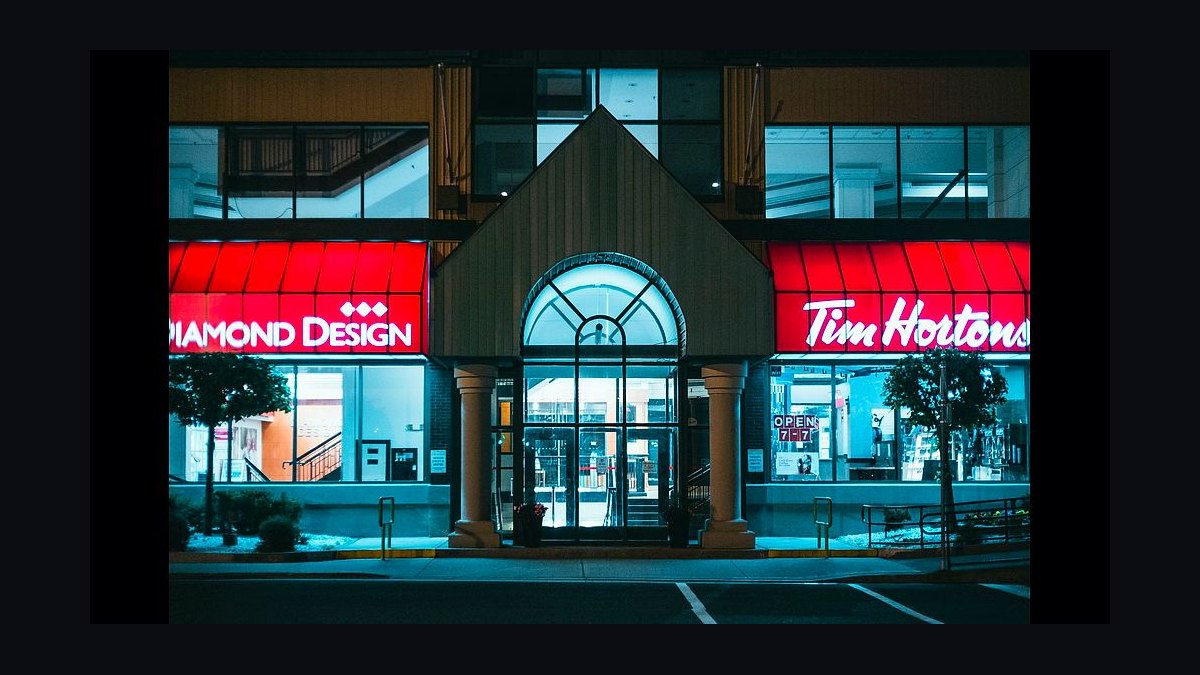
In 2027, the highest-revenue franchises per unit are elite quick-service brands — Chick-fil-A averages roughly $9 million per location, with Raising Cane's, Whataburger, and other top QSR names posting $3M–$6M+ — plus capital-intensive categories like express car washes and healthcare clinics. High revenue rarely equals high take-home: royalties, profit splits, and real estate costs eat deeply into these top-line numbers.
The outcome you should expect
Chasing the highest-revenue franchises produces a specific, predictable outcome: large top-line numbers that do not translate proportionally into owner income. This is the single most important expectation to set before researching any brand on a "highest revenue" list. A $9 million Chick-fil-A location sounds extraordinary next to a $2 million sandwich shop, but once you subtract a 15% royalty, a 50% pre-tax profit split, roughly 3.25% marketing fees, labor running 25–30% of revenue, food costs at 30–35%, and rent consuming 10–15% of gross sales in a prime corridor, the operator's realistic take-home commonly lands in the low-to-mid six figures — a strong outcome, but nowhere near "half of $9 million."
The outcome you should expect, then, is this: the brands with the biggest average unit volume (AUV) numbers are usually also the brands with the steepest royalty structures, the most selective approval processes, and the highest capital requirements. Revenue and return move independently, sometimes in opposite directions. A franchisee evaluating Whataburger (AUV $3M–$5M, royalty 4–6%) may walk away with a better cash-on-cash return than one who wins a Chick-fil-A slot, simply because less of the top line is clawed back before it reaches the owner.

You should also expect a long runway before you see any of this money. Top-tier QSR brands require $2 million to $8 million in initial investment, multi-month build-outs, and — for brands like Chick-fil-A — a multi-year, highly competitive approval pipeline with an approval rate under 1%. If your capital, experience, and patience don't match the brand's selectivity, the realistic outcome is rejection, not revenue. For operators who do get in, the first 18–24 months typically underperform the brand's published AUV by 15–25% while they build local traffic, staff, and operational consistency — so the "outcome" in year one looks meaningfully different from the glossy average-unit-volume figure quoted in marketing materials and even in the Franchise Disclosure Document (FDD) summary.
Finally, expect the revenue number itself to mask enormous variance. Within any single highest-revenue franchise brand, a top-quartile location can generate 40–60% more revenue than a bottom-quartile location in the same system. "Highest revenue" is a system-wide average; your specific site could land well above or well below it depending on traffic counts, daypart mix, and local competition.
What drives that outcome

Four mechanical forces determine why a franchise's reported revenue rarely equals a proportional increase in owner wealth, and understanding them is more useful than memorizing any single AUV figure.
Royalty and profit-split structure is the biggest driver. Chick-fil-A's model is the extreme case: a 15% royalty on gross sales plus a 50% split of net profit, which functionally converts the "franchisee" into an operating partner rather than a traditional unit owner. Compare that to Raising Cane's flat 5% royalty plus a 2% marketing fee, or Whataburger's 5% royalty plus 1.5% local advertising — both lighter loads that let more of each revenue dollar flow to the operator. A brand that reports a lower AUV but charges a lower royalty can out-earn a flashier, higher-revenue brand on a per-dollar-invested basis.
Real estate and occupancy cost is the second driver, and it scales directly with revenue in high-traffic markets. A $9 million unit in a prime corridor can pay $900,000 to $1.35 million annually in rent alone — 10 to 15% of gross sales. Franchises that own their real estate (rare) or secure below-market ground leases retain far more of their revenue than those paying premium rents to capture premium traffic.
Labor and input costs compress margins further. Food-driven QSR concepts run food costs at 30–35% and labor at 25–30% of revenue, which is why even a $9M unit often nets only 8–15% in profit margin — impressive in raw dollars, but not dramatically better, percentage-wise, than many lower-revenue, lower-overhead franchise categories.
Site selection and market position is the variable most under the operator's control and most often underweighted. The same brand can produce wildly different revenue at different addresses, so the driver isn't the brand name — it's the intersection of brand economics with a specific piece of real estate.
Benchmarks and realistic ranges
Use these 2026-FDD-sourced ranges as a starting point, then always confirm current figures in the specific brand's live Item 19 disclosure before modeling anything.

Top-tier QSR. Chick-fil-A: AUV near $9M, investment $2.2M–$4.5M (excluding land), 15% royalty + 50% profit split, approval rate under 1%. Raising Cane's: AUV commonly cited at $4M–$6M+, investment $3.5M–$6.2M, 5% royalty + 2% marketing — though the brand is largely company-operated, limiting outside franchising opportunity. Whataburger: AUV $3M–$5M, investment $3.8M–$7.5M, 5% royalty + 1.5% local advertising. Across this tier, land acquisition in prime markets adds another $1M–$3M beyond the construction and equipment figures, and most franchisors require 3–6 months of liquid operating reserves, typically $200,000–$500,000 for a unit this size.
Express car washes. Mister Car Wash, Take 5, and Tommy's Express-type concepts report AUVs of $1.2M–$2.5M, with top performers exceeding $3M, on 5–7% royalties. Total investment including real estate runs $3M–$7M+. Gross margins of 50–60% and crews of just 3–5 employees per shift make the revenue-to-labor ratio considerably more favorable than food-service QSR, even though the AUV is lower in absolute terms.
Healthcare and urgent care. Clinics modeled on brands like American Family Care, PT Solutions, and Aspen Dental report AUVs of $1.5M–$4M, with some multi-provider locations exceeding $5M, against initial investments of $500,000–$1,500,000+. Revenue here is driven by visit volume and payer mix rather than foot traffic, which changes the operating skill set entirely — licensing, staffing credentials, and insurance reimbursement cycles replace drive-thru throughput as the limiting factor.

Coffee and beverage drive-thrus. Leading small-footprint concepts post strong AUVs relative to their square footage, with 6–8% royalties — a small footprint relative to revenue, when it works, produces attractive returns, though the category is increasingly competitive and saturated in strong markets.
Pet care. Camp Bow Wow, Dogtopia, and Scenthound-type concepts post AUVs of $800K–$1.8M, with premium locations reaching $2.5M, against total investments of just $500K–$1.5M. The membership-driven, recurring-revenue model (boarding, daycare, grooming) often delivers a better risk-adjusted return per dollar invested than fighting for a single slot in a 0.5%-approval-rate QSR brand.
Risks, edge cases, and failure modes
The most common failure mode is revenue-chasing without a take-home model — buying into the brand with the biggest AUV headline without first subtracting royalty, profit split, rent, labor, and food cost to see what actually reaches the owner. A brand with a $9M AUV and a 15%-royalty-plus-50%-split structure can leave less in an operator's pocket than a $3M brand with a 5% royalty and no profit split.

A second risk is approval-rate mismatch. Brands at the top of any highest-revenue list are also the most selective — Chick-fil-A approves under 1% of applicants, and other top brands prioritize operators with prior restaurant ownership and strong balance sheets. Under-capitalized or first-time buyers who target only the flashiest AUV brands will spend years in a process that ends in rejection, while comparable capital deployed into a less selective, still-strong-margin brand could already be generating returns.
A third risk is market saturation. Industry analysis has found that brands with more than 500 units in a single state saw per-unit revenue decline 3–8% annually in that state even as total system revenue kept growing — new units cannibalizing existing ones. Before buying into a highest-revenue brand, ask for store-on-store sales trends in your specific metro, not just the system-wide average; flat or declining same-store sales alongside heavy new-unit development in your market is a red flag that the "highest revenue" figure you were shown is historical, not forward-looking.
A fourth risk is underestimating the ramp period. First-time operators typically run 15–25% below brand-average revenue for the first 18–24 months, which strains debt service and working capital exactly when reserves are thinnest. A fifth, related edge case is land and real estate exposure — brands that don't offer real estate ownership or protected territory (common among sandwich and sub-sandwich chains, less common at Whataburger) expose the operator to rent increases and nearby cannibalization without recourse.

Finally, treat average unit volume itself as a range, not a point estimate. Item 19 disclosures typically show the spread between the 25th and 75th percentile location; a system average pulled up by a handful of exceptional sites can mislead an operator into underwriting a location that will, realistically, land well below the headline number.
A practical rollout plan
Evaluating and pursuing a highest-revenue franchise opportunity works best as a sequence, not a single decision.
Step one — pull the real documents. Request the current Item 19 (average unit volume, with percentile spread, not just the mean), Item 7 (total investment required), and Item 6 (ongoing royalty, marketing, and any profit-split fees) for every brand you're comparing. Never rely on a marketing one-pager.
Step two — build a take-home model, not a revenue ranking. For each candidate brand, subtract realistic food/input cost, labor, rent or occupancy, royalty, marketing fee, and any profit split from the AUV to estimate annual owner take-home. Divide that by the total cash required under Item 7 to get a cash-on-cash return. Rank brands by that number, not by raw revenue.

Step three — stress-test against saturation and site quality. Pull store-on-store sales trends for your target metro and the brand's percentile spread in Item 19. Walk away from markets showing flat or declining same-store sales alongside aggressive new-unit growth.
Step four — confirm you meet the brand's real selectivity bar. Match your liquid capital, net worth, and operating experience against the brand's stated franchisee profile before investing time in the process — especially for sub-1%-approval brands.
Step five — underwrite the ramp, not just the steady state. Model 15–25% below AUV for months 1–24 and confirm your working-capital reserve (typically $200,000–$500,000 for high-volume concepts) covers that gap.
Related questions
Is Chick-fil-A the best franchise to own for revenue?
It has the highest average unit volume in QSR, around $9M, but its 15% royalty and 50% profit split mean take-home is far lower than the revenue figure implies, and approval is under 1%.
Does higher franchise revenue mean higher profit?

No. Royalty rates, profit splits, rent, labor, and food costs vary by brand, so a lower-AUV franchise with lighter fees can out-earn a higher-AUV brand on take-home and return.
What non-food franchises have high per-unit revenue?
Express car washes ($1.2M–$2.5M AUV) and healthcare clinics like urgent care and dental ($1.5M–$4M AUV) are the strongest non-food categories, often with better labor cost ratios than QSR.
How much capital do I need for a top-revenue franchise?
Top QSR brands require $2M–$8M including real estate; car washes $3M–$7M+; healthcare clinics $500K–$1.5M+; pet care concepts as little as $500K–$1.5M total.
FAQ
What is the highest-revenue franchise per unit in 2027? Chick-fil-A leads with an average unit volume near $9 million, followed by Raising Cane's, Whataburger, and other top QSR brands in the $3M–$6M+ range, per 2026 FDD disclosures.
Do high-revenue franchises guarantee high profits?

No. High revenue often comes with steep royalties and profit splits — Chick-fil-A charges 15% plus a 50% profit split — so net owner take-home can be far lower than the headline revenue suggests.
How much does it cost to open a top-revenue franchise? QSR leaders require $2.2M–$7.5M depending on brand, plus $1M–$3M for land in prime markets and $200,000–$500,000 in required working capital reserves.
Are the highest-revenue franchises easy to get approved for? No. Chick-fil-A approves under 1% of applicants, and other leading brands prioritize experienced, well-capitalized operators with a proven food-service or multi-unit track record.
What other franchise categories post high revenue per unit? Express car washes and healthcare clinics (urgent care, dental, physical therapy) can generate $1M–$4M+ per unit, typically with better labor cost ratios than restaurant concepts, though capital requirements are still substantial.
Where can I find current revenue data for a specific franchise? Request the brand's current FDD and review Item 19 for average unit volume and percentile spread, and Items 6 and 7 for royalty structure and total investment.
Sources
- https://www.ftc.gov/business-guidance/resources/franchise-rule-compliance-guide
- https://www.franchise.org
- https://www.entrepreneur.com/franchises/top-franchises
- https://www.qsrmagazine.com
- https://www.restaurantbusinessonline.com
- https://www.franchisetimes.com
- https://www.chick-fil-a.com/franchising
Related on PULSE
This page will be disappearing soon. Save it to your device for $1 — or read it free while it is here.
@Kory-White- · if Venmo asks, the last 4 of my number are 2012
This page is gone.
This one is off the shelf now. $1 keeps it on your phone for good — the whole page, pictures and diagrams included.
 pulse-franchisesWhat is a franchise renewal and what happens when the term ends in 2027?
 pulse-franchisesBest chicken and wings franchises to buy in 2027
 pulse-franchisesBest beauty and hair salon franchises to buy in 2027
 pulse-franchisesHow much do Franchises cost in 2027?
 pulse-franchisesBest ice cream and frozen dessert franchises to buy in 2027
 pulse-franchisesShould I open or buy a Days Inn franchise in 2027?
 pulse-franchisesHow do I read a Franchise Disclosure Document (FDD) before buying a franchise in 2027?
 pulse-franchisesBest auto-parts and tire franchises to buy in 2027
 pulse-franchisesHow do I get financing to buy a franchise in 2027?
 pulse-franchisesWhat does Item 19 of an FDD really tell you about franchise earnings in 2027?