


“Revenue Is a Lagging Indicator of Trust” — Quote Card
Quality
Certified
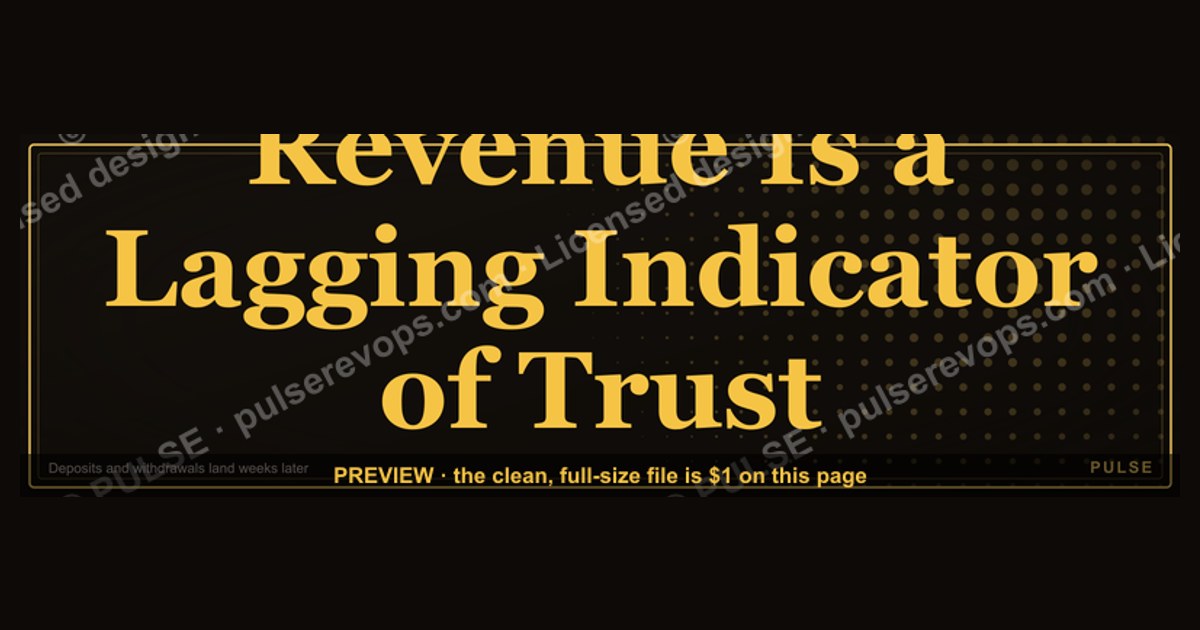

The phrase means revenue only shows up after trust has already been earned or lost. Trust is the leading input; revenue is the delayed receipt. By the time a number moves, the credibility that caused it was built — or broken — weeks or quarters earlier, in demos, onboarding, renewals, and support conversations.
The quarter that looked fine until it didn't
Picture a Series B software company closing March at 104% of plan. The board deck is green. Six weeks later, April and May both come in at 71%, and nobody can point to a single cause. Nothing broke. No competitor launched. Pricing didn't change. The team is running the same playbook that produced the green quarter.
What actually happened is that the green quarter was harvesting trust deposits made the previous fall — a well-run implementation for three reference accounts, a support team that answered on weekends during a migration, a product marketing push that told buyers the honest version of what the platform couldn't yet do. Meanwhile, during that same green quarter, the company was quietly making withdrawals: it stretched a two-person implementation team across nine new logos, shipped a release that broke a common integration, and pushed reps to pull Q2 deals forward with end-of-quarter discounts. Those withdrawals didn't show up in March's number. They showed up in April's, and in the referral calls that never got made.
This is the practical meaning of the quote card. A revenue dashboard is a rear-view mirror with a lag measured in weeks for transactional businesses and in quarters for enterprise ones. Everything a leader can actually *do* — the decisions available today — sits upstream of the number, in the trust layer. The dashboard tells you where you've been. It cannot tell you where you're going, because the causes of next quarter's revenue are happening in conversations that nobody is metering.

The failure mode this creates is specific and common: leaders react to the lagging number with lagging-number tactics. Revenue is soft, so they add discount authority, increase outbound volume, or add a sales headcount. Each of those is a withdrawal from the trust account dressed as a fix. Discounting teaches buyers your list price is fiction. Volume outbound with weak targeting teaches your market that your brand is noise. New reps hired without ramp capacity means more first calls handled badly. The number gets worse two quarters later, and the same reflex fires harder.
A useful diagnostic question when a number moves: *what did we do 60 to 180 days ago that would have produced this?* If a team cannot answer that, it is managing the harvest and ignoring the soil. Notably, this applies symmetrically — a good quarter deserves the same question. Unexplained outperformance is often trust that was banked before the current leadership arrived, and it burns down just as silently.
How the mechanism actually works
Trust functions as a friction reducer at every stage of a commercial relationship. It doesn't create demand out of nothing; it lowers the cost, in time and in concessions, of converting demand that already exists. That distinction matters because it explains the lag precisely.

Consider what a buyer is actually doing when evaluating a purchase. They are pricing risk — the risk that the product doesn't do what the demo showed, that implementation takes triple the estimate, that the vendor deprioritizes them after the contract signs, that they personally look foolish for having championed it. Every one of those risks has a mitigation cost: more reference calls, a longer pilot, a security review, a legal negotiation over SLAs, an extra stakeholder pulled into the decision. Trust is what lets a buyer skip mitigations. A buyer who believes you removes steps from their own process.
That's why trust shows up first in *cycle length and step count*, not in bookings. A prospect who trusts you asks for two reference calls instead of five, accepts a 30-day pilot instead of 90, and lets a single champion carry the internal case rather than assembling a committee. The deal closes — but it closes in the next quarter, which is why the bookings line moves later than the trust did.
The same mechanism runs in reverse on the retention side. A customer who trusts you files a ticket when something breaks. A customer who doesn't trust you starts a vendor evaluation and files the ticket as documentation. Both look identical in a support queue. Only one of them renews. Churn, therefore, is an even more lagging indicator than new revenue, because the decision to leave is typically made months before the contract date makes it visible.
There is an upstream layer worth naming, because most teams stop at the sales conversation. Trust is also produced by things sales never touches: documentation quality, status page honesty during outages, whether the pricing page has a number on it, how quickly a support email gets a human, whether the product does what the website says without an asterisk. A prospect forms a trust estimate from these artifacts before a rep is ever involved. When marketing writes copy the product can't back up, it is spending trust the sales team will have to repay at close. This is why the trust ledger is a company-wide account and not a sales-team metric — a single team can drain it and a different team gets the bill.
Real numbers, ranges, and benchmarks

Because the causal chain is delayed, the practical work is finding metrics that move *early* — proxies that respond to trust within weeks rather than quarters. These are directional ranges that vary substantially by segment, motion, and deal size; treat them as starting points to baseline against your own history, not as universal targets.
Cycle length and its rate of change. The absolute number matters less than the trend. Track median (not mean — a single 400-day whale distorts the average) days from first meeting to closed-won, segmented by deal size band. A cycle that shortens quarter over quarter while discount depth holds flat is the cleanest trust signal available, because it means buyers are removing their own verification steps voluntarily. A cycle that shortens *while discounts deepen* is the opposite signal: you bought the speed.
Discount depth as a trust tax. Measure average discount off list, and separately, the percentage of deals that close at list or near-list. That second number is the more honest one. If the share of at-list deals is falling while win rate holds, the team is trading margin for trust it hasn't earned. Track when in the cycle the discount gets requested — a discount asked for in week two is a price objection; a discount asked for in the final week is often a risk objection wearing a price costume, and the right response is a risk mitigation (a shorter initial term, a success-milestone-based ramp), not a price cut.
Stakeholder count and meeting count per closed deal. Rising numbers of required stakeholders and meetings for the same deal size is one of the earliest observable trust erosions, and it typically precedes win-rate decline by a quarter or more. It shows up in calendar data long before it shows up in bookings.

Unprompted referrals. Distinguish sharply between referrals a CSM asked for and referrals a customer volunteered. The asked-for number measures your CSM team's diligence. The volunteered number measures whether customers will attach their own reputation to yours — a far higher bar than satisfaction, and one of the few metrics that is nearly impossible to game internally.
Time-to-first-value in onboarding. Define one concrete milestone that means the customer got the thing they bought — first report generated, first workflow live, first team member trained. Measure days from contract signature to that milestone, and track the tail: the p90, not the median. The median tells you about your best-case onboarding; the p90 tells you which accounts are quietly forming the belief that they were oversold, and those accounts are your next churn cohort.
Support responsiveness distribution. First-response time averages hide the cases that destroy trust. A queue with a two-hour average and a 40-hour p95 is a queue that is producing detractors, because the p95 tickets are disproportionately the urgent ones. Watch the tail.
Renewal decision lead time. For accounts you keep, ask when the decision was effectively made. In most enterprise motions the answer is well before the renewal date. If your CS team can't answer this, you have no early warning system for churn.
A note on gaming: any trust proxy that becomes a comp target degrades into theater within two quarters. NPS survey timing gets manipulated, referral counts get padded with warm intros, and cycle length gets shortened by disqualifying hard deals. If you tie compensation to a trust proxy, tie a modest slice of it, define the metric before the quarter starts, and change the definition slowly — a metric people can predict is a metric people can plan around honestly.
Trade-offs and what the framing gets wrong

The quote is directionally right and frequently over-applied. Taken literally, "revenue is a lagging indicator of trust" implies that trust is the *only* input, and that's plainly false. Revenue also lags product-market fit, category timing, distribution advantage, pricing structure, macro budget cycles, and in some markets pure availability. A trusted vendor selling into a market with no budget still misses plan. Trust is necessary and not sufficient, and treating it as a single-variable theory produces its own failure: a team that gets very good at being liked and never gets good at being needed.
The sharpest trade-off is speed versus depth, and it's real rather than rhetorical. Trust-building is genuinely slower per unit of activity. A rep who runs consultative discovery, tells a prospect the product is a poor fit, and walks away has traded a closeable deal for a reputation. That trade is correct over a five-year horizon and expensive inside a runway-constrained one. A company with nine months of cash may rationally take transactional revenue it knows will churn, because the alternative is not existing long enough to collect on the trust. The honest framing is not "always choose trust" but "know which currency you're spending and what it costs to replace."
There is also a category of business where the lag is short enough that the framing barely applies. High-frequency transactional commerce builds and reveals trust inside a single session — reviews, return policy, checkout friction, delivery speed. The feedback loop is days, so the lag is small enough to manage directly. The framing has the most force where the loop is longest: enterprise software, professional services, healthcare, financial advisory, anything with a multi-stakeholder committee and a multi-year contract.

The alternatives worth weighing honestly: pure demand-gen investment buys volume faster than trust does and works when the product genuinely delivers, because volume then converts into trust automatically. Pricing restructuring — usage-based entry, shorter initial terms, success-gated ramps — can substitute for trust by lowering the buyer's downside rather than raising their confidence, which is often faster and sometimes more honest. Third-party proof (analyst coverage, verified review platforms, published security certifications) rents trust from institutions that already have it, at real cost and with a ceiling. Each of these is a legitimate lever. The mistake is treating "build trust" as the answer to every gap without first diagnosing which constraint is actually binding.
One more asymmetry: trust builds linearly and breaks discontinuously. Years of reliable delivery can be undone by one badly handled outage, one surprise price increase at renewal, or one contract clause that a customer discovers at the worst moment. The compounding runs both ways, but the downside runs faster, which means the protective work — incident communication, renewal transparency, contract plain-language — has a better return per hour than most of the building work.
Common pitfalls and how to avoid them
Treating trust as a marketing message rather than an operating constraint. The most common failure is publishing a values page about transparency while running a pricing model that requires a sales call to learn a number. Buyers read the gap instantly. If you claim transparency, publish a price or a range. If you can't publish a price, don't claim transparency — claim something you can back. Aligning the claim to the operation is cheaper than aligning the operation to the claim, and either is better than the mismatch.

Measuring satisfaction and calling it trust. Satisfaction asks whether the last interaction was fine. Trust asks whether the customer will bet on you again with incomplete information. A customer can be satisfied and still be running a competitive evaluation. The behavioral tells are more reliable than the survey ones: does the customer bring you problems early, accept a roadmap answer without a written commitment, introduce you to peers, and renew without a formal RFP? Those are trust behaviors. A 9 on a survey is a mood.
Compensating on the proxy instead of the behavior. Tying variable pay directly to NPS produces reps who coach customers on how to answer the survey. A better structure ties a modest slice of comp to outcomes that are hard to fake — retained revenue at 12 months, expansion without discount, deals closed at or near list — and leaves the soft proxies as diagnostics rather than targets.
Confusing the lag for an excuse. "Trust takes time" becomes cover for not measuring anything. The lag is real, but the leading indicators are observable within a quarter — cycle length, stakeholder count, at-list close rate, p90 time-to-value, unprompted referrals. If a trust initiative shows zero movement in any leading indicator after two quarters, it is not "still compounding." It is not working, and the honest move is to change it.
Letting one function spend what another has to repay. Marketing overstates, sales concedes, implementation absorbs, support explains. The bill always lands downstream of where the withdrawal happened, which is why the team that caused the damage rarely feels it. The structural fix is a shared metric that spans the handoffs — retained-and-expanded revenue at 12 months from close, visible to marketing, sales, and CS alike — so that the cost of an overstatement lands on the person who made it.

Reacting to a single quarter. Because the lag is one to three quarters, a single bad quarter is noise plus a delayed signal, and the reflex to fix it with in-quarter tactics almost always deepens the hole. Read the trailing four quarters of the *leading* indicators before changing anything about the revenue motion. If the leading indicators are healthy and revenue is soft, the constraint is probably not trust — it's budget, timing, or reach, and trust work won't fix it.
Assuming trust transfers across a change. Trust attaches to specific people, specific promises, and specific track records. It does not automatically survive an acquisition, a rebrand, a rep territory reshuffle, or a leadership change. Every one of those is a reset event where the account effectively re-underwrites you. Treating a reshuffle as an administrative change rather than a trust event is how companies lose accounts they thought were safe.
Related questions
Is revenue a lagging or leading indicator?
Revenue is a lagging indicator. It reports the result of decisions buyers made weeks to quarters earlier. Leading indicators sit upstream — pipeline coverage, cycle length, stakeholder count, time-to-first-value, and unprompted referrals all move before bookings do.
Who said "revenue is a lagging indicator of trust"?
The phrasing circulates widely in sales and leadership commentary without a single reliably documented origin. Attribution should be treated cautiously — the underlying idea, that trust precedes commercial outcomes, appears across trust-and-performance research rather than in one quotable source.
How do you measure trust in a B2B relationship?
Use behavioral proxies rather than surveys alone: does the customer surface problems early, renew without a formal RFP, accept roadmap answers without written guarantees, and volunteer referrals? Pair those with cycle length, at-list close rate, and p90 time-to-first-value.
How long is the lag between trust and revenue?

It scales with deal complexity. Transactional commerce can convert trust within a session; mid-market software typically runs a quarter or two; enterprise and professional services often run two to four quarters or longer. Baseline it against your own historical cycle data rather than a benchmark.
Can you rebuild trust after a bad implementation?
Yes, but it costs more than earning it did. The pattern that works is a specific, dated remediation commitment, an executive owner named to the customer, proactive status updates the customer didn't ask for, and no new commercial ask until the milestone lands.
FAQ
What does "revenue is a lagging indicator of trust" actually mean in practice?
It means the number on your dashboard is a report on credibility you built or spent months ago. The revenue you book this quarter was largely determined by how you handled demos, implementations, outages, and renewals in prior quarters. The practical consequence is that reacting to a revenue miss with in-quarter revenue tactics addresses a symptom whose cause is already in the past.
Doesn't this just excuse poor performance?
It shouldn't, and that's the main way the idea gets abused. The lag is a reason to measure leading indicators, not a reason to measure nothing. Cycle length, discount depth, at-list close rate, stakeholder count, and time-to-first-value all move within a quarter. If a trust investment produces no movement in any of them after two quarters, it isn't compounding quietly — it's failing, and it should be changed.

Is trust the only thing revenue lags?
No. Revenue also lags product-market fit, distribution reach, pricing structure, category timing, and macro budget conditions. Trust is necessary but not sufficient. Before treating a revenue gap as a trust problem, diagnose which constraint is actually binding — a trusted vendor in an unfunded market still misses plan, and trust work won't fix a distribution problem.
Should we tie compensation to trust metrics?
Cautiously, and modestly. Any soft proxy tied directly to pay degrades into theater within a couple of quarters — survey timing gets managed, referral counts get padded. Better structures tie a small slice of variable comp to outcomes that resist gaming: retained revenue at twelve months, expansion achieved without discount, deals closed at or near list price.
Does this framing apply to consumer businesses?
It applies, but the lag is much shorter. In high-frequency consumer commerce, trust is built and revealed within a single session through reviews, return policy, checkout friction, and delivery performance — the feedback loop runs in days. The framing carries the most weight where the buying loop is longest: enterprise software, professional services, healthcare, and financial advisory.
What's the fastest way to see whether trust is eroding?
Watch the friction metrics, because they move first. Rising stakeholder counts and meeting counts for the same deal size, discount requests arriving late in the cycle rather than early, a lengthening p90 on time-to-first-value, and a falling share of at-list closes all appear before win rate or churn does. Calendar and CRM data usually show it a quarter before the P&L does.
Sources
- Harvard Business Review — https://hbr.org/
- Edelman Trust Barometer — https://www.edelman.com/trust/trust-barometer
- McKinsey & Company Growth, Marketing & Sales — https://www.mckinsey.com/capabilities/growth-marketing-and-sales/our-insights
- MIT Sloan Management Review — https://sloanreview.mit.edu/
- Gartner Sales research and insights — https://www.gartner.com/en/sales
- Bain & Company on customer loyalty and Net Promoter — https://www.bain.com/insights/topics/customer-strategy-and-marketing/
- Pew Research Center on trust — https://www.pewresearch.org/topic/politics-policy/trust-facts-democracy/
- Forrester research — https://www.forrester.com/research/
Related on PULSE
This page will be disappearing soon. Save it to your device for $1 — or read it free while it is here.
@Kory-White- · if Venmo asks, the last 4 of my number are 2012
This page is gone.
This one is off the shelf now. $1 keeps it on your phone for good — the whole page, pictures and diagrams included.
 graphic“The next call is the most important one.” — Quote Card
 graphic“Data beats opinions.” — Quote Card
 graphic“Pressure off. Pipeline on.” — Quote Card
 graphic“A forecast is a promise, not a guess.” — Quote Card
 graphic“Sell the problem, not the product.” — Quote Card
 graphic“A confused buyer never buys.” — Quote Card
 graphic“Don't pitch. Diagnose.” — Quote Card
 graphic“Activity creates luck.” — Quote Card
 graphic“The fortune is in the follow-up.” — Quote Card
 graphic“Win the week. The quarter wins itself.” — Quote Card