
The Lead Lifecycle — Infographic
 Curated byKory White · Fractional CRO · Maryland
 PULSEKNOWLEDGE LIBRARY
Quality
Certified
This infographic is a 1080x1620 px portrait PNG titled "The Lead Lifecycle — Infographic" that maps every stage a Lead moves through — capture, qualification, nurture, handoff, opportunity, and closed outcome — with the signals, owners, and exit criteria at each step. Download it free from this page and use it to align marketing, SDR, and sales teams on one shared definition of pipeline progress.
The outcome you should expect
When a revenue team actually adopts a shared Lifecycle map, the first visible change is not more pipeline — it is less arguing about pipeline. Forecast calls get shorter because "qualified" stops meaning three different things to three different people. Marketing stops being blamed for leads sales never worked, because the handoff criteria are printed on the wall. The infographic exists to make that shared vocabulary portable: you can paste it into a Slack channel, drop it into a QBR deck, or print it for a new-hire onboarding packet.
Realistically, teams that align on a single Lead Lifecycle definition see three measurable shifts within one to two quarters. First, stage-conversion reporting becomes trustworthy, because every rep and every automation is writing to the same stage names. Second, the "leads we never touched" bucket shrinks — most commonly from a double-digit percentage of total inbound down to low single digits — once SLA timers and disqualification reasons are attached to each stage. Third, marketing and sales stop negotiating over lead volume and start negotiating over stage definitions, which is a far more productive argument.

The second-order outcome is subtler and more valuable: you gain the ability to say no. A defined Lifecycle tells you which leads are not worth pursuing yet, which sources produce volume without progression, and which stages are leaking. That is what turns a Lead gen motion from a volume game into a throughput game. The infographic is the artifact that makes the definition visible and therefore enforceable — a map nobody can quietly redefine in a side conversation.
What drives that outcome
Three forces drive whether a Lifecycle map produces alignment or just decoration. The first is shared definitions with observable exit criteria. "Marketing Qualified Lead" is useless if it means "downloaded a whitepaper" to one team and "matches ICP and has a named budget owner" to another. Every stage on the infographic should have a criterion a stranger could verify from the CRM record alone — a field value, an activity count, a date stamp.
The second force is ownership at each transition. Leads do not stall inside stages; they stall at the boundaries between them. Every arrow on the map needs a named role responsible for moving the Lead across it, plus a time bound. A handoff with no owner and no clock is where pipeline goes to die.

The third force is feedback loops back upstream. If sales disqualifies 40% of what marketing sends, that is not a sales problem — it is a targeting signal. A Lifecycle that only flows forward is a funnel; a Lifecycle that flows information backward is a system.
The loop at the bottom is the part most teams skip, and it is the part that compounds. Closed-lost reasons and disqualified reasons are the highest-signal inputs you will ever get for tightening the top of the Lifecycle. Without that return path, the map is a one-way street and the same bad-fit Leads keep arriving.
Benchmarks and realistic ranges
Benchmarks are dangerous when quoted as universal truths, because they vary enormously by ACV, motion, and market. What follows are the ranges practitioners most commonly observe, framed as sanity checks rather than targets. If your numbers sit far outside these bands, investigate before you celebrate or panic.
Lead-to-MQL conversion for inbound motions typically lands somewhere between 15% and 35% of captured Leads, depending on how aggressive your capture is. If you gate everything, expect the low end; if you capture freely and score, expect the high end but a larger disqualified bucket. MQL-to-SQL commonly runs 20% to 50% — a wide band because it depends entirely on how strict your MQL definition is. A tight, ICP-anchored MQL definition pushes this toward 50%; a loose content-download definition drags it toward 15%.
Speed-to-lead is the metric with the tightest consensus. Response within five minutes dramatically outperforms response within an hour, and response within an hour dramatically outperforms next-day. Most teams that measure this discover their median first-touch time is measured in hours, not minutes — and that the gap is a routing problem, not a rep-effort problem.
Stage dwell time is where the infographic earns its keep. Typical patterns: engaged-to-accepted under 24 hours if SLA timers exist; accepted-to-SQL in three to ten business days; SQL-to-opportunity in one to three weeks for mid-market, longer for enterprise. Any stage where the median dwell time is more than double the mean is a sign of a few stuck deals distorting the picture — a data-hygiene problem, not a pipeline problem.
Recycling rates are underused. Expect 10% to 25% of disqualified or unresponsive Leads to be worth re-engaging after 60 to 90 days. Teams that never recycle are leaving recoverable pipeline on the table; teams that recycle too fast burn sender reputation and rep patience.
For the graphic itself, the relevant "benchmark" is legibility: at 1080x1620 px, body text should not drop below roughly 24 px in the rendered image, and the stage labels should remain readable when the PNG is scaled to a phone screen or embedded in a slide at half width. If you customize it, test at thumbnail size before you ship it.
Risks, edge cases, and failure modes
The most common failure mode is stage inflation: teams add stages to describe every nuance of their process, and the map becomes a flowchart nobody reads. Six to eight stages is the practical ceiling for a Lead Lifecycle that people will actually internalize. If you need more granularity, keep the public map simple and encode the detail in CRM picklist values behind each stage.

The second failure is definition drift. You publish the map, everyone nods, and six months later two regional teams have quietly redefined "accepted." The antidote is to treat stage definitions as versioned artifacts with an owner and a change log — the same discipline you would apply to a pricing sheet.
The third is the automation trap. Teams wire lead scoring and routing to the Lifecycle stages, then change a stage definition without updating the automation, and Leads start skipping stages or landing in limbo. Every stage change should trigger a review of the workflows that read or write that stage.
Edge cases worth planning for explicitly:

- Multi-product Leads who fit two Lifecycles at once. Decide whether they run in parallel or whether one motion owns them, and say so on the map.
- Partner and channel-sourced Leads, which often bypass the top of the funnel entirely and enter at "accepted." Make sure your reporting does not silently drop them.
- Existing customers who re-enter as expansion Leads. They should not be scored like net-new prospects; a separate expansion path prevents embarrassing outreach.
- Long-cycle enterprise Leads that sit in nurture for a year or more. Without a defined "still alive" signal, these get purged and lost.
- Disqualification without a reason code, which destroys the feedback loop and makes the whole system unlearnable.
A final risk is cosmetic but real: if the infographic's colors and labels do not match your CRM's actual stage names, people will trust the graphic over the system, and reporting will diverge from reality. The graphic must mirror the CRM, not an idealized version of it.

A practical rollout plan
Rolling out a Lifecycle map is a change-management exercise, not a design exercise. The design is the easy part. What follows is a sequence that works for teams from roughly ten to several hundred sellers.
Weeks one and two — audit. Pull the last two quarters of Lead data and reconstruct what actually happened, not what the process says should happen. Count Leads at each transition, measure dwell times, and list every distinct disqualification reason currently in use. You will find duplicates and orphans.
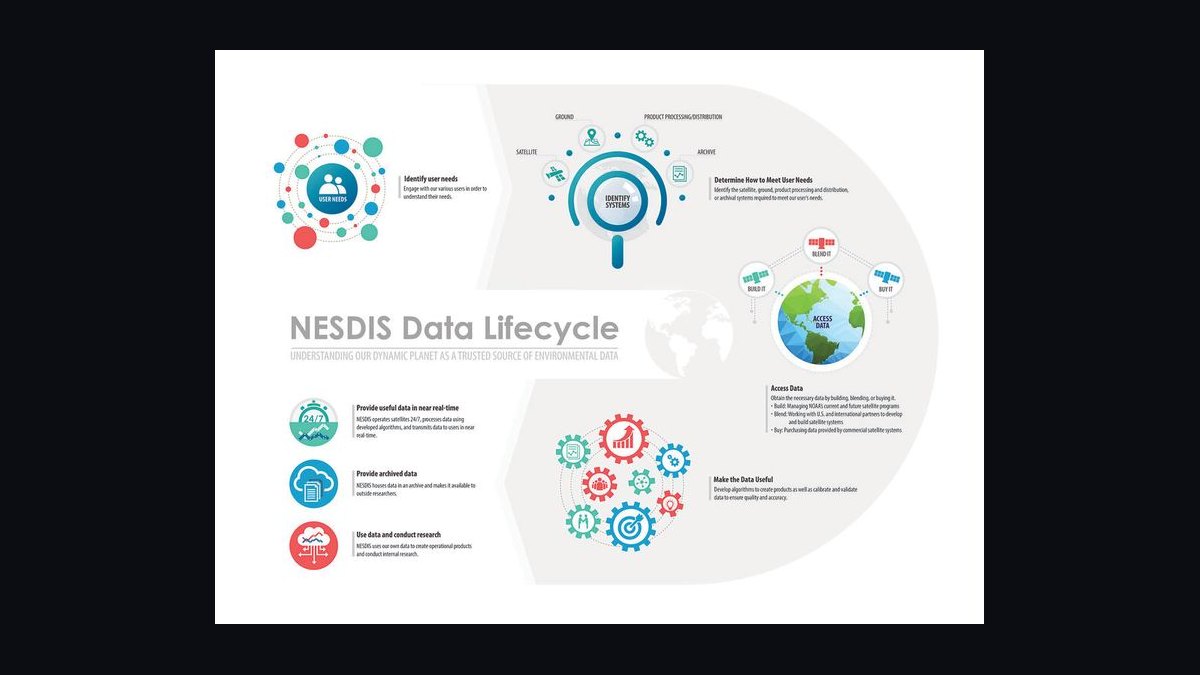
Weeks three and four — define. Draft the stage names and exit criteria with one representative from marketing, one from SDR, and one from sales. Keep it to six to eight stages. Write each criterion so it can be checked from a CRM field. Argue about the boundaries, not the labels.
Weeks five and six — instrument. Update CRM picklists, scoring thresholds, routing rules, and SLA timers to match. This is where most of the engineering effort lives. Do not skip the disqualification reason codes.
Weeks seven through ten — pilot. Run one team against the new definitions for thirty days. Compare their stage conversions to the historical baseline. Expect friction at the MQL-to-SQL boundary; that is the boundary that carries the most organizational tension.

Ongoing — review quarterly. Revisit the definitions every quarter, version them, and re-publish the infographic if anything changed. A Lifecycle map that is never revised is a map of a country that no longer exists.
Throughout, communicate in terms of what people gain: fewer wasted touches, cleaner forecasts, less rework. Nobody adopts a new process because it is theoretically better; they adopt it because it makes their week easier.
Related questions
What is the difference between a Lead Lifecycle and a sales funnel?
A funnel describes volume narrowing from top to bottom. A Lifecycle describes the states a Lead occupies and the criteria for moving between them, including backward movement like recycling and disqualification. The infographic shows states and transitions; a funnel chart shows only aggregate counts.
Who owns the Lead Lifecycle?
Marketing typically owns the top stages and the definitions, sales owns acceptance through close, and RevOps owns the system of record and the reporting. The critical rule is that one person owns the versioned definition, even if many teams execute against it.
How many stages should a Lead Lifecycle have?
Six to eight is the practical range. Fewer than five and you cannot diagnose where pipeline leaks; more than eight and people stop remembering the definitions, which defeats the purpose of publishing a shared map in the first place.
Can I customize this infographic for my team?
Yes. The PNG is a starting point. Swap the stage names to match your CRM, adjust the colors to your brand, and add or remove stages to reflect your actual motion. Keep the layout readable at thumbnail size and re-test legibility after any edit.
What is the most common mistake when building a Lead Lifecycle?
Defining stages by activity rather than by observable criteria. "Had a good call" is not a stage definition. "Discovery call completed and budget owner identified in the CRM" is. Activity-based stages cannot be reported on, automated, or audited.
FAQ
What exactly is on this infographic?
It is a portrait-format map of the Lead Lifecycle showing each stage from capture through closed outcome, the exit criteria that move a Lead forward, the role that owns each transition, and the feedback loop that returns disqualification and closed-lost reasons to the top of the funnel. It is designed to be read top to bottom in under a minute.
What size is the download and what format?
The graphic is 1080x1620 pixels, delivered as a PNG. That aspect ratio suits phone screens, printed handouts, and slide inserts. It is shown at the top of this page and can be downloaded free.
Where should I use it?
Three places work best: onboarding decks for new marketing and sales hires, QBR or forecast-review slides where stage definitions need to be visible, and internal wiki or Slack pins as the canonical reference. It also works as a printed one-pager at team offsites.
When does a Lead Lifecycle map backfire?
When the published definitions do not match what the CRM actually enforces. People notice within a week, trust the graphic less than the system, and revert to their own private definitions. Publish only what you have instrumented.
How do I customize the wording or colors?
Edit the stage labels to match your CRM picklist values exactly, then adjust the palette to your brand. If you add stages, keep the total at eight or fewer. After any edit, shrink the image to phone size and confirm the smallest text is still readable.
Does this apply to non-B2B motions?
The stage names change but the structure holds. E-commerce, marketplace, and PLG motions still have capture, qualification, activation, and outcome states. The value is the same: a shared, observable definition of progress that both a human and an automation can act on.
Sources
- HubSpot — Lifecycle stages and lead status: https://blog.hubspot.com/service/lead-lifecycle
- Salesforce — Lead management and conversion best practices: https://www.salesforce.com/resources/articles/lead-management/
- Marketo Engage documentation — Lead lifecycle and scoring: https://experienceleague.adobe.com/docs/marketo/using/home.html
- Gartner — B2B buying journey research: https://www.gartner.com/en/sales/insights/b2b-buying-journey
- Forrester — Revenue operations and pipeline research: https://www.forrester.com/research/
- Harvard Business Review — The short life of online sales leads: https://hbr.org/2011/03/the-short-life-of-online-sales-leads
- LinkedIn Marketing Solutions — Lead generation best practices: https://business.linkedin.com/marketing-solutions
Related on PULSE
- Lead Scoring Models: What to Weight and Why
- MQL vs SQL: Drawing the Line Your Teams Will Respect
- SLA Design for Speed-to-Lead
- Lead Recycling and Nurture Re-Engagement
- Revenue Operations Reporting: From Funnel to Lifecycle
- CRM Data Hygiene for Reliable Stage Reporting
This page will be disappearing soon. Save it to your device for $1 — or read it free while it is here.
@Kory-White- · if Venmo asks, the last 4 of my number are 2012
This page is gone.
This one is off the shelf now. $1 keeps it on your phone for good — the whole page, pictures and diagrams included.
 graphicThe Challenger Sale — Infographic
 graphicThe 30-60-90 Ramp — Infographic
 graphicThe Sales Funnel — Infographic
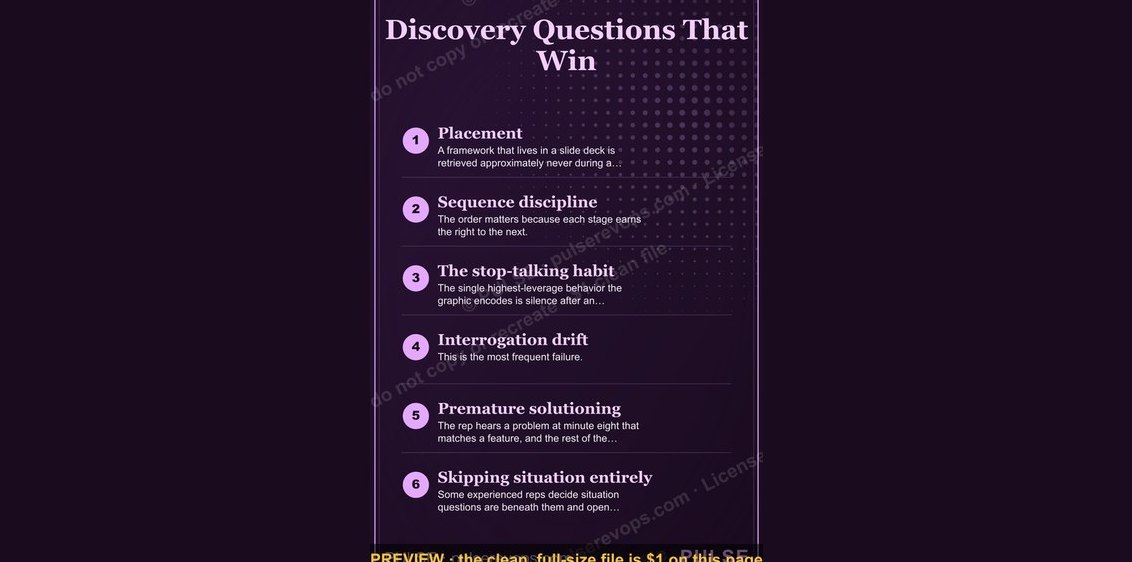 graphicDiscovery Questions That Win — Infographic
 graphic5 Stages of a Healthy Pipeline — Infographic
 graphicThe Perfect Demo — Infographic
 graphicPirate Metrics (AARRR) — Infographic
 graphic4 Forecast Categories — Infographic
 graphicThe Negotiation Checklist — Infographic
 graphicThe Sales Hiring Funnel — Infographic