
The Sales Funnel — Infographic
 Curated byKory White · Fractional CRO · Maryland
 PULSEKNOWLEDGE LIBRARY
A sales funnel infographic is a visual representation of the customer journey, typically broken into stages like awareness, interest, decision, and action. It shows how a broad audience gradually narrows down to paying customers, often using a funnel-shaped graphic. The exact number of stages and labels can vary by business model, but the core concept remains consistent across most industries.
The Sales Funnel — Infographic

A portrait infographic of the Sales Funnel — Leads, MQLs, SQLs, Proposals, and more — as clean labeled bands. Reuse it in decks or posts to explain how the flow works.
Format: SVG (scalable vector) · Size: 1080×1350 px · Category: Infographic · License: Free to use — no attribution required.
Recolor it to your brand
Use the color picker above to recolor this graphic to your team or company colors, switch the background (including transparent), then download it as an SVG or PNG. No sign-up, no watermark.
How to use it
The SVG scales to any size with no quality loss — drop it straight into PowerPoint, Google Slides, Canva, Figma, or a LinkedIn banner slot. The PNG export is ready to upload anywhere that wants a raster image.
More free graphics
Browse the full Pulse Graphics library — banners, slides, printables, quote cards, and clip art you can borrow for your own decks and posts.
Related on PULSE
- The Sales Hiring Funnel — Infographic
- The RevOps Funnel — Infographic
- The SaaS Growth Funnel — Infographic
- The Marketing Funnel — Infographic
- Sales Funnel — 7 Stages
- Sales Funnel — 5 Stages
Anatomy of a High-Performing Sales Funnel: Key Metrics at Each Stage
A sales funnel isn’t just a pretty diagram—it’s a living, breathing system that reveals exactly where your prospects drop off and where they convert. To truly master the funnel, you need to understand the metrics that matter at each stage. While exact numbers vary wildly by industry (a B2B SaaS company might see 2-5% lead-to-close rates, while a high-ticket coaching business could see 10-20%), the patterns are universal.
Top of Funnel (Awareness): Here, the critical metric is cost per lead (CPL) and impression-to-click rate. For most industries, a healthy click-through rate (CTR) from ads or organic content ranges from 1% to 5%. If your CPL is above $50 for a low-ticket item, you’re likely bleeding budget. Track traffic source quality—not all visitors are equal. A visitor from a targeted LinkedIn ad might be 10x more valuable than one from a generic display network. Also monitor bounce rate (ideally under 60% for landing pages) and time on page (anything under 15 seconds suggests your messaging isn’t resonating).
Middle of Funnel (Consideration): This is where the funnel gets leaky. The lead-to-MQL (Marketing Qualified Lead) conversion rate typically hovers between 10% and 30%. But the real gold is engagement depth: how many pages does a lead visit? Do they download a case study? Watch a demo video? A lead who engages with 3+ pieces of content is 5-10x more likely to convert. Track email open rates (industry average: 20-30%) and click-to-open rates (10-20%). If your open rates dip below 15%, your subject lines or sender reputation need work. Also watch demo request rate—if fewer than 5% of MQLs request a demo, your nurturing sequence is failing to build enough interest.
Bottom of Funnel (Decision): The MQL-to-SQL (Sales Qualified Lead) rate is where sales and marketing alignment lives. A healthy range is 20-50%, depending on your lead scoring model. The SQL-to-opportunity rate should be 40-60%—if it’s lower, your sales team is chasing unqualified leads. Finally, opportunity-to-close rate is the ultimate test. For B2B, 20-30% is strong; for B2C, 10-20% is more typical. Average deal size and sales cycle length are equally important—a 90-day cycle with a $5,000 deal might be unsustainable, while a 30-day cycle with $50,000 deals is a dream.
The Funnel Leakage Formula: To diagnose problems, calculate the percentage drop between each stage. If you lose 70% of leads between awareness and consideration, your content or targeting is off. If you lose 50% between consideration and decision, your pricing, trust signals, or sales process needs work. Use a simple spreadsheet with monthly data—after three months, patterns emerge. For example, a common pattern: high traffic but low conversion often means your offer doesn’t match your ad promise. Fix that mismatch, and you can double your conversion rate without spending a dime more on traffic.
Psychological Triggers That Supercharge Each Funnel Stage
The sales funnel isn’t just a logical progression—it’s a psychological journey. Understanding the mental state of your prospect at each stage allows you to deploy the right triggers to move them forward. Here’s how to apply behavioral science to your funnel without being manipulative.
Awareness Stage — The Curiosity Gap: At the top, prospects are overwhelmed with information. They’re scanning, not reading. The psychological trigger here is pattern interruption—something that breaks their autopilot. Use bold headlines that create a “curiosity gap” (e.g., “The One Metric That Predicts Sales Success—And 90% of Teams Ignore”). Also leverage social proof early: “Join 10,000+ marketers who already use this framework.” The brain’s negativity bias means warnings (“Don’t make this common mistake”) often outperform positive statements. Keep it simple—one clear benefit per headline. The Von Restorff effect (the brain remembers unique things) means a bold color, unusual image, or unexpected statistic can boost recall by 30-50%.
Consideration Stage — The Liking Principle & Authority: Now prospects are evaluating options. They’re looking for reasons to trust you. The liking principle (we say yes to people we like) means your brand voice should feel human, not corporate. Use real photos of your team, share founder stories, and show personality. Authority matters too—cite industry data, display certifications, and feature testimonials from recognizable names. The scarcity effect starts working here: “Only 5 spots left for our free consultation” can increase conversion by 20-40%, but only if genuine. Reciprocity is powerful—give away a valuable template, checklist, or mini-course for free. When someone receives value without obligation, they’re psychologically wired to give back (by booking a call or making a purchase). The Zeigarnik effect (we remember incomplete tasks better than completed ones) means a partially filled form or an unfinished video creates tension—use this by offering a “complete your profile” prompt that leads to a personalized recommendation.
Decision Stage — Loss Aversion & Commitment: At the bottom, fear of making the wrong choice is the biggest blocker. Loss aversion (we feel losses twice as strongly as gains) means framing your offer as avoiding a loss often works better than promising a gain: “Don’t lose 20% of your revenue to inefficient sales processes.” Commitment and consistency—if a prospect has taken small steps (downloaded a guide, attended a webinar), they’re more likely to say yes to a larger commitment. Remind them of their past actions: “You’ve already learned the strategy—now implement it with our done-for-you service.” Anchoring works well in pricing: show a higher-priced option first, then your actual offer seems like a bargain. Social proof at scale—not just testimonials, but “87% of customers who tried this saw results in 30 days” creates a bandwagon effect. Finally, reduce cognitive load—the more decisions a prospect has to make (which plan? which add-on?), the more likely they are to freeze. Limit choices to 2-3 options, and clearly recommend one as “most popular” or “best value.”
Post-Purchase — The Endowment Effect: The funnel doesn’t end at purchase. The endowment effect (we value things more once we own them) means onboarding should make customers feel smart for buying. Immediately deliver a “welcome kit” with unexpected value—a bonus resource, a personal video from the CEO, or access to a private community. This increases retention and referral rates by 30-50%. Cognitive dissonance (buyer’s remorse) peaks in the first 48 hours—send a reassuring email with case studies of successful customers who made the same choice. The goal: turn a one-time buyer into a repeat customer and advocate, which is 5-25x cheaper than acquiring a new one.
Common Sales Funnel Mistakes That Kill Conversion (And How to Fix Them)
Even experienced marketers make these errors. Here are the most damaging mistakes, with honest fixes that don’t require a complete overhaul.
Mistake #1: Treating All Leads the Same. Many funnels blast the same emails to everyone, regardless of how they entered. A person who downloaded a “Beginner’s Guide” has different needs than someone who requested a demo. Fix: Implement lead scoring based on behavior—assign points for actions (e.g., visited pricing page = 10 points, downloaded case study = 5 points). Then segment: hot leads (50+ points) get a sales call; warm leads (20-49) get educational content; cold leads (under 20) get re-engagement sequences. This alone can lift conversion rates by 15-30%. If you don’t have a CRM, start with a simple spreadsheet and three buckets.
Mistake #2: Ignoring Mobile Optimization. Over 60% of email opens happen on mobile, yet many landing pages and emails look terrible on phones. Tiny fonts, unclickable buttons, and slow load times kill conversions. Fix: Test every page on a real phone. Keep forms to 3-5 fields max on mobile. Use a single-column layout with buttons at least 44×44 pixels. Page load time should be under 3 seconds—every second delay drops conversion by 7%. Use Google’s Mobile-Friendly Test tool for a quick check.
Mistake #3: Overcomplicating the Offer. “We have three pricing tiers, a free trial, a money-back guarantee, plus a bonus if you buy today…” This creates analysis paralysis. Fix: Use the “one offer, one call to action” rule. For each funnel stage, ask yourself: “What is the single most important action I want them to take?” Then remove everything else. For example, on a landing page for a free consultation, don’t also promote your blog, social media, and a product demo. One button, one goal. You can always upsell later.
Mistake #4: Neglecting the Thank-You Page. Most people dump a “Thanks for subscribing” page with no next step. This is a massive missed opportunity. Fix: The thank-you page should be a mini-funnel itself. Immediately deliver the promised value (download link, access code), then offer a logical next step: “Want to see how this works in practice? Book a 15-minute strategy call.” Or: “While you wait, here’s a case study of a client who got 3x results.” This can add 10-20% more conversions from the same traffic.
Mistake #5: No Exit-Intent Strategy. 70-90% of visitors leave without converting. Most fun
Sources
- HubSpot — inbound marketing and sales funnel stages
- Salesforce — CRM and sales process frameworks
- Neil Patel — digital marketing funnel strategies
- MarketingProfs — B2B sales funnel content and infographics
- Harvard Business Review — academic and business perspectives on sales processes
- Statista — market data and funnel conversion benchmarks
FAQ
What exactly is a sales funnel? A sales funnel is a visual model that maps the customer journey from initial awareness to final purchase. It typically narrows from a broad top (leads) to a focused bottom (conversions), helping businesses understand where prospects drop off and where to optimize.
How many stages should a sales funnel have? Most funnels use 3 to 5 stages, such as Awareness, Interest, Decision, and Action. The exact number depends on your industry and sales cycle — B2B funnels often have more stages than B2C.
What’s the difference between a sales funnel and a marketing funnel? A marketing funnel focuses on attracting and nurturing leads, while a sales funnel emphasizes closing deals. In practice, they overlap heavily — marketing feeds the top, sales works the bottom.
How do I measure funnel performance? Key metrics include conversion rates between stages, cost per lead, and average deal size. Track drop-off rates to identify where prospects lose interest, then test changes to improve flow.
Can a sales funnel work for a small business? Yes, even a simple 3-stage funnel (Awareness → Consideration → Purchase) can help small businesses focus efforts. Start by mapping your current customer path, then refine based on what you observe.
What’s a common mistake when building a sales funnel? Overcomplicating it with too many stages or ignoring post-purchase follow-up. A funnel should guide, not confuse — keep it clear, test often, and remember that retention is part of the cycle.
This page will be disappearing soon. Save it to your device for $1 — or read it free while it is here.
@Kory-White- · if Venmo asks, the last 4 of my number are 2012
This page is gone.
This one is off the shelf now. $1 keeps it on your phone for good — the whole page, pictures and diagrams included.
 graphic5 Dysfunctions of a Team — Infographic
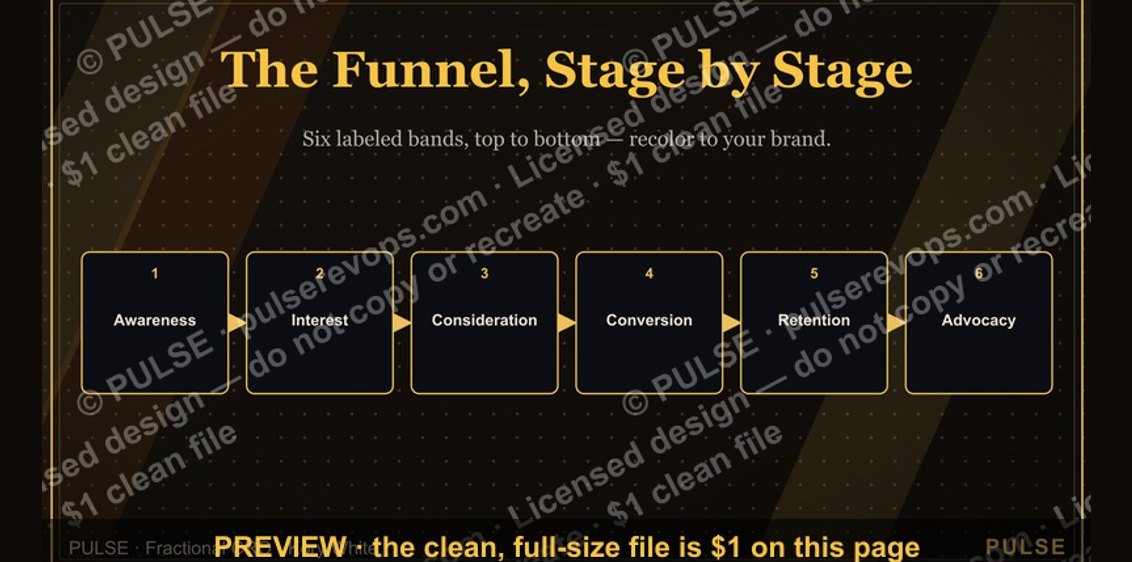 graphicThe Marketing Funnel — Infographic
 graphicBANT Qualification — Infographic
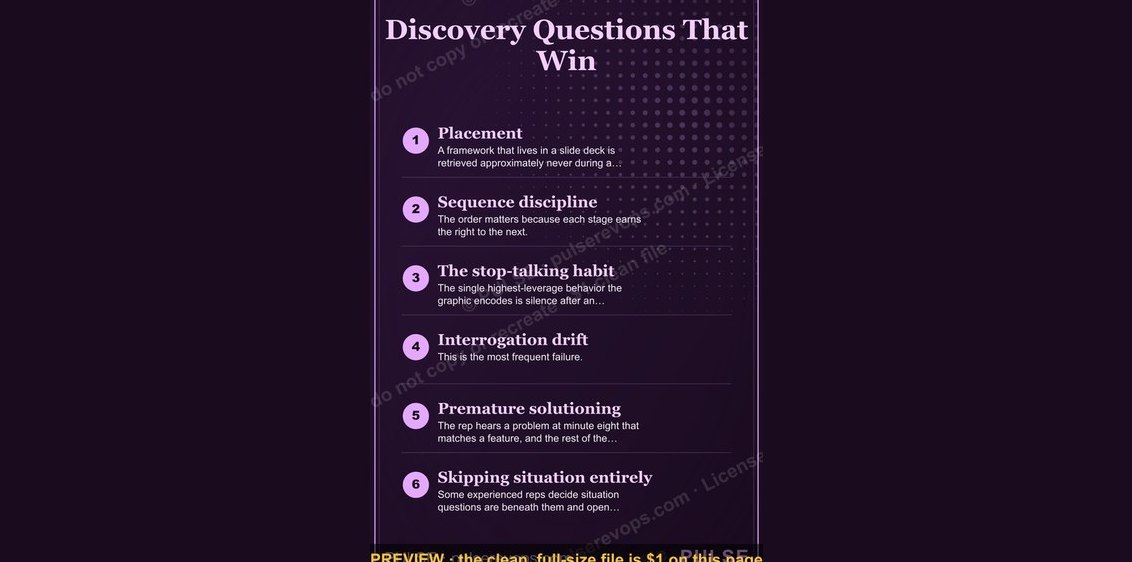 graphicDiscovery Questions That Win — Infographic
 graphicThe 30-60-90 Ramp — Infographic
 graphicThe Renewal Playbook — Infographic
 graphicSPIN Selling — Infographic
 graphicThe Perfect Demo — Infographic
 graphic5 Steps to Handle Any Objection — Infographic
 graphicThe Value Selling Ladder — Infographic