
Discovery Questions That Win — Infographic
 Curated byKory White · Fractional CRO · Maryland
 PULSEKNOWLEDGE LIBRARY
Quality
Certified
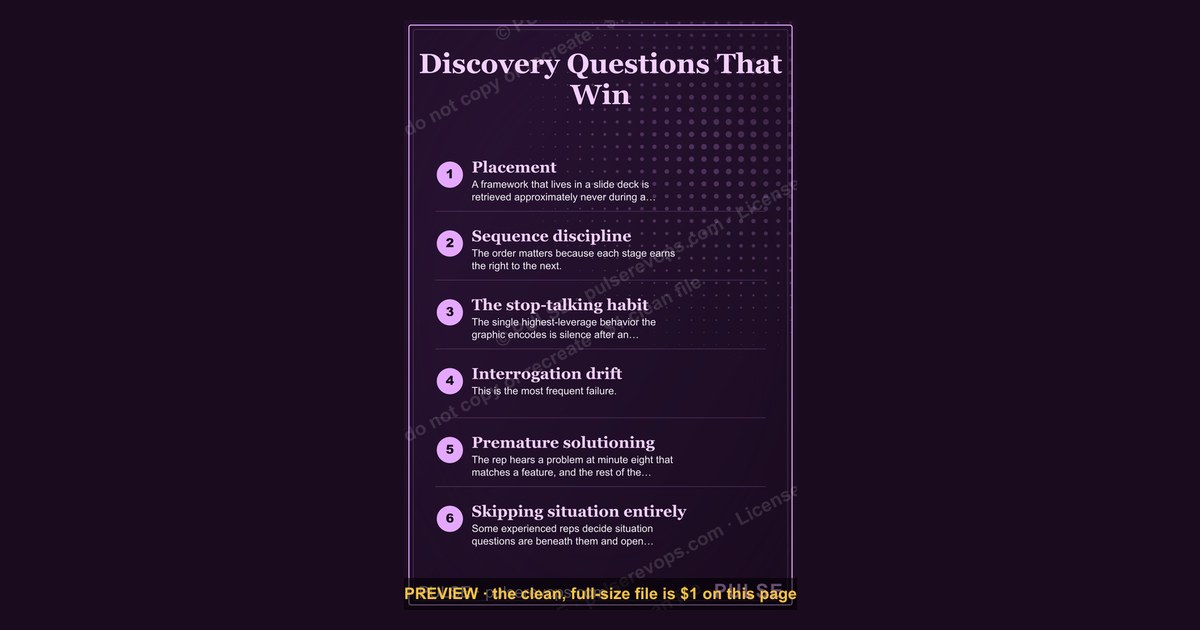
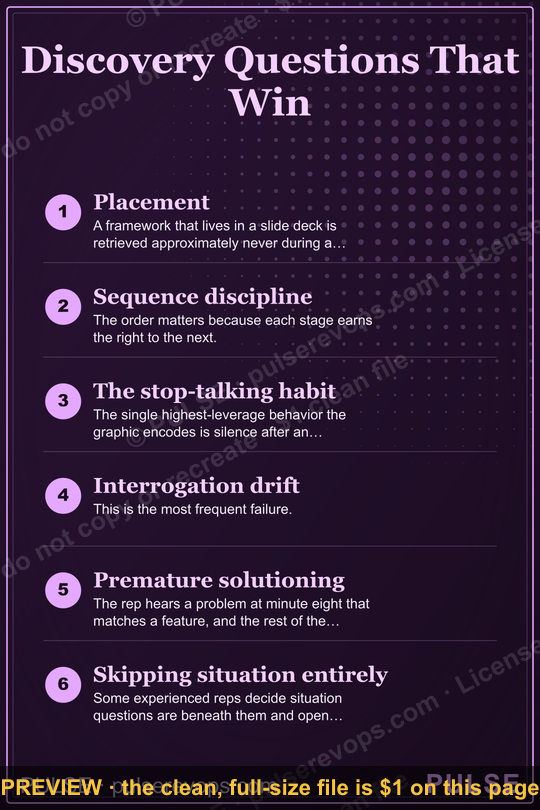
This is a downloadable infographic, 1080x1620 px, titled "Discovery Questions That Win." It maps a sequenced set of open-ended Questions reps ask across a first call — situation, pain, impact, and next step — and shows where most reps rush. Download the PNG free on this page and keep it beside your monitor.
The outcome you should expect
The outcome this infographic is built to produce is narrower and more measurable than "better conversations." It should change the specific sentences a rep says between minute three and minute twenty of a first call. If a rep tapes this graphic next to a second monitor and their questioning cadence is identical two weeks later, the asset has failed no matter how clean the layout is.
So what does success actually look like? Three observable shifts. First, the ratio of open to closed Questions moves. Most untrained reps open a discovery call with a burst of closed, confirmatory questions — "You're on Salesforce, right?" "You handle inbound?" — because those are safe and they feel like progress. A rep working from a sequenced graphic typically lands somewhere between 60 and 75 percent open-ended in the first fifteen minutes, then narrows deliberately once they have a hypothesis to test. Second, talk time drops. The common benchmark reps get coached toward is 70/30 in the buyer's favor during discovery, though in practice anything under 55 percent buyer talk on a first call usually means the rep is still presenting. Third, and most important, the rep leaves the call able to name the cost of the problem in the buyer's own units — seats, tickets, hours, dollars, days — rather than restating the problem in vendor language.
There is a fourth outcome that shows up later and matters more than any of the first three: a higher proportion of second calls that the buyer shows up to prepared. Discovery that lands produces a buyer who has already started internally socializing the problem. Discovery that interrogates produces a buyer who agrees to a follow-up to be polite and then goes quiet.

The graphic is deliberately sequenced rather than a flat list because sequencing is where reps break down. Almost every rep knows the categories — situation, problem, impact, implication, next step. Very few can hold the order under pressure when a buyer gives a short answer and the silence gets uncomfortable. A visual sequence gives the rep a place to look and a next move that isn't "talk more."
What drives that outcome
The mechanism is straightforward: a rep under cognitive load reverts to the highest-practice behavior they can retrieve without thinking. Under pressure, retrieval beats intention. That is why a graphic placed in the physical field of view outperforms a training deck reviewed once in onboarding — it converts a remembered framework into a retrieved one at the exact moment of need.
Three drivers determine whether that flow executes.

Placement. A framework that lives in a slide deck is retrieved approximately never during a live call. A framework on a second monitor, a printed card, or a sticky note on the laptop bezel gets glanced at during the awkward pause after a short answer — which is precisely the moment reps default to filler. Placement is not a design nicety; it is the entire delivery mechanism for a graphic like this.
Sequence discipline. The order matters because each stage earns the right to the next. Asking "what does that cost you annually?" before the buyer has agreed the problem exists reads as an ambush. Asking about budget before impact reads as premature qualification. The graphic's value is that it makes the dependency visible: you cannot skip to implication without a stated problem, and you cannot get a stated problem without enough situation context to ask a specific question.

The stop-talking habit. The single highest-leverage behavior the graphic encodes is silence after an open question. Reps who count to three before speaking report dramatically different answer quality, because most buyers use the first two seconds to give the rehearsed answer and the next three to give the real one. This is not a design feature of the infographic, but it is the behavior the infographic's pacing is meant to cue.
Benchmarks and realistic ranges
Practitioners ask for numbers constantly, and the honest answer is that discovery metrics vary enormously by segment, deal size, and whether the motion is inbound or outbound. What follows are ranges that show up repeatedly in sales-enablement and revenue-operations practice — treat them as sanity checks, not targets to force.
| Metric | Typical weak range | Typical strong range |
|---|---|---|
| Buyer talk time, first call | 30–45% | 60–70% |
| Open-ended question share | 20–40% | 60–75% |
| Distinct problems surfaced | 0–1 | 2–3 |
| Quantified cost statements from buyer | 0 | 1–2 |
| First call duration | 18–25 min | 35–50 min |
| Second-call show rate | 40–55% | 70–85% |

A few things worth noting about that table. First-call duration is the counterintuitive one. Reps often assume shorter calls are more efficient and respectful of the buyer's time. In practice, calls that end under about twenty minutes on a mid-market or enterprise deal usually mean the rep ran out of questions, not that the buyer ran out of time. Longer discovery calls correlate with better second-call attendance because the buyer has invested attention and now has a reason to continue.
The "distinct problems surfaced" row is where most teams see the largest gap between their belief and their data. Ask a rep how many problems they uncovered and they will say three. Listen to the recording and you will usually hear one problem, restated in three different ways by the rep, with the buyer agreeing each time. Real additional problems come from asking what else the problem touches — adjacent teams, downstream reporting, customer-facing consequences — not from rephrasing.
Quantified cost is the other big gap. Buyers rarely volunteer a number. The reliable path is to ask what unit the buyer already tracks — tickets per week, onboarding days, invoice exceptions per month — and then ask what that unit costs to resolve. Reps who ask for an annual figure directly usually get a deflection. Reps who ask for a per-unit figure and then do the multiplication out loud in the call get a real number roughly half the time, and a correction roughly a third of the time, which is nearly as useful.

Risks, edge cases, and failure modes
A discovery framework used badly is worse than no framework, because it makes the rep look like they are reading from a script. Five failure modes are common enough to name.
Interrogation drift. This is the most frequent failure. The rep works through the sequence mechanically, the buyer answers each question in one sentence, and the call becomes a questionnaire. The tell is that the rep never reacts to an answer — never says "that's interesting, tell me more about that" — and moves straight to the next prepared question. The fix is a rule: after any answer longer than two sentences, ask one follow-up about that answer before returning to the sequence.
Premature solutioning. The rep hears a problem at minute eight that matches a feature, and the rest of the call becomes a demo. Discovery ends. Everything after that is the buyer politely waiting to leave. The graphic's ordering helps here only if the rep actually holds the line — implication before presentation.

Skipping situation entirely. Some experienced reps decide situation questions are beneath them and open with impact. This works with a buyer who has already done internal analysis and can speak to cost. It fails badly with a buyer who is still forming the problem, and those buyers are the majority in early-stage deals. Situation questions are not filler; they are how you learn which impact question is even coherent.
The multi-threaded blind spot. Discovery conducted entirely with one champion produces a plan built on one person's view. When the economic buyer joins a later call and asks a question the champion cannot answer, the deal stalls while the rep re-discovers. Asking "who else feels this, and how do they describe it?" during the first call is a two-minute investment that prevents a two-week stall.
Recording without review. Teams that record calls but never sample them are running the framework blind. A weekly sample of three to five discovery recordings per rep, scored against the sequence, is what turns the infographic from decoration into a coaching instrument. Without review, reps converge on whatever feels comfortable, which is usually not the sequence.

Edge cases worth flagging: highly technical buyers will often answer situation questions with more detail than you need and you should let them, because that detail tells you where their mental model lives. Procurement-led first calls are not discovery calls at all and should not be run from this sequence. And in a competitive displacement deal, the situation questions change — you are mapping the incumbent's footprint, not the buyer's org chart.
A practical rollout plan
Handing out a graphic produces a spike in usage for about nine days. A rollout that sticks looks different and takes about a quarter.
Week one: distribution with a reason. Send the PNG with a short note explaining that you will be reviewing discovery calls against it. A graphic delivered without a follow-up signal is filed and forgotten.

Week two: baseline scoring. Pull three discovery recordings per rep, chosen at random rather than by the rep. Score each against four things: buyer talk percentage, open-question share, number of distinct problems, and whether a number was attached to any problem. Do not share individual scores yet — you are establishing a baseline, and reps who feel graded in week two will optimize for the metric instead of the behavior.
Week three: one call, reviewed together. Pick a single strong call and walk the whole team through it, pausing at each stage to ask what the rep was doing and why. Group review of one call teaches faster than individual feedback on five, because reps hear their peers' reasoning.
Weeks four through six: paired practice. Reps run the sequence on each other, alternating buyer and rep, focusing specifically on the pause after an open question. This is uncomfortable and it works. The pause is a physical habit, and physical habits need reps, not slides.
Weeks seven through ten: manager shadowing. Managers join two live calls per rep and stay silent. The post-call conversation is about sequence, not outcome — a rep who ran the sequence well on a call that ended without a next step still did the job correctly and should hear that.
Weeks eleven through thirteen: re-score. Compare against the week-two baseline. Expect movement in open-question share and buyer talk time before you see movement in pipeline metrics; conversation-quality metrics move in weeks, revenue metrics move in quarters.

Steady state. Sample monthly. Refresh the graphic's wording annually, or whenever the team's most common failure mode changes — a team that has fixed interrogation drift and developed premature solutioning needs a different graphic.
Customization is worth doing and takes about an hour in any vector tool. Swap the accent color to your brand. Replace the example questions with ones drawn from your own recorded calls, because reps trust examples they recognize. If your team sells to a specific vertical, change the situation questions to that vertical's vocabulary — "how many sites" instead of "how many seats." Keep the sequence intact regardless of what else you change; the order is the asset.
Specs and download: the file is a 1080x1620 px PNG, portrait orientation, sized for a second monitor, a printed card, or a phone lock screen. It is free to download from this page, no email required. It is not sized for LinkedIn feed posts — 1080x1620 is taller than the feed's comfortable crop, so if you want to share it socially, share it as a document post or crop to a square. To swap it in for your team, download the PNG, open it in your design tool of choice, and replace the text layers; the layout is built to survive a 20 percent increase in question length before it crowds.
Related questions
What makes a discovery question "win"?
One that produces an answer the rep could not have predicted, and that the buyer has to think about before responding. Predictable answers signal a closed question or a leading one. The test is simple: if you already know what they will say, you asked it for your own comfort, not for information.
How many questions should a rep ask on a first call?
Enough to cover situation, at least two distinct problems, impact on each, and a next step — typically twelve to twenty substantive questions over 35 to 50 minutes, with follow-ups on the answers that matter. Question count is a weak metric; follow-up depth is a stronger one.
Does this work for inbound deals where the buyer arrives educated?
Partly. Inbound buyers often arrive with the problem already framed, so situation questions compress and impact questions expand. The sequence still holds, but the rep spends more time testing the buyer's framing and less time establishing context. Skipping impact entirely on inbound is a common and costly shortcut.
Can a rep use this in a renewal or expansion conversation?
Yes, with the sequence shifted. Situation becomes "what has changed since we last spoke," problem becomes friction with the current setup, and impact becomes the cost of not expanding. The discipline of quantifying in the buyer's units transfers directly, and expansion discovery that skips quantification tends to produce flat renewals.
How often should the graphic be updated?
Review it annually at minimum, and any time your most common discovery failure mode changes. Teams that fix one problem tend to develop another. A graphic targeting last year's weakness quietly stops being useful and nobody notices because it is still on the wall.
FAQ
Why an infographic instead of a one-page doc?
Because the failure mode is retrieval under pressure, not comprehension. Reps understand discovery frameworks after one read. What they lack is a glanceable cue at the moment a buyer gives a short answer. A visual sequence placed in the field of view does that job; a document in a shared drive does not.
Is 1080x1620 the right size for printing?
It prints acceptably at roughly 4x6 inches at 270 ppi, which is a standard index-card-plus size. For a full-page desk reference, scale the vector source rather than the PNG, or you will see softness in the small type. For a monitor, 1080x1620 fits a portrait second screen without scrolling.
What if my team already uses MEDDIC or SPICED?
Keep your framework and use this graphic as the call-flow layer. Frameworks tell you what to qualify; this tells you what order to ask in and where to stop talking. They are complementary, and the most common mistake is treating a qualification framework as a call script.
How do I measure whether it is working?
Track four things monthly: buyer talk percentage, open-question share, distinct problems surfaced, and whether a number was attached to a problem. Conversation metrics move in four to eight weeks. Pipeline metrics lag by a quarter or more, so do not judge the asset on closed-won in month one.
Can I share this with my whole company?
Yes, download and distribute freely inside your organization. If you want to publish it externally, credit the source and link back. Do not present it as your own proprietary methodology without adapting the wording, because the example questions are deliberately generic.
What is the single biggest mistake reps make with it?
Treating it as a checklist to complete rather than a sequence to hold. The graphic works when a rep uses it to decide what to do next after an answer, and fails when a rep uses it to decide what to say next regardless of the answer. Same asset, opposite results.
Sources
- Gong — Sales Discovery Call Research
- HubSpot — Sales Discovery Questions
- Salesforce — Sales Resources and Guides
- Harvard Business Review — The Art of Asking Questions
- Challenger Inc. — Research on Sales Conversations
- RAIN Group — Sales Research and Benchmarks
- Sandler — Sales Training Resources
- Sales Gravy — Sales Training Articles
Related on PULSE
- Discovery call frameworks compared: MEDDIC, SPICED, and plain sequence
- How to score discovery recordings without demoralizing the team
- Turning a quantified problem into a business case the buyer can forward
- Multi-threading a deal from the first call
- The pause after the question: why silence is a skill
- Building a rep-facing asset library that actually gets used
This page will be disappearing soon. Save it to your device for $1 — or read it free while it is here.
@Kory-White- · if Venmo asks, the last 4 of my number are 2012
This page is gone.
This one is off the shelf now. $1 keeps it on your phone for good — the whole page, pictures and diagrams included.
 graphic5 Dysfunctions of a Team — Infographic
 graphicThe Weekly Rep Cadence — Infographic
 graphicThe Value Selling Ladder — Infographic
 graphicThe Customer Journey — Infographic
 graphicThe 3 Pipeline Levers — Infographic
 graphicThe Challenger Sale — Infographic
 graphic4 Pillars of RevOps — Infographic
 graphicThe Renewal Playbook — Infographic
 graphic5 Stages of the Buyer’s Journey — Infographic
 graphicPirate Metrics (AARRR) — Infographic