
5 Dysfunctions of a Team — Infographic
 Curated byKory White · Fractional CRO · Maryland
 PULSEKNOWLEDGE LIBRARY
The 5 Dysfunctions of a Team, as outlined by Patrick Lencioni, are Absence of Trust, Fear of Conflict, Lack of Commitment, Avoidance of Accountability, and Inattention to Results. This infographic visually maps these dysfunctions as a pyramid, showing how each layer builds on the one below it. It serves as a quick reference for teams to identify and address common breakdowns in collaboration and performance.
5 Dysfunctions of a Team — Infographic

A numbered portrait infographic — 5 Dysfunctions of a Team — covering Absence of Trust, Fear of Conflict, Lack of Commitment, Avoiding Accountability, and more. Drop it into onboarding decks or a sales-process explainer for reps and buyers.
Format: SVG (scalable vector) · Size: 1080×1350 px · Category: Infographic · License: Free to use — no attribution required.
Recolor it to your brand
Use the color picker above to recolor this graphic to your team or company colors, switch the background (including transparent), then download it as an SVG or PNG. No sign-up, no watermark.
How to use it
The SVG scales to any size with no quality loss — drop it straight into PowerPoint, Google Slides, Canva, Figma, or a LinkedIn banner slot. The PNG export is ready to upload anywhere that wants a raster image.
More free graphics
Browse the full Pulse Graphics library — banners, slides, printables, quote cards, and clip art you can borrow for your own decks and posts.
Related on PULSE
- RevOps Team Structure
- AI Safety Red Team Lead — LinkedIn Banner
- Pipeline Council — Team Banner
- “ONE TEAM ONE NUMBER” — Sales Floor Print
- "Revenue is a team sport." — LinkedIn Banner
- One team. One number. — LinkedIn Wallpaper
Practical Application: Using the Infographic as a Diagnostic Tool
An infographic of the 5 dysfunctions is most powerful when used not as a passive reference, but as an active diagnostic instrument. The pyramid structure—Absence of Trust, Fear of Conflict, Lack of Commitment, Avoidance of Accountability, Inattention to Results—is deliberately ordered: each dysfunction builds on the one below it. This means you can use the visual hierarchy to pinpoint where your team’s breakdown actually begins.
Step 1: Conduct a team self-assessment with the infographic visible. Gather your team around the infographic (project it or print a large copy). Ask each member to place a colored dot (green, yellow, red) next to each level based on how they perceive the team’s health at that layer. Green means “we’re strong here,” yellow means “we have occasional issues,” red means “this is a persistent problem.” This exercise alone surfaces hidden disagreements—often, leaders assume trust is fine while team members see vulnerability as risky.
Step 2: Focus on the lowest red or yellow level. If your team has red at “Absence of Trust,” do not attempt to fix “Avoidance of Accountability” first. The pyramid is a foundation: you cannot build accountability on a base of fear and guardedness. Instead, design a trust-building intervention. For example, a “personal histories” exercise where each team member shares three facts about their background (one professional challenge, one personal interest, one unexpected skill) can soften defenses in a single 45-minute session. If the lowest dysfunction is “Fear of Conflict,” introduce structured debate formats like “disagree and commit” or “red team/blue team” role-playing before meetings.
Step 3: Revisit the infographic monthly. Dysfunctions are not static—they shift with team composition, deadlines, and external pressures. Schedule a 15-minute monthly check-in where the team re-rates the pyramid. Track changes over time. A team that moves from red to yellow on “Lack of Commitment” in three months has made real progress; one that stays red on “Inattention to Results” may need clearer metrics or a reset of shared goals.
Real-world example: A mid-stage SaaS company used this method after a failed product launch. The infographic revealed that the leadership team had yellow on “Fear of Conflict” and red on “Lack of Commitment.” They discovered that decisions were being made in private conversations (avoiding open debate), so team members never truly bought in. By introducing a weekly “decision log” where every major choice was debated openly and recorded with a clear owner, they moved to green on commitment within two quarters. The infographic served as their north star, not just a poster.
Common pitfalls to avoid:
- Don’t use the infographic to blame individuals—it’s about team dynamics, not personal flaws.
- Avoid skipping levels. Teams often want to jump to accountability because it feels actionable, but without trust and healthy conflict, accountability becomes punitive.
- Don’t treat the infographic as a one-and-done exercise. Print it, laminate it, put it in your meeting room, and refer to it when tension rises.
Adapting the Framework for Remote and Hybrid Teams
The original 5 dysfunctions model was developed in an era of co-located teams, where trust was built over coffee machines and conflict happened in hallways. Remote and hybrid work changes the dynamics of each dysfunction, and your infographic needs a companion strategy to remain relevant.
Absence of Trust in a remote setting: Without casual, non-work interactions, vulnerability feels riskier. Team members may hesitate to admit mistakes or ask for help because they lack the informal safety net of in-person rapport. Solution: Schedule 10-minute “virtual water cooler” slots at the start of every meeting—no agenda, just personal check-ins. Use prompts like “What’s one thing you’re struggling with this week?” or “What’s a win you had that nobody saw?” This builds the trust needed to move up the pyramid.
Fear of Conflict across time zones: Remote teams often avoid conflict because it’s harder to read tone in chat or email. Disagreements get buried in Slack threads or postponed indefinitely. Solution: Institute a “conflict protocol” where any disagreement that lasts more than two back-and-forth messages must move to a voice or video call. Also, use asynchronous tools like Loom for recorded video feedback—this allows team members to express disagreement thoughtfully without the pressure of a live reaction. The infographic can be used as a visual cue: when you sense conflict avoidance, point to the pyramid and say, “We’re stuck at this level right now—let’s have the debate.”
Lack of Commitment in hybrid decision-making: When some team members are in the office and others are remote, decisions can feel lopsided. The in-office group may make choices that the remote group learns about later, eroding buy-in. Solution: Use a “decision transparency” board (digital or physical) that lists every major decision, who made it, when, and who was consulted. The infographic’s “Lack of Commitment” level becomes a trigger: if you see disengagement in meetings or delayed execution, check the board to see if remote voices were included.
Avoidance of Accountability with distributed teams: It’s easier to let low performance slide when you don’t see the person daily. Accountability becomes a once-a-quarter performance review rather than a weekly peer conversation. Solution: Create a shared “team commitments” dashboard that mirrors the infographic’s accountability level. Each team member lists 2-3 commitments per week, and the team reviews them together in a 15-minute Friday standup. The infographic serves as a reminder that accountability is not about punishment—it’s about mutual respect for the team’s results.
Inattention to Results when goals are invisible: Remote teams can lose sight of shared outcomes when they’re focused on individual tasks. The pyramid’s top level collapses. Solution: Make results visible to everyone—use a live dashboard that shows progress toward the team’s top 3 goals. Every meeting starts with a 2-minute review of this dashboard. The infographic should be placed next to the dashboard (virtual or physical) so the connection between trust, conflict, commitment, accountability, and results is always in view.
Hybrid-specific adaptation: If your team is partially in-office, use the infographic as a physical artifact in the office and a digital version in your project management tool. During all-hands meetings, run a quick “pyramid pulse” where everyone (remote and in-person) votes anonymously on each level using a tool like Mentimeter. This prevents the loudest voices (often in the room) from dominating the assessment.
Common Misinterpretations and How to Avoid Them
The 5 dysfunctions infographic is deceptively simple, and its popularity has led to several widespread misinterpretations that can undermine its effectiveness. Understanding these traps will help you use the framework with precision.
Misinterpretation #1: “The pyramid means you must fix one level completely before moving up.” In reality, the dysfunctions are interconnected, and progress is iterative. You don’t need perfect trust before you can have healthy conflict—you need enough trust to start having difficult conversations. Think of it as a spiral: you’ll revisit each level multiple times. For example, a team that builds trust through a retreat may still struggle with conflict during a high-pressure quarter. That doesn’t mean trust is broken; it means you need to reinforce it. The infographic is a guide for prioritization, not a strict sequential checklist.
Misinterpretation #2: “The dysfunctions are about individual personality flaws.” This is the most damaging misuse. The framework is about team dynamics, not labeling people as “low trust” or “conflict avoidant.” When a team has an absence of trust, it’s a collective pattern—often caused by past experiences, organizational culture, or lack of psychological safety. Avoid saying “John has a trust issue.” Instead, say “Our team has a pattern of avoiding vulnerability, which shows up when we don’t admit mistakes.” The infographic should be used as a mirror for the team, not a weapon against individuals.
Misinterpretation #3: “Fear of conflict means we should have more arguments.” Healthy conflict is not about being combative or creating drama. It’s about passionate, unfiltered debate around ideas, not people. Teams that misinterpret this often create a culture of aggression where people feel attacked. The goal is “productive conflict”—where team members can disagree openly without damaging relationships. Use the infographic to ask: “Are our disagreements about the work, or about personalities? Are we avoiding conflict because we’re afraid of hurting feelings, or because we don’t trust each other to handle it?”
Misinterpretation #4: “Lack of commitment means people aren’t working hard enough.” Commitment in this framework is about clarity and buy-in, not effort. A team can work 60-hour weeks and still lack commitment if they don’t agree on the direction. The infographic’s “Lack of Commitment” level is often a symptom of the level below it: if the team hasn’t had healthy conflict about decisions, they won’t truly commit. Look for signs like revisiting decisions repeatedly, low attendance at meetings, or passive resistance. The fix is not more hours; it’s clearer decision-making processes and ensuring every voice is heard before a decision is locked.
Misinterpretation #5: “Avoidance of accountability means we need more rules and oversight.” This leads to micromanagement and bureaucracy. The framework’s accountability is about peer-to-peer pressure, not top-down control. When team members hold each other accountable, it’s because they care about the team’s results and trust each other enough to give honest feedback. If you’re adding more reporting structures, you’re likely masking a deeper issue at the trust or commitment level. The infographic should prompt you to ask: “Why aren’t team members comfortable calling out low performance? Is it because they don’t trust each other, or because they don’t agree on what good performance looks like?”
How to avoid these misinterpretations in practice: When introducing the infographic to your team, spend 30 minutes discussing these common traps. Use examples from your own experience. Emphasize that the framework is a tool for the team to use together, not a diagnostic that a manager does
Sources
- Patrick Lencioni’s official website — overview of the 5 Dysfunctions model and its applications
- Harvard Business Review — articles on team dynamics, leadership, and organizational behavior
- The Table Group (Lencioni’s consulting firm) — resources, assessments, and case studies on the model
- Forbes — business leadership and team effectiveness coverage
- American Management Association — training materials and research on team dysfunction and cohesion
- Society for Human Resource Management (SHRM) — workplace culture, team performance, and conflict resolution insights
FAQ
What are the 5 dysfunctions of a team? The model, from Patrick Lencioni’s book, outlines five interrelated issues: absence of trust, fear of conflict, lack of commitment, avoidance of accountability, and inattention to results. They form a pyramid, with trust as the foundation.
How does the pyramid work? Each dysfunction builds on the one below it. Without trust, teams avoid healthy conflict; without conflict, they won’t commit; without commitment, they avoid accountability; and without accountability, results suffer. Addressing the lower levels is essential.
Can a team have only one dysfunction? Typically, dysfunctions cascade. If a team lacks trust, they’ll likely also struggle with conflict and commitment. However, some teams may have a stronger area—like good trust but poor accountability—so the pyramid’s order helps pinpoint root causes.
Is this model only for executive teams? No, it applies to any team—startups, departments, or project groups. The principles are universal, though the severity and dynamics may vary. Small teams might see faster resolution, while larger ones may need more structured interventions.
How long does it take to fix these dysfunctions? It varies widely, from weeks to months, depending on team size, culture, and commitment. Building trust alone can take several months of consistent effort. There’s no fixed timeline, but progress often accelerates once the team acknowledges the issues.
Does the infographic include solutions? The infographic typically visualizes the pyramid and each dysfunction’s description, but it may not detail solutions. For actionable steps, refer to Lencioni’s book or team-building exercises that target each level, like vulnerability-based trust exercises or setting clear goals.
This page will be disappearing soon. Save it to your device for $1 — or read it free while it is here.
@Kory-White- · if Venmo asks, the last 4 of my number are 2012
This page is gone.
This one is off the shelf now. $1 keeps it on your phone for good — the whole page, pictures and diagrams included.
 graphicThe Perfect Demo — Infographic
 graphicThe SaaS Growth Funnel — Infographic
 graphicThe Renewal Playbook — Infographic
 graphicThe 30-60-90 Ramp — Infographic
 graphicBANT Qualification — Infographic
 graphicThe Negotiation Checklist — Infographic
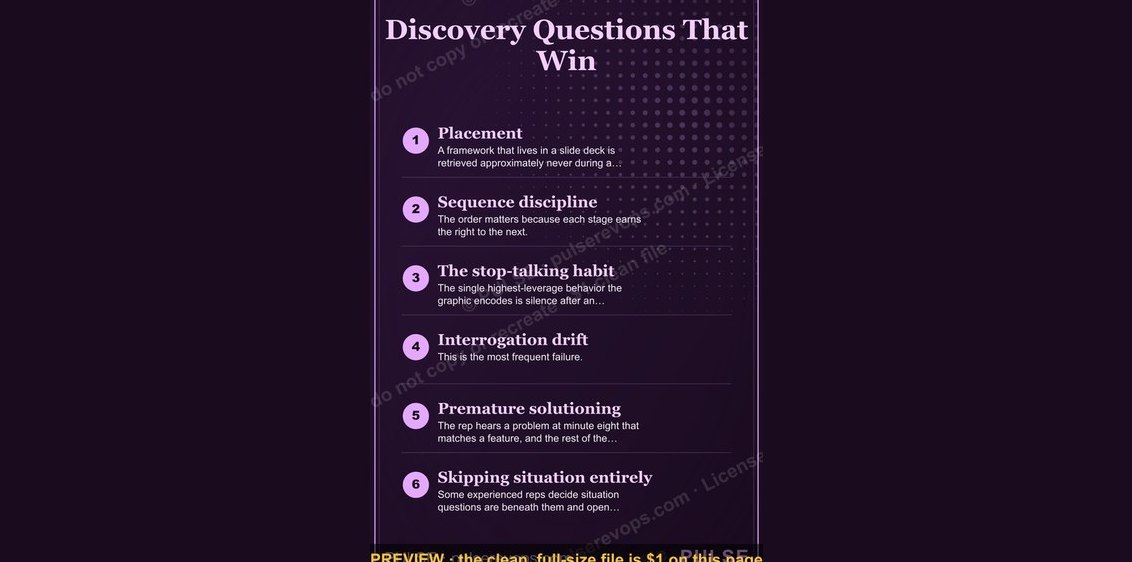 graphicDiscovery Questions That Win — Infographic
 graphicThe Demand Waterfall — Infographic
 graphic6 Sales Email Rules — Infographic
 graphicThe Customer Journey — Infographic