
SDR-to-AE Funnel
 Curated byKory White · Fractional CRO · Maryland
 PULSEKNOWLEDGE LIBRARY
Quality
Certified
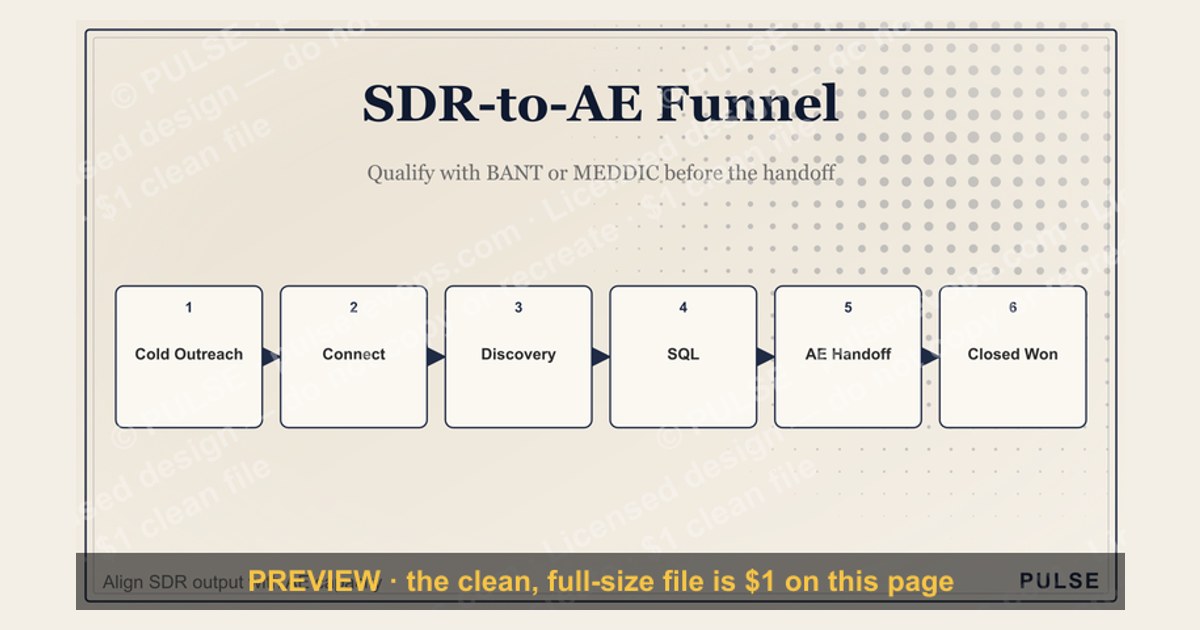
This process flowchart maps the SDR-to-AE Funnel as a stage-by-stage handoff diagram, showing how a prospect moves from first outbound touch through qualification, meeting booking, discovery, and closed-won revenue. It labels each stage with its owner, exit criteria, and the conversion metric that gates progression, so RevOps teams can see exactly where pipeline leaks and which handoff needs fixing first.
A concrete scenario that frames the problem
Picture a B2B SaaS company with eight SDRs and six AEs. Last quarter the SDR team booked 640 meetings, but only 512 actually happened — a 20% no-show and reschedule rate that nobody owned because the SDR had already been credited. Of those 512 held meetings, AEs accepted 358 as qualified opportunities, rejecting 154 as "not a fit" or "no budget." That is a 70% SDR-to-AE acceptance rate, which sounds tolerable until you trace the downstream damage: those 154 rejected meetings consumed roughly 230 AE hours that could have gone to real pipeline.
Now follow the accepted 358 opportunities forward. Discovery calls converted to a technical demo for 214 of them (60%), demos converted to proposal for 128 (36% of accepted opps), and proposals closed at 31% — landing 40 closed-won deals for the quarter. The SDR team's raw number, 640 meetings, looks like a strong quarter. The SDR-to-AE Funnel tells a different story: 640 meetings became 40 deals, a 6.25% end-to-end conversion. The leak is not evenly distributed. The biggest single drop is between booked and held, and the second biggest is between held and accepted. Both sit at the SDR-AE boundary, which is exactly the seam this flowchart is designed to expose.
The RevOps lead pulls the numbers by SDR and by AE. One SDR books 95 meetings with a 68% hold rate; another books 110 with a 74% hold rate but only a 52% acceptance rate because they book against a persona the AEs do not sell to. One AE accepts 88% of meetings and closes 22%; another accepts 61% and closes 41%. Neither is wrong — the first is running a volume motion, the second a precision motion — but the funnel does not distinguish them, so the raw meeting count rewards the wrong behavior. This is the scenario the graphic resolves: it forces each stage to carry its own owner and its own conversion rate, so the conversation shifts from "how many meetings did you book" to "where in the Funnel did this deal actually stall."

How the mechanism actually works
The SDR-to-AE Funnel is not a single metric; it is a chain of stage conversions where each link has a different owner, a different definition of "done," and a different failure mode. The mechanism works only when every stage has an explicit exit criterion that both sides have agreed to in writing. Without that, the handoff becomes a negotiation, and negotiations at scale produce inconsistent data.
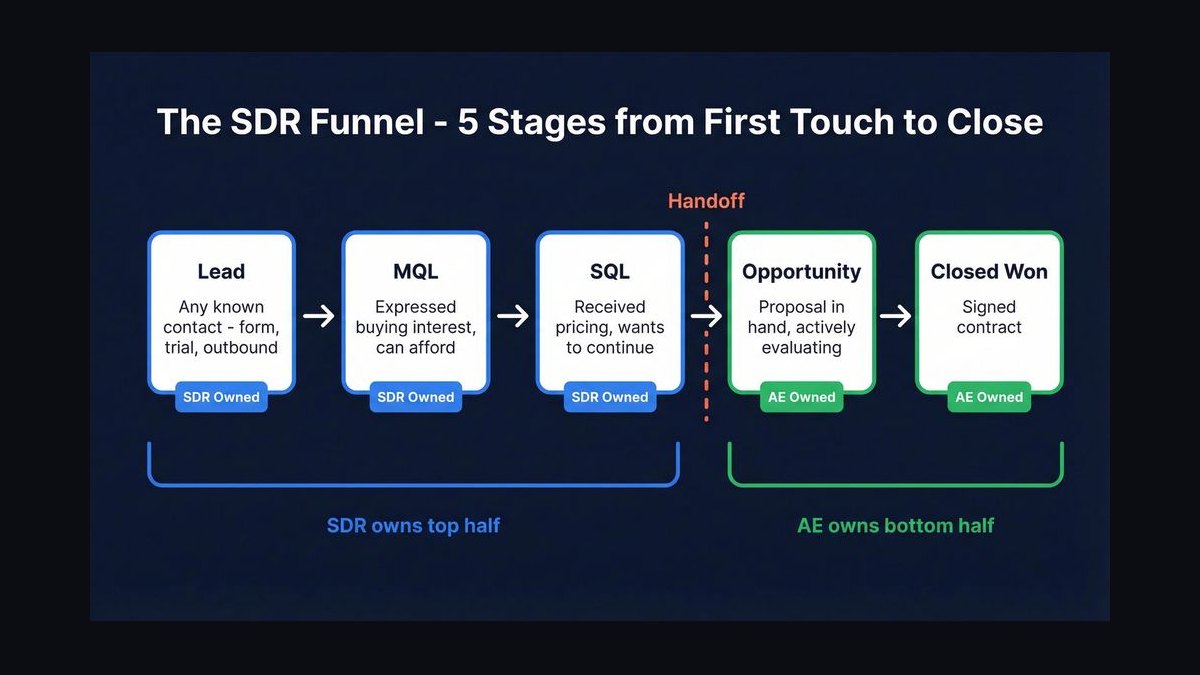
Here is how the stages typically chain together in a mid-market SaaS motion:
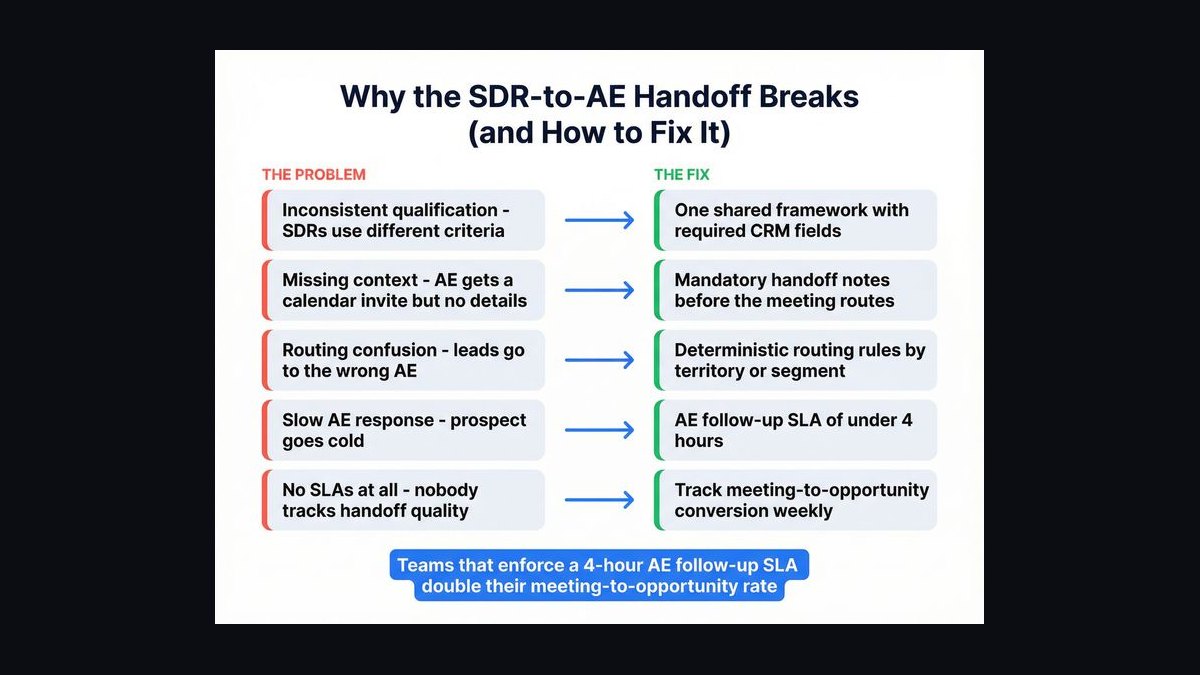
The critical design choice is where you place the "opportunity created" line. Two schools exist. The first creates the opportunity at the moment the meeting is booked, which inflates pipeline but gives AEs full visibility into their calendar early. The second creates it only after the AE accepts the meeting as qualified, which produces cleaner pipeline but delays forecasting. Most RevOps teams land in the middle: the SDR logs a "meeting booked" activity, and the AE converts it to an opportunity within 24 hours of the held meeting using a written acceptance checklist. That 24-hour rule matters because acceptance rates decay sharply when AEs batch their CRM updates at end of week — by then the meeting details are fuzzy and the AE defaults to accepting rather than investigating.
Each stage also needs a reason code taxonomy. When an AE rejects a meeting, the reason should be one of a fixed list: wrong persona, no budget, no authority, competitor already selected, timing, or duplicate. Free-text rejection reasons are useless for trend analysis because no two AEs phrase them the same way. With a fixed list, you can run a monthly report showing that 40% of rejections are "wrong persona" and trace that back to the SDR's targeting list or the lead-scoring threshold that fed it.
The handoff itself has a rhythm. The best-performing teams run a 15-minute daily or twice-weekly standup where SDRs read out the meetings they booked for the next 48 hours, the AE confirms they have reviewed the account notes, and any meeting without a confirmed agenda gets flagged for the SDR to send a pre-call email. That pre-call email — a short note restating the pain the prospect mentioned and the two or three questions the AE will ask — is the single highest-leverage artifact in the whole Funnel. It raises hold rates because the prospect sees structure, and it raises acceptance rates because the AE walks in already knowing the context.
Real numbers, ranges, and benchmarks
Benchmarks vary enormously by segment, geography, and deal size, so treat any single number as a starting hypothesis rather than a target. That said, the following ranges show up repeatedly in mid-market B2B SaaS motions with average contract values between $10,000 and $50,000.
Booked-to-held conversion typically runs 65% to 80%. Below 65% usually means the SDR is booking meetings the prospect never genuinely agreed to — often the result of a "book a meeting" quota that rewards calendar holds over real interest. Above 80% is achievable but usually requires a confirmation call or email within 24 hours of booking plus a reminder 24 hours before.
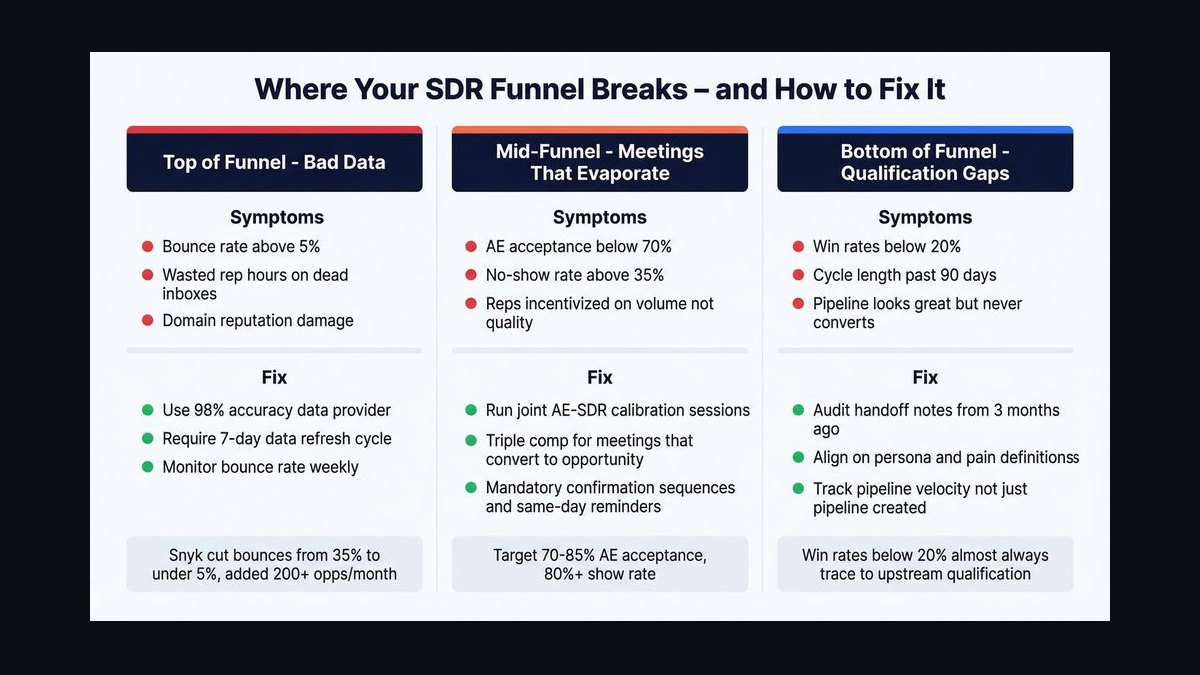
Held-to-accepted conversion for mid-market runs 55% to 75%. The wide band reflects how strictly you define "accepted." Teams that require budget, authority, need, and timeline confirmation before accepting land near 55-60%; teams that accept on "good conversation" land near 75% but pay for it later with longer sales cycles and more stalled deals.
Accepted-to-demo conversion runs 50% to 70%. This is where discovery quality shows. If the AE cannot articulate the prospect's pain in the prospect's own words after the discovery call, the demo will be generic and the conversion will sit near 50%.
Demo-to-proposal runs 35% to 55%. Proposals that require a business case or security review before pricing push toward the low end because more deals die in those gates.
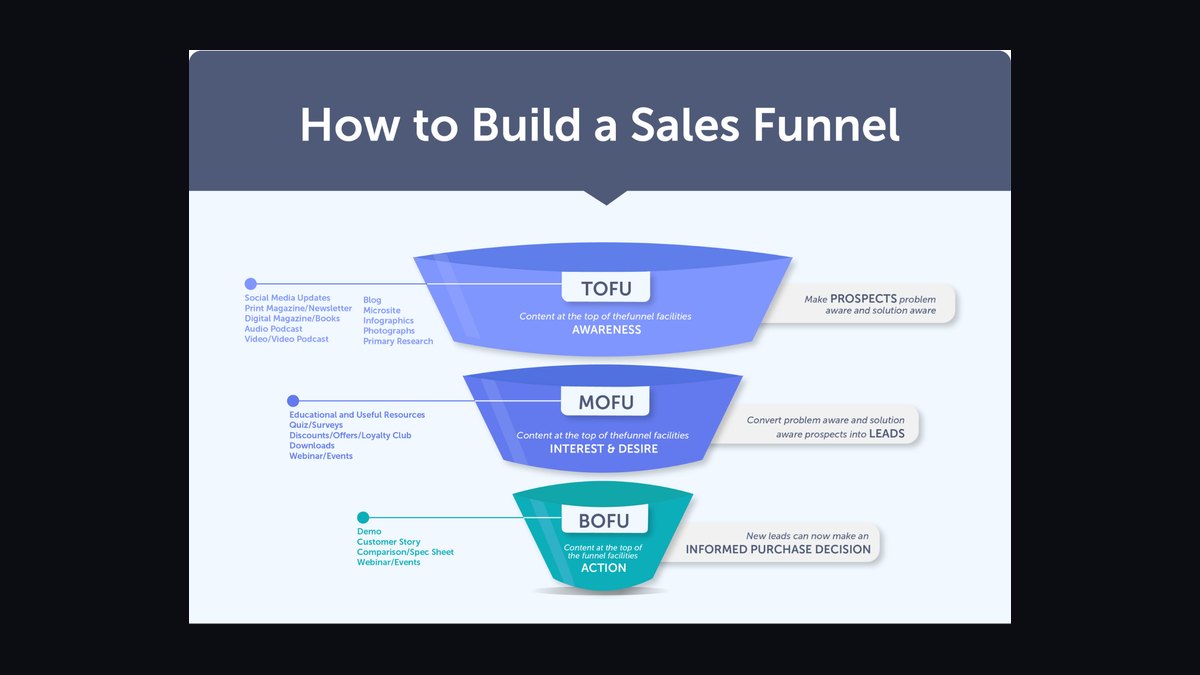
Proposal-to-closed-won runs 25% to 40% for mid-market. Enterprise deals with procurement and legal review run lower, often 15% to 25%, because the number of approvers multiplies the chances of a stall.
Multiply the midpoints and you get an end-to-end SDR-to-AE Funnel conversion of roughly 2% to 5% from booked meeting to closed-won. That is the number to sanity-check against your own data. If your funnel converts at 8%, either your deal size is small enough that buyers decide fast, or one of your stage definitions is looser than the benchmark assumes. If it converts at 0.8%, find the stage that is half the benchmark and fix that one before touching anything else.
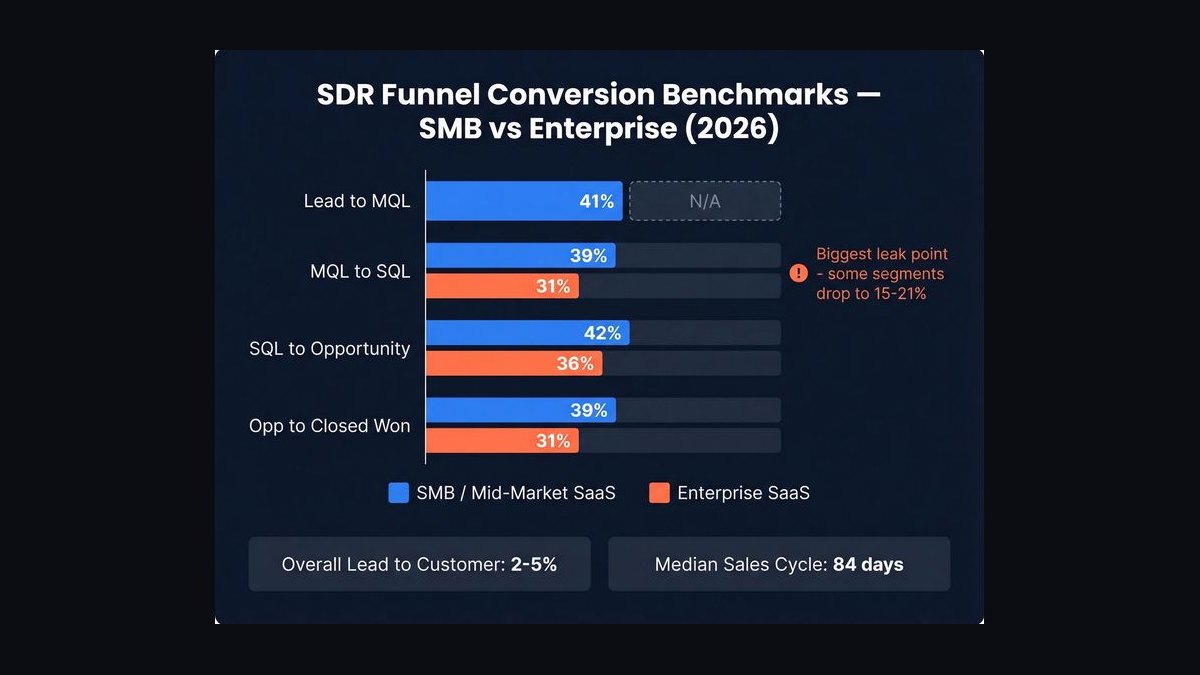
Two more numbers matter for capacity planning. First, the ratio of SDRs to AEs. Common configurations run 1:1, 2:1, and 3:1. A 1:1 ratio suits high-touch enterprise motions where each AE needs deep account research. A 3:1 ratio suits high-volume transactional motions where the SDR function is closer to a call center. Second, meetings per SDR per month. Eight to twelve held meetings per month is a sustainable mid-market pace for a full-cycle SDR doing their own prospecting; fifteen to twenty is achievable only with heavy marketing-sourced inbound or a dedicated lead list team feeding them.
Trade-offs and alternatives
The SDR-to-AE Funnel as a specialized two-role model is not the only way to structure go-to-market. Each alternative trades pipeline cleanliness against cost, speed, and rep development.
The specialized model wins when average contract value is high enough to justify two salaries per unit of revenue, when the sales motion requires significant discovery before a demo makes sense, and when the pool of people who can both prospect cold and run a complex deal is small. It loses when the product is simple enough that a single rep can prospect and close in one motion, because the handoff adds a seam without adding enough leverage.
The full-cycle model — one AE who prospects, qualifies, demos, and closes — eliminates the handoff entirely. The trade-off is time allocation. A full-cycle AE typically spends 40% to 60% of their week on prospecting and qualification, which caps their closing capacity. It works well for deal sizes under roughly $15,000 where the sales cycle is short and the buyer is a single decision-maker. It breaks down above that because the prospecting load crowds out the deep discovery and multi-threading that larger deals require.
The three-role model adds customer success as a distinct post-sale owner. This is less an alternative to the SDR-to-AE Funnel and more an extension of it, but it changes the funnel's economics because the AE's incentive shifts. If the AE is measured on closed-won only, they will over-promise to close; if they carry a retention or expansion component, they will qualify harder and the SDR-to-AE acceptance rate will drop. Neither is universally right — it depends on whether your growth model depends more on new logos or net revenue retention.
Product-led self-serve is the fourth path. When the product can demonstrate value without a human, the funnel collapses into a signup-to-paid conversion with sales-assist only for larger accounts. This is the cheapest funnel at scale but only works when time-to-value is short and the buyer can evaluate without a guided demo. For complex products, forcing a self-serve motion produces signups that never activate and a sales team that spends its time rescuing stalled trials.
The honest trade-off summary: specialization buys AE focus at the cost of handoff friction and headcount. Full-cycle buys simplicity at the cost of closing capacity. PLG buys scale at the cost of deal complexity. Most companies run a hybrid — inbound and small deals self-serve or full-cycle, outbound and enterprise deals through the specialized Funnel — and the RevOps job is to make sure the routing rule between them is explicit and enforced in the CRM rather than left to rep judgment.
Common pitfalls and how to avoid them
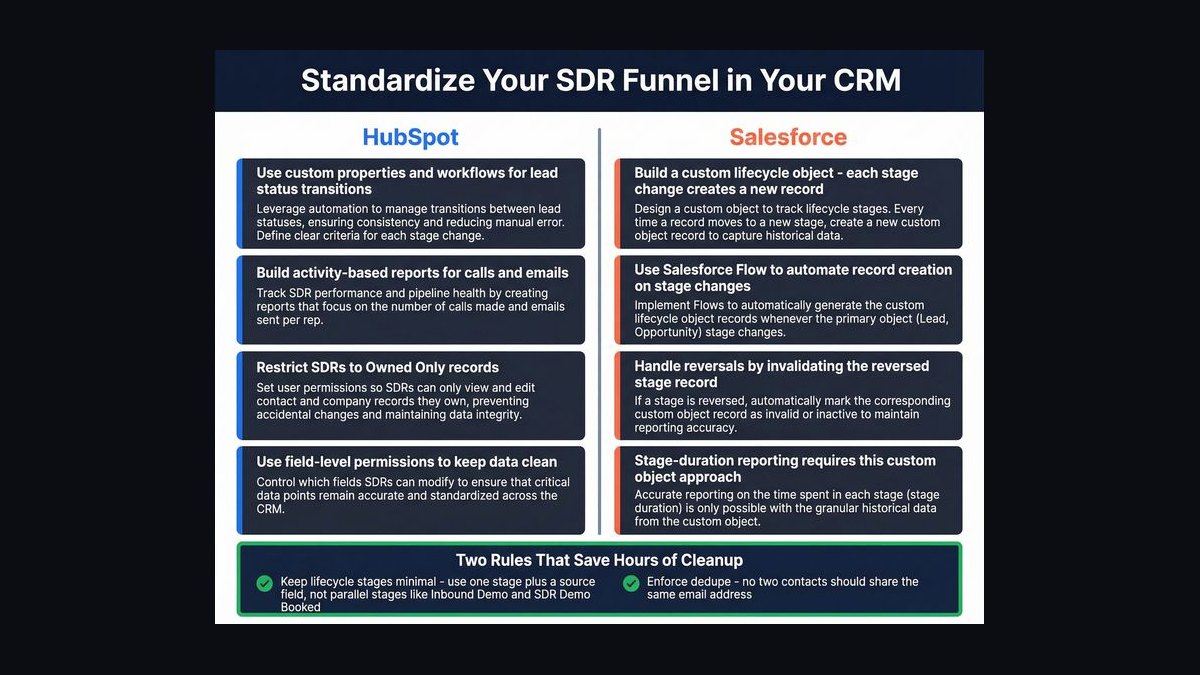
The first pitfall is measuring the SDR on meetings booked rather than meetings held and accepted. This single choice drives more bad behavior than any other. When the quota is booked meetings, SDRs optimize for calendar holds, which means booking against weak-fit prospects, agreeing to meetings the prospect is lukewarm about, and scheduling far enough out that the prospect forgets. The fix is a two-part quota: a held-meeting number and an accepted-opportunity number, weighted so that a booked-but-rejected meeting earns partial or zero credit. Expect resistance, because this reduces the headline number, but it aligns the SDR's incentive with the AE's.
The second pitfall is an undefined acceptance standard. If the AE decides case by case whether a meeting was qualified, the acceptance rate becomes a measure of AE mood rather than SDR performance. Write the checklist down — budget confirmed or budget range identified, authority confirmed or economic buyer identified, need stated in the prospect's words, timeline within the next two quarters — and require the AE to check the boxes in the CRM before converting. When an AE rejects, they pick a reason code from the fixed list. Now the acceptance rate is comparable across AEs and across months.
The third pitfall is no feedback loop from AE back to SDR. SDRs who never hear why their meetings were rejected cannot improve. The cheapest fix is a weekly 30-minute session where the AE walks through two or three rejected meetings with the SDR team, no blame, just diagnosis: what did the prospect say, what did the SDR hear, what did the AE hear differently. Over a quarter this measurably raises acceptance rates because SDRs learn the qualification language.
The fourth pitfall is letting the handoff live in Slack or email instead of the CRM. If the SDR's context — the pain the prospect mentioned, the competitor they are evaluating, the person who referred them — lives in a DM, the AE will not see it and the discovery call starts cold. Require a structured handoff note in the CRM with three fields: pain, stakeholders, next step. It takes the SDR ninety seconds and saves the AE twenty minutes.
The fifth pitfall is treating the funnel as static. Conversion rates shift with seasonality, with product releases, with competitive moves, and with changes in your own lead-scoring. Review the stage conversions monthly, not quarterly. A 5-point drop in held-to-accepted in a single month is a signal worth investigating immediately — often it traces to a new lead source, a new SDR, or a change in the qualification checklist that nobody announced.
The sixth pitfall is over-indexing on the funnel at the expense of the individual. A funnel that converts at benchmark can still be hiding a star SDR whose meetings convert at twice the rate and a struggling SDR whose meetings convert at half. Segment the funnel by rep, by source, and by segment before drawing conclusions. The aggregate number tells you whether the system works; the segmented numbers tell you who needs coaching and which source needs pruning.
Related questions
What is a good SDR-to-AE acceptance rate?
For mid-market B2B SaaS, 55% to 75% is the typical band. Below 55% suggests a targeting or qualification-language problem between the two roles. Above 75% often means the acceptance standard is loose, which pushes the problem downstream into longer sales cycles and more stalled deals.
How many meetings should an SDR book per month?
Eight to twelve held meetings per month is sustainable for a full-cycle SDR doing their own prospecting in mid-market. Fifteen to twenty is realistic only with strong inbound flow or a dedicated list-building function feeding the SDR.
Should the opportunity be created when the meeting is booked or when it is held?
Create it when the AE accepts the held meeting as qualified. Creating it at booking inflates pipeline with meetings that never happen. The 24-hour acceptance rule after the held meeting keeps pipeline clean without delaying visibility.
What is the biggest leak in the SDR-to-AE Funnel?
Usually the booked-to-held stage, driven by no-shows and reschedules. A confirmation email within 24 hours of booking plus a reminder 24 hours before the meeting typically recovers 10 to 15 percentage points of hold rate.
Does the SDR-to-AE model work for enterprise deals?
Yes, but with a 1:1 SDR-to-AE ratio and longer qualification cycles. Enterprise SDRs often spend weeks researching an account before the first touch, and the acceptance standard includes multi-threading and a mapped buying committee rather than a single confirmed pain point.
FAQ
What is the SDR-to-AE Funnel? It is the chain of stage conversions between a sales development rep booking a meeting and an account executive closing the deal. Each stage — booked, held, accepted, discovery, demo, proposal, closed-won — has its own owner, exit criteria, and conversion rate. The funnel's value is that it makes each handoff measurable, so pipeline leaks can be traced to a specific seam rather than blamed on "the leads."
Why does the SDR-to-AE handoff break down so often? Because the two roles are measured on different things. SDRs are typically measured on activity and meetings booked; AEs on closed revenue. That mismatch means an SDR is rewarded for a meeting the AE considers wasted. The fix is a shared acceptance standard written down in advance, a fixed rejection reason list, and a two-part SDR quota that credits held and accepted meetings, not just booked ones.
How do you calculate end-to-end funnel conversion? Multiply the stage conversion rates together. If booked-to-held is 72%, held-to-accepted 65%, accepted-to-demo 60%, demo-to-proposal 45%, and proposal-to-closed 32%, the end-to-end rate is 0.72 × 0.65 × 0.60 × 0.45 × 0.32, which is roughly 4%. Compare that to your benchmark band of 2% to 5% for mid-market, then find the stage that is furthest below benchmark and fix that one first.
What CRM fields are essential for tracking this funnel? At minimum: meeting booked date, meeting held date, AE acceptance status, rejection reason code, opportunity created date, stage, and close date with outcome. Add the SDR owner and AE owner on every record so you can segment by rep. Without the rejection reason code and the dual ownership fields, you can measure the funnel but you cannot diagnose it.
How often should the funnel be reviewed? Stage conversions monthly, full funnel quarterly. Monthly review catches sudden shifts — a new lead source, a new SDR ramping, a checklist change — before they compound. Quarterly review is where you set targets, adjust the SDR-to-AE ratio, and decide whether the specialized model still fits your deal size and motion.
Does a longer sales cycle change the funnel benchmarks? Yes, and mostly at the back end. Longer cycles push proposal-to-closed-won down because more deals stall in procurement, legal, or budget approval. The front-end stages — booked-to-held and held-to-accepted — stay roughly stable because they depend on the quality of the first conversation, not the length of the process. If your cycle is long and your front-end conversion is also weak, you have two separate problems to fix.
Sources
- HubSpot Sales Blog — Sales Funnel Metrics
- Salesforce — Sales Pipeline Management Guide
- Gartner — Sales Development Best Practices
- Harvard Business Review — The New Sales Playbook
- Forrester — B2B Revenue Operations Research
- LinkedIn Sales Solutions — State of Sales Report
- Sales Management Association — Research and Benchmarks
- RevOps Co-op — Community Resources
Related on PULSE
This page will be disappearing soon. Save it to your device for $1 — or read it free while it is here.
@Kory-White- · if Venmo asks, the last 4 of my number are 2012
This page is gone.
This one is off the shelf now. $1 keeps it on your phone for good — the whole page, pictures and diagrams included.
 graphicMarketing Funnel — TOFU MOFU BOFU
 graphicABM Funnel Inverted
 graphicSales Funnel — 4 Stages
 graphicCustomer Lifecycle Funnel
 graphicSales Funnel — 7 Stages
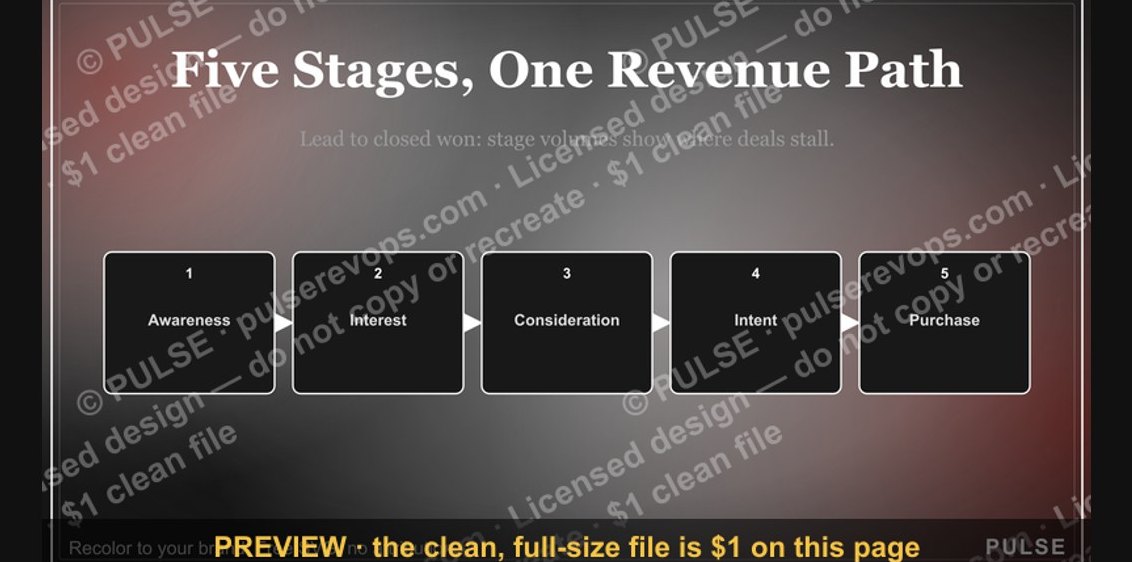 graphicSales Funnel — 5 Stages
 graphicPLG Conversion Funnel
 graphicNRR Beats New Logos — Revenue Law Banner
 graphicOffensive Security Pentest CRO — LinkedIn Banner
 graphicWhat do top-performing graphic designers do differently in 2027?