
NRR Beats New Logos — Revenue Law Banner
 Curated byKory White · Fractional CRO · Maryland
 PULSEKNOWLEDGE LIBRARY
Quality
Certified
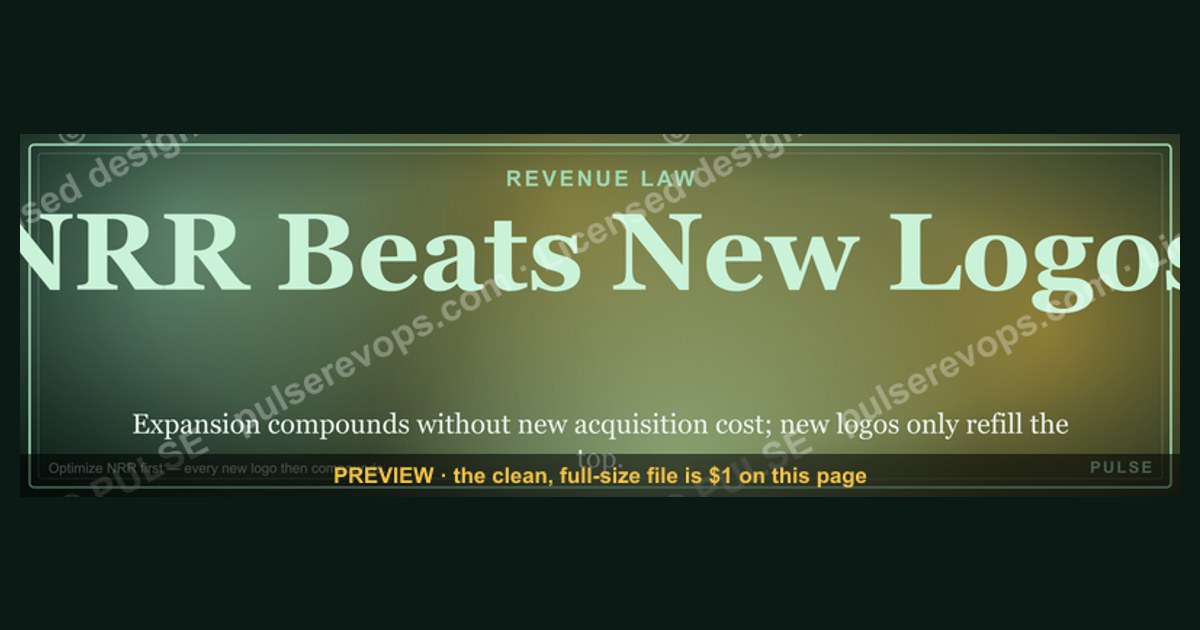
This is a downloadable LinkedIn banner graphic, 1600×500 px, titled "NRR Beats New Logos — Revenue Law Banner." In bold gold serif type on a black field it states one revenue law: net revenue retention Beats new logo acquisition as the growth engine. Download the PNG free on this page and use it on a profile, post, or deck cover.
The scenario this banner was drawn for
Picture a B2B SaaS leadership meeting in the second week of a new fiscal year. The board deck has one slide that matters: growth came in at 18% year over year. The CRO points out that new logo bookings were up 22% — a genuinely good number, the best in three years. Then the CFO asks the question that reframes everything. What happened to the customers we already had? The answer is that gross churn plus downgrades ate 14 points of that growth. Existing accounts, in aggregate, shrank. The company spent twelve months and a large share of its sales capacity acquiring revenue that was partly consumed by the revenue walking out the back door.
That is the moment this banner exists for. It is not a subtle argument. It is a one-line revenue law, sized to sit at the top of a LinkedIn profile or a slide, making a claim that most operators in subscription businesses already believe but rarely state this bluntly: the money you keep from customers you already have is worth more than the money you win from customers you do not yet have. The banner is designed to be legible at thumbnail size in a feed, which is why it uses four words of large type rather than a chart. A chart would be more precise. A chart would also be unreadable at 200 px wide. The banner trades precision for memorability on purpose, and the rest of this page explains what that trade costs and when it is worth making.
The scenario matters because the banner is a claim about incentives, not just a claim about arithmetic. A company that celebrates new logos in its all-hands, its spiffs, and its quota design will get more new logos and less retention, regardless of what any banner says. The graphic is a conversation starter for changing that, and it only works if the numbers behind it are real.

What is actually on the graphic, element by element
The banner is a single horizontal composition at 1600×500 pixels, a 16:5 aspect ratio chosen so it reads as a wide strip rather than a square card. Reading left to right:
The title line. "NRR Beats New Logos" sits in the upper portion of the canvas in a heavy serif face, set in a metallic gold that reads as warm yellow rather than orange. The word "Beats" is the visual pivot — it is the verb that carries the claim, and in most variants of this banner it is the largest or most saturated element. The capitalization is title case throughout, which gives it the register of a law or a maxim rather than a slogan.
The subtitle line. "Revenue Law Banner" sits beneath the title in a smaller, lighter weight, often in a muted gold or off-white. This line does the framing work: it tells the viewer the title is not a product claim or a hot take but a stated rule. It is deliberately smaller so that it does not compete with the four words that carry the argument.

The field. The background is a flat near-black, typically in the #0A0A0A to #111111 range. There is no gradient, no photograph, no stock imagery of a handshake or a rising arrow. This is a deliberate choice: a photographic background at 1600×500 with text over it becomes illegible when LinkedIn compresses and downsizes the image in a feed. Flat black holds contrast at every scale.
Negative space. Roughly 60% of the canvas is empty. The type block is centered or slightly left-of-center with generous margins — typically 80 to 120 px of padding on the long edges. The emptiness is what makes the four words feel like a declaration rather than a caption.
No logo, no URL, no QR code. The base version carries no branding. This is intentional and it is the single most important design decision on the graphic: an unbranded banner can be reposted, screenshotted, and reused by anyone on a revenue team without looking like an advertisement. If you want attribution, the standard move is to add a small wordmark in the lower-right corner at no more than 15% of the canvas height, which preserves the clean read.
The exact wording the graphic carries, in full, is the title and the subtitle and nothing else. There is no third line, no footnote, no disclaimer. Every word on the canvas is doing work.

How the mechanism actually works
The mechanism the banner points at is straightforward once you separate the two inputs to revenue growth. Total revenue growth equals new logo revenue plus expansion revenue minus churn and downgrade revenue. NRR — net revenue retention — is the ratio of the revenue from a cohort of existing customers at the end of a period to the revenue from that same cohort at the start, including expansion, contraction, and churn but excluding any new customers. An NRR of 110% means the existing base grew 10% on its own, before a single new logo is signed.
The reason NRR Beats new logos is not that new logos are unimportant. It is that NRR compounds and new logos do not. A dollar of expansion inside an existing account arrives with near-zero acquisition cost, no new implementation burden in most cases, and a much higher probability of renewal than a cold prospect has of closing. A dollar of new logo revenue arrives with a fully loaded cost of acquisition that in mid-market B2B SaaS commonly runs somewhere between one and two times first-year contract value, and it starts its retention clock at zero.
The arithmetic in the diagram shows the asymmetry. Two identical companies, both with 10% monthly gross churn and the same sales capacity. One spends that capacity on twelve new logos. The other spends it on expanding thirty existing accounts by 20% each. The new-logo company ends the month at 1.02M MRR. The NRR-first company ends at 1.14M. Same cost, same headcount, a twelve-point gap in net growth — and the gap widens every month because the expanded base is now larger and expands again.
There is a second mechanism underneath this one, and it is the reason the banner says "Beats" rather than "equals." Expansion revenue is not just cheaper; it is more predictable. Expansion comes from usage growth, seat additions, tier upgrades, and cross-sell — all of which are triggered by the customer's own success, which you can observe in product telemetry weeks before the renewal conversation. New logo revenue is triggered by market conditions you do not control. A revenue plan weighted toward NRR has a shorter feedback loop and a smaller variance than one weighted toward new logos, which is worth real money in forecasting accuracy even before you count the acquisition cost savings.
Real numbers, ranges, and benchmarks
The banner makes a qualitative claim, so it is worth grounding it in the ranges practitioners actually see. These are broad industry ranges, not figures from a single study, and your own cohort data should always win over any benchmark.
NRR by segment. Enterprise B2B SaaS companies with large contract values and multi-year terms commonly report NRR in the 110% to 125% range at the top quartile, with a median closer to 105% to 110%. Mid-market companies typically land between 100% and 110%. SMB-focused products with high-volume, low-touch customers frequently sit below 100% — 85% to 95% is common — because small customers churn for reasons no amount of account management can prevent. A banner claiming NRR Beats new logos lands differently in each of those segments, and in the SMB case it is often simply false.

Gross revenue churn. The inverse number matters just as much. Annual gross revenue churn of 10% to 15% is respectable for enterprise; 20% to 30% is typical for mid-market; SMB can run 30% to 50% annually. If gross churn is above 30%, no expansion motion will outrun it, and the correct first move is not a retention banner but a churn investigation.
Expansion as a share of new ARR. In companies with strong NRR, expansion frequently contributes 30% to 50% of total new ARR in a given year. In companies that lead with new logos, that figure often sits at 10% to 20%. The gap between those two numbers is roughly the size of the argument on this banner.
Cost of acquisition versus cost of expansion. Fully loaded CAC for a new mid-market logo commonly runs 1.0x to 1.5x first-year ACV, and payback periods of 12 to 24 months are normal. Expansion into an existing account frequently carries a CAC of 0.2x to 0.5x the incremental ACV, with payback measured in weeks or a few months. That ratio — roughly three to five times cheaper — is the strongest single number behind the banner's claim.

The compounding effect over three years. Take a $10M ARR business. Path A grows new logos at 40% annually with 95% NRR. Path B grows new logos at 25% annually with 115% NRR. After three years, Path A is at roughly $27M ARR and Path B is at roughly $29M — and Path B got there with materially less sales spend, which means a better margin and a better Rule of 40 score. The NRR-led path does not just win on efficiency; over a three-year horizon it usually wins on absolute size too.
Retention and valuation. Multiples in SaaS correlate more tightly with NRR than with growth rate in most periods. A company at 30% growth and 120% NRR typically commands a higher multiple than one at 40% growth and 95% NRR. This is the financial reason the banner exists: the market has already priced in the claim.
Trade-offs and alternatives
The banner states a law, and like most laws it has conditions. The honest trade-offs:

NRR is capped by the size of your installed base. If you have 40 customers and $2M ARR, a 120% NRR engine adds $400K next year. A new logo motion can add $2M. In early-stage companies the banner's claim is arithmetically weak, and the correct posture is to acquire logos aggressively while instrumenting retention so you can switch weight later. The banner is a mid-stage and late-stage law, not a seed-stage one.
Expansion requires product surface area. You cannot expand accounts that have nothing left to buy. Companies with a single-product, single-seat offering often have a hard NRR ceiling in the 100% to 105% range no matter how good the CS team is. The path to 115%+ usually runs through additional modules, usage-based pricing, seat growth, or a platform motion — all of which are product decisions, not sales decisions.
Over-rotating on NRR hides acquisition problems. A company with 130% NRR and collapsing new logo bookings is a company with a shrinking future. Expansion is a lagging indicator of past acquisition success; if the base stops growing, expansion revenue eventually plateaus and then declines. The banner says NRR Beats new logos. It does not say new logos are optional.

Channel and market alternatives. Some businesses genuinely cannot pursue expansion: transactional products, one-time-purchase models, and heavily regulated markets where adding modules requires re-certification. For those, the alternative to NRR is not new logos but pricing power — annual escalators, usage tiers, and packaging changes that raise revenue per existing customer without a true expansion motion. That is a legitimate substitute and it deserves its own banner.
The political trade-off. Shifting weight from new logos to NRR means moving budget from sales to customer success, from SDR headcount to product-led growth instrumentation, and from a new-logo commission plan to a net-retention commission plan. That is a real organizational fight, and the banner is often used as the opening slide in it. Expect resistance from anyone whose compensation is tied to new bookings.
Common pitfalls and how to avoid them
Pitfall one: quoting NRR without defining it. There are at least four commonly used definitions — revenue retention including expansion, excluding expansion, on a dollar-weighted versus logo-weighted basis, and on a trailing-twelve-month versus cohort basis. Two teams can both claim 110% NRR and be measuring entirely different things. Fix: state your definition in the same breath as the number, and pick one definition and hold it for at least eight quarters.
Pitfall two: using the banner as a substitute for the work. A graphic on a LinkedIn profile does not improve retention. The banner is a communication artifact. If the retention motion behind it is not funded, staffed, and instrumented, the banner becomes a claim your own team quietly disagrees with. Fix: pair any internal use of the banner with a specific, funded NRR target and a named owner.

Pitfall three: ignoring gross churn. NRR can look healthy while gross churn is quietly terrible, because expansion from a small number of large accounts masks losses everywhere else. A 115% NRR built on 40% gross churn is a fragile business concentrated in a handful of accounts. Fix: always report gross revenue churn and NRR side by side, and segment both by cohort, by plan, and by acquisition channel.
Pitfall four: expansion that is really just price increases. Raising prices on a captive base produces expansion revenue that looks identical to genuine expansion in the NRR calculation but behaves completely differently at renewal. Fix: split expansion into usage-driven, cross-sell, and price-driven buckets and track them separately.
Pitfall five: banner legibility at feed scale. A 1600×500 banner with 40 px of padding and a thin serif face will look sharp in the design tool and mushy in a LinkedIn feed on a phone. Fix: preview at 200 px wide before you publish, and if the words are not readable at that size, increase the type size and cut the padding.

Pitfall six: using the banner on a company page where it reads as a product claim. On a personal profile the banner reads as a professional belief. On a vendor's company page it can read as a promise about the product. Fix: keep the unbranded version for personal and community use, and if you adapt it for a company page, add the wordmark and a clear qualifier.
Pitfall seven: assuming the law holds across your whole book. NRR Beats new logos is true in aggregate and often false in specific segments. Your enterprise cohort may run 125% while your self-serve cohort runs 82%. Fix: compute NRR by segment before you apply the law, and weight your investment accordingly rather than applying one rule to the whole base.
Pitfall eight: celebrating NRR without checking the denominator. A 130% NRR on a shrinking base of ten accounts is not a growth story. Fix: always report NRR alongside absolute ARR, logo count, and new logo additions so the base size is visible.
Related questions
What does NRR stand for?
Net revenue retention — the percentage of recurring revenue retained from an existing cohort over a period, including expansion, contraction, and churn, but excluding new customers. An NRR above 100% means the existing base grew without any new logos.
Is NRR Beats new logos always true?
No. It is reliably true for mid-market and enterprise subscription businesses with expansion surface area and gross churn under roughly 20%. For early-stage companies with small bases, or SMB products with structurally high churn, new logo acquisition usually drives more absolute growth.
What is a good NRR benchmark?
Top-quartile enterprise B2B SaaS commonly reports 110% to 125%. Mid-market typically sits at 100% to 110%. SMB frequently falls below 100%. Always compare against your own segment and contract-size band rather than a cross-industry average.
How do I use the banner?
Download the PNG from this page and upload it as a LinkedIn profile background, a post image, or a slide cover. Keep the type large, preview it at 200 px wide, and add a small wordmark only if you need attribution.
FAQ
What exactly is the "NRR Beats New Logos — Revenue Law Banner"? It is a 1600×500 px downloadable PNG graphic. It carries two lines of text — "NRR Beats New Logos" in gold serif and "Revenue Law Banner" beneath it — on a flat near-black field. It is designed for LinkedIn profile backgrounds, post images, and slide covers, and it is free to download from this page.
Why is it 1600×500 pixels? That is the standard LinkedIn profile background and article-header proportion, a wide 16:5 strip. It also scales cleanly to slide covers at 1920×600 and to Twitter/X header proportions with minor cropping. Designing at 1600×500 keeps the type block centered and safe from the profile-photo overlap on the left side of a LinkedIn profile header.
Can I change the wording? Yes. The most common edits are swapping "NRR" for "Retention," "Expansion," or "Net Retention," and swapping "New Logos" for "New Bookings" or "New ARR." Keep the verb "Beats" — it is the word doing the argumentative work. If you change the verb to "Equals" or "Supports," the banner loses its point.
Is the claim in the banner backed by data? The directional claim is well supported by widely reported SaaS benchmarks: expansion revenue typically carries a CAC of roughly one-third to one-fifth that of new logo acquisition, and NRR correlates more strongly with valuation multiples than growth rate does in most periods. The banner itself carries no statistics, and you should validate the claim against your own cohort data before repeating it internally.
Where should I not use this banner? Avoid using it on a vendor's company page where it can read as a product guarantee, in any context where it would imply a specific performance outcome, or on an early-stage company's materials where the arithmetic does not yet hold. It is a professional belief statement, not a marketing claim.
Do I need to credit anyone when I repost it? The base version is unbranded and designed to be shared. If you adapt the wording or colors for your own team, the adapted version is yours. If you repost the original, a link back to this page is appreciated but not required.
Sources
- Bessemer Venture Partners — State of the Cloud
- OpenView Partners — SaaS Benchmarks
- SaaS Capital — Annual SaaS Survey
- ChartMogul — SaaS Retention Benchmarks
- ProfitWell — Retention and Churn Research
- Harvard Business Review — The Value of Keeping the Right Customers
- LinkedIn Help — Profile Background Photo Guidelines
Related on PULSE
- Net Revenue Retention: How to Calculate and Improve It
- Gross Revenue Churn vs. Net Revenue Churn
- Expansion Revenue Motions That Actually Compound
- Designing Comp Plans Around Net Retention
- Customer Success Staffing Models by ARR Band
- When New Logo Growth Is Still the Right Answer
This page will be disappearing soon. Save it to your device for $1 — or read it free while it is here.
@Kory-White- · if Venmo asks, the last 4 of my number are 2012
This page is gone.
This one is off the shelf now. $1 keeps it on your phone for good — the whole page, pictures and diagrams included.
 graphicDiscovery is the Whole Job — Banner
 graphicICP Discipline: Say No to Win More — Banner
 graphicInspect with rigor — Sales Management Banner
 graphicSales Cycles Shrink With Trust — Banner
 graphicWin the deal then win the customer — CS Mindset Banner
 graphicForecast First, Pipeline Second — Banner
 graphicPipeline is oxygen — RevOps Mindset Banner
 graphicChampions Close Deals — Banner
 graphicBuild the system — RevOps Mindset Banner
 graphicMEDDPICC Qualification Framework — Banner