
ABM Funnel Inverted
 Curated byKory White · Fractional CRO · Maryland
 PULSEKNOWLEDGE LIBRARY
Quality
Certified
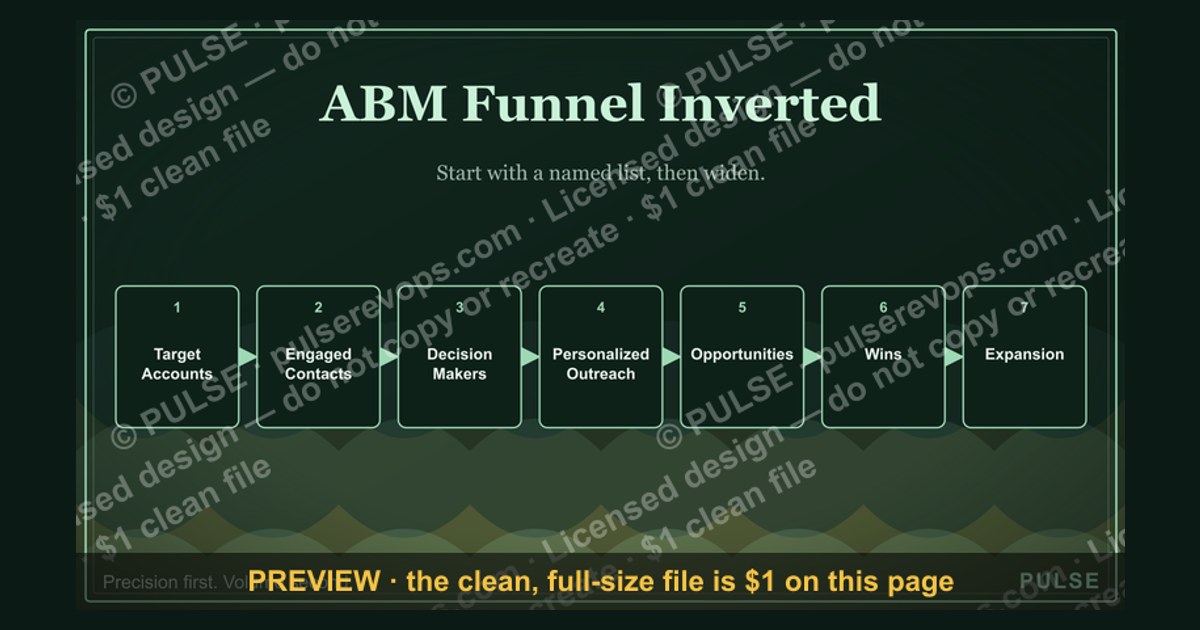
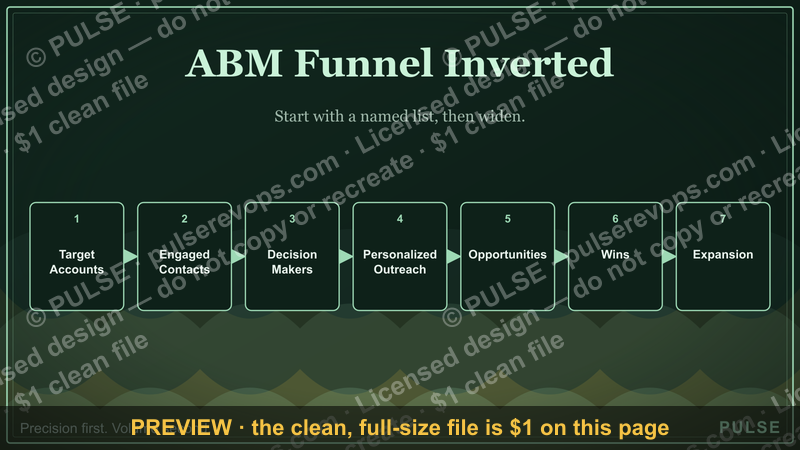
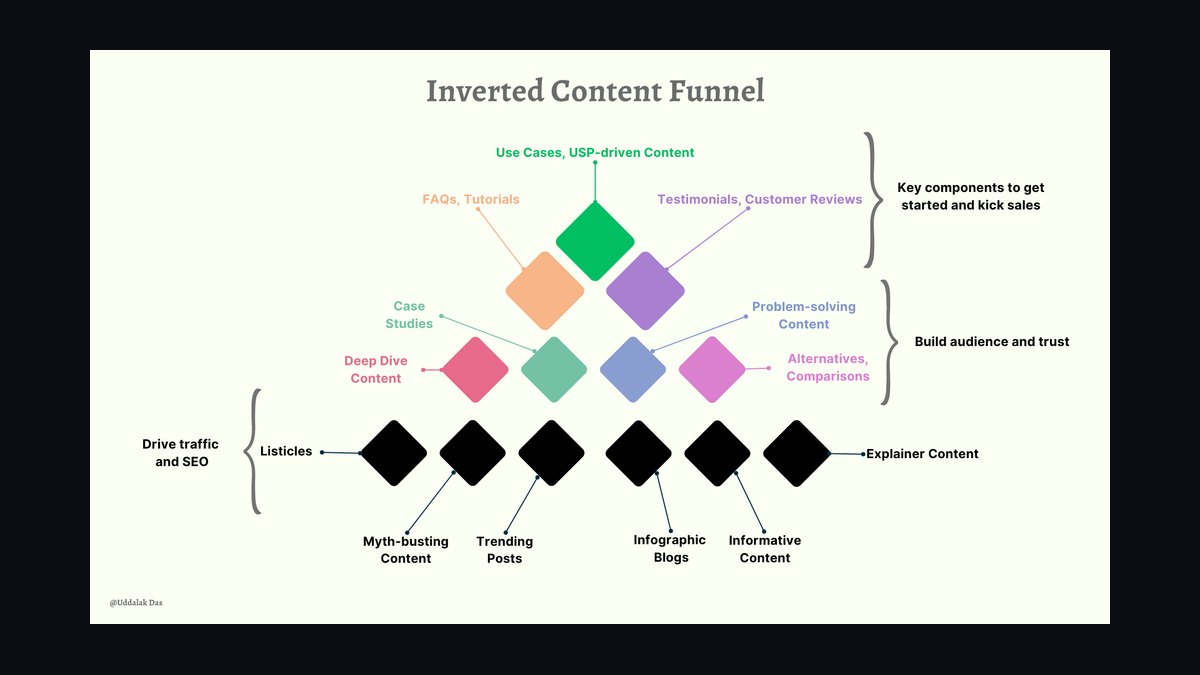
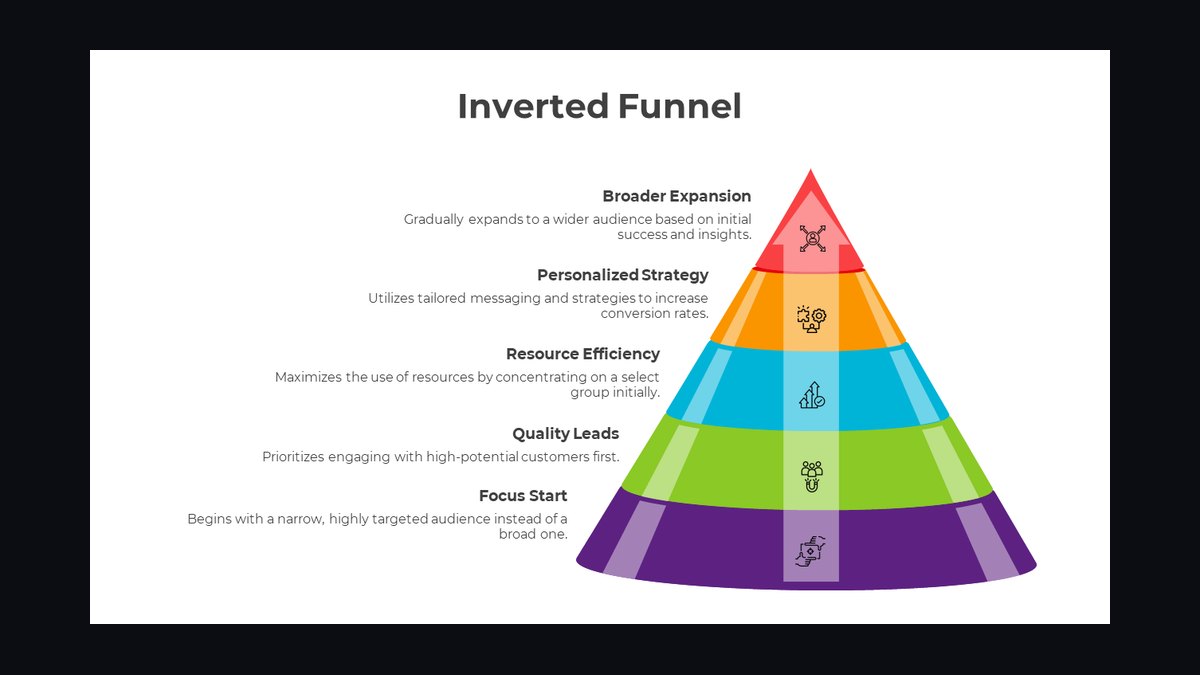
This process flowchart, titled "ABM Funnel Inverted," shows how an account-based motion flips the classic demand funnel: target accounts are chosen first, then worked top-down from a named list rather than bottom-up from leads. It maps the stages, owners, and handoffs where intent signals, buying-committee coverage, and pipeline conversion replace raw lead volume as the primary scoreboard.
The outcome you should expect
The Inverted Funnel is not a metaphor for "do marketing backwards." It is a structural change in where the work starts and which metric governs the program. In a classic demand funnel, marketing generates volume at the top, sales qualifies at the bottom, and the two teams argue about lead quality in between. In the inverted model, revenue operations and sales leadership define a target account list first, and every downstream activity — advertising, outbound, events, content, SDR sequencing — is pointed at that finite list. The outcome you should expect is a smaller number of accounts, a higher cost per account, a longer ramp to first signal, and a materially higher win rate and average contract value on the accounts you do convert.
Practically, that shows up in four measurable places. First, account coverage: the percentage of your target list with at least one engaged buying-committee member. Healthy programs push coverage above 60% within two quarters. Second, committee depth: the number of distinct roles engaged per account, where three to five roles (economic buyer, champion, technical evaluator, end user, procurement) is the practical target for mid-market and enterprise deals. Third, stage velocity: how fast an account moves from "identified" to "engaged" to "opportunity," which typically runs slower than inbound at the top and faster at the bottom. Fourth, efficiency: pipeline per account touched, and cost per closed-won dollar, which usually improves even as cost per lead rises.

The trade-off is real. You will spend more per account and you will spend it earlier, before any intent signal confirms the account is in-market. That means the program looks inefficient on lead-based dashboards for the first one to two quarters. RevOps has to reset the reporting before the program launches, not after, or the team will kill a working program because it fails a metric that no longer describes the motion. Expect the first cohort to take 90 to 180 days to produce a reliable read, depending on sales cycle length and how much of the target list is already in your CRM.
What drives that outcome
Three forces drive the inverted result. The first is selection quality. If the target list is built from a defensible ideal customer profile — firmographics, technographics, and a real signal such as a funding event, a leadership change, a product launch, or a hiring pattern — the program compounds. If the list is built from "companies we'd like to sell to," it stalls. The second is coverage discipline. Inverted funnels fail when coverage is treated as a marketing KPI rather than a revenue KPI. Every account needs a named owner, a next action, and a date. The third is orchestration: the sequence in which channels touch the account. Advertising alone rarely converts; advertising that warms an account before an SDR sequence and a personalized executive outreach lands far better.
The loop at the bottom matters more than any single box. Inverted funnels are learning systems. Every closed-won and closed-lost account should feed back into the ICP scoring model, because the target list is a hypothesis, not a fact. Programs that never re-score their list drift into a static named-account spreadsheet within two quarters and lose the compounding advantage.
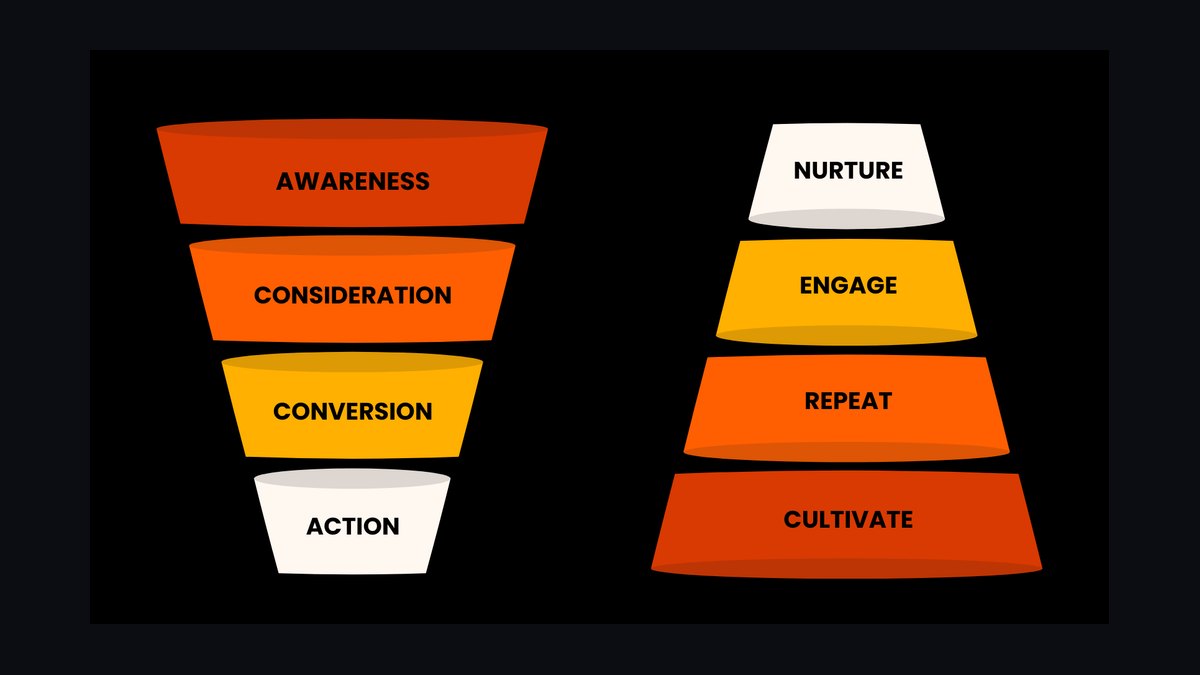
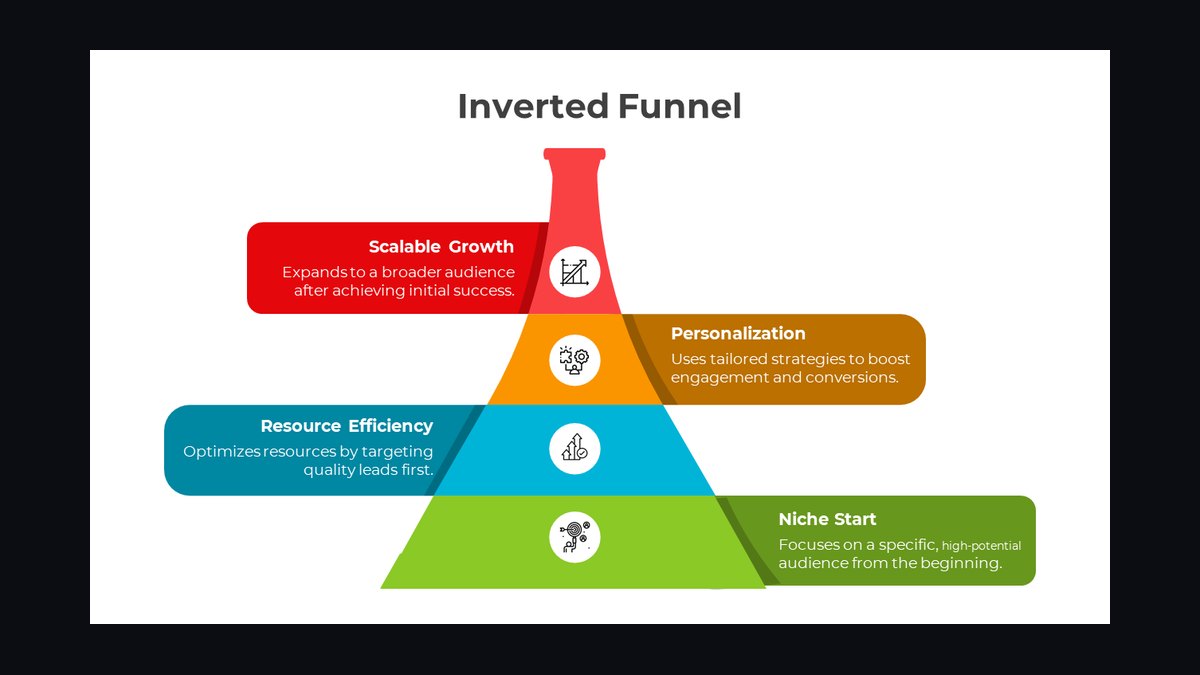
Tiering is what makes the economics work. A 1:1 tier with fully bespoke outreach is expensive and only viable for a few dozen accounts. A 1:few tier uses templated but personalized-by-segment plays. A 1:many tier runs programmatic advertising and automated sequencing with light personalization. The ratio depends on deal size: a $200K ACV enterprise motion might run 50 accounts at 1:1, 300 at 1:few, and 1,000 at 1:many, while a $20K ACV motion inverts that pyramid toward 1:many.
Benchmarks and realistic ranges
Benchmarks in ABM are directionally useful but easy to misuse, because definitions vary wildly between programs. Treat the following as sanity ranges drawn from common practitioner reporting, not as guarantees, and always measure against your own baseline rather than an external average.
Account coverage of the target list: 40% to 70% within two quarters is a reasonable band. Below 30% suggests the list is too large, the channels are too narrow, or ownership is unclear. Above 80% is possible but often means the list is too small or the engagement bar is set too low.
Buying-committee depth: two to three roles engaged per account is common at the start; three to five is the target for complex deals. Single-threaded accounts — one contact engaged — close at dramatically lower rates and are the single most common cause of stalled pipeline in ABM programs.
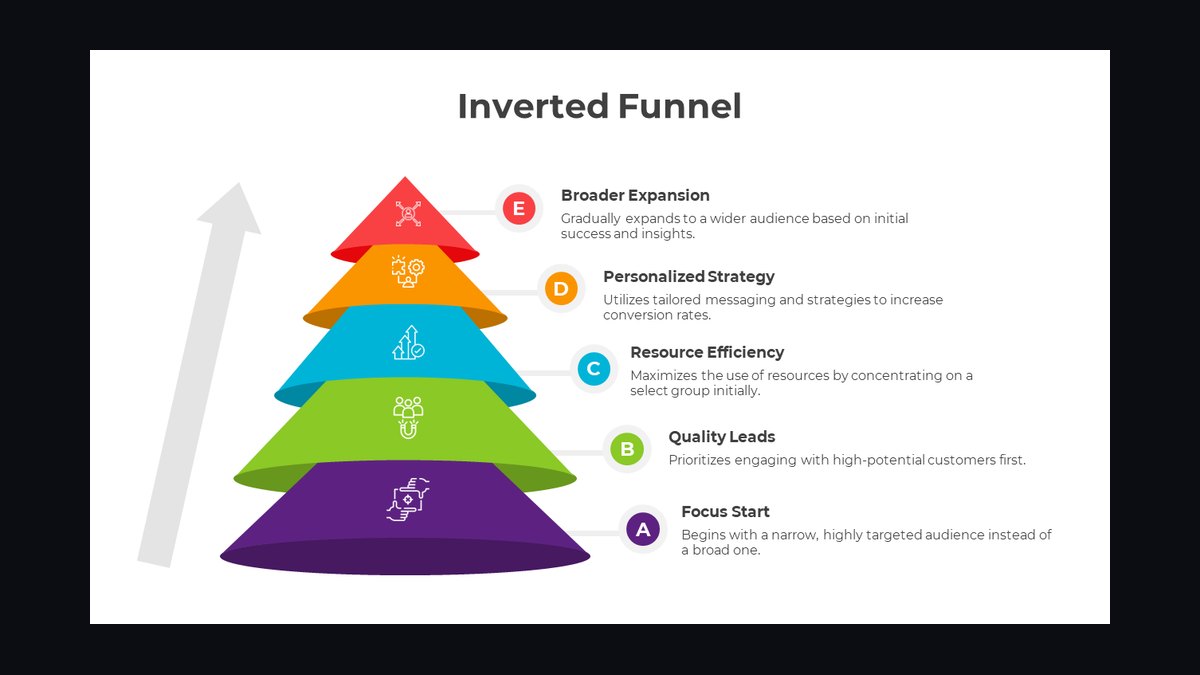
Engagement-to-opportunity conversion: 5% to 15% of engaged accounts converting to opportunity per quarter is a workable range for mid-market. Enterprise motions with long cycles may sit at 3% to 8%. If you are below 3%, the problem is usually qualification or ICP fit, not activity volume.
Opportunity-to-close on ABM-sourced pipeline: 25% to 40% is a common band, materially above typical inbound rates, because the accounts were pre-qualified by fit rather than by form fill.
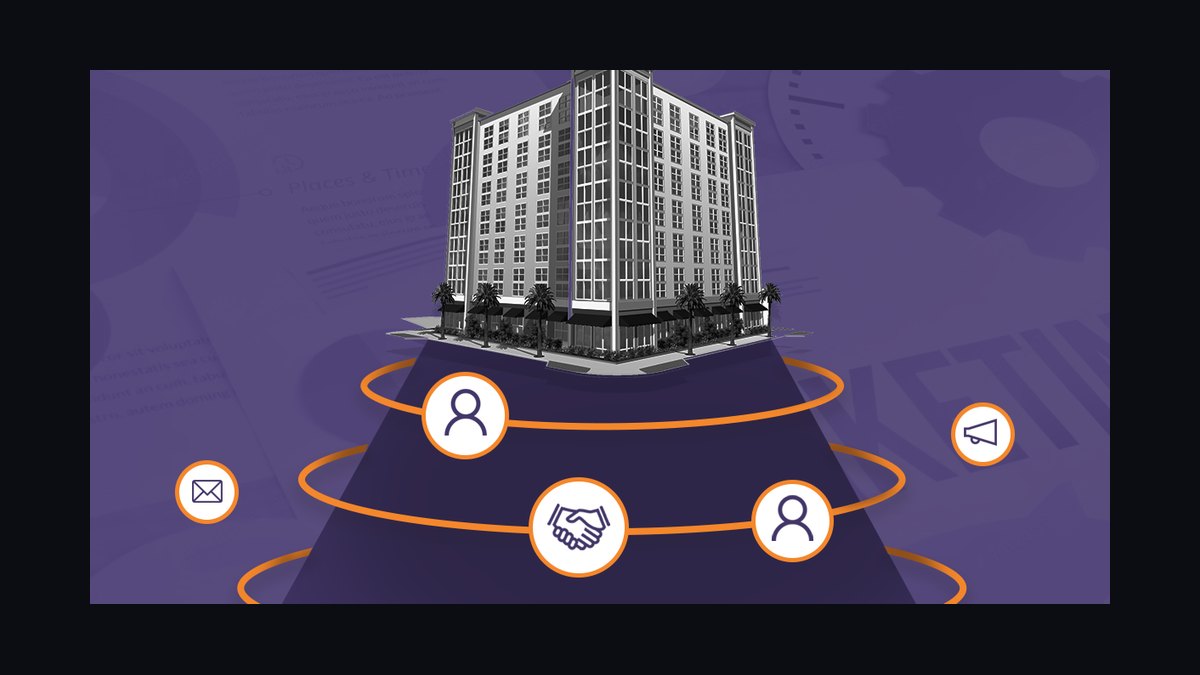
Average contract value lift: ABM programs frequently report 20% to 50% higher ACV than non-ABM pipeline, driven by multi-threading and earlier executive engagement. This is the number that justifies the higher cost per account.
Cost per account touched versus cost per lead: expect cost per account to look alarming next to cost per lead. A program spending $500 per target account per quarter is not unusual, and that number only makes sense when divided by pipeline generated per account rather than compared to a $50 cost per lead.
Sales cycle: expect ABM cycles to be similar or slightly longer at the top and shorter at the bottom. The compression happens after opportunity creation, when multi-threaded accounts move through legal, security, and procurement faster because relationships already exist.
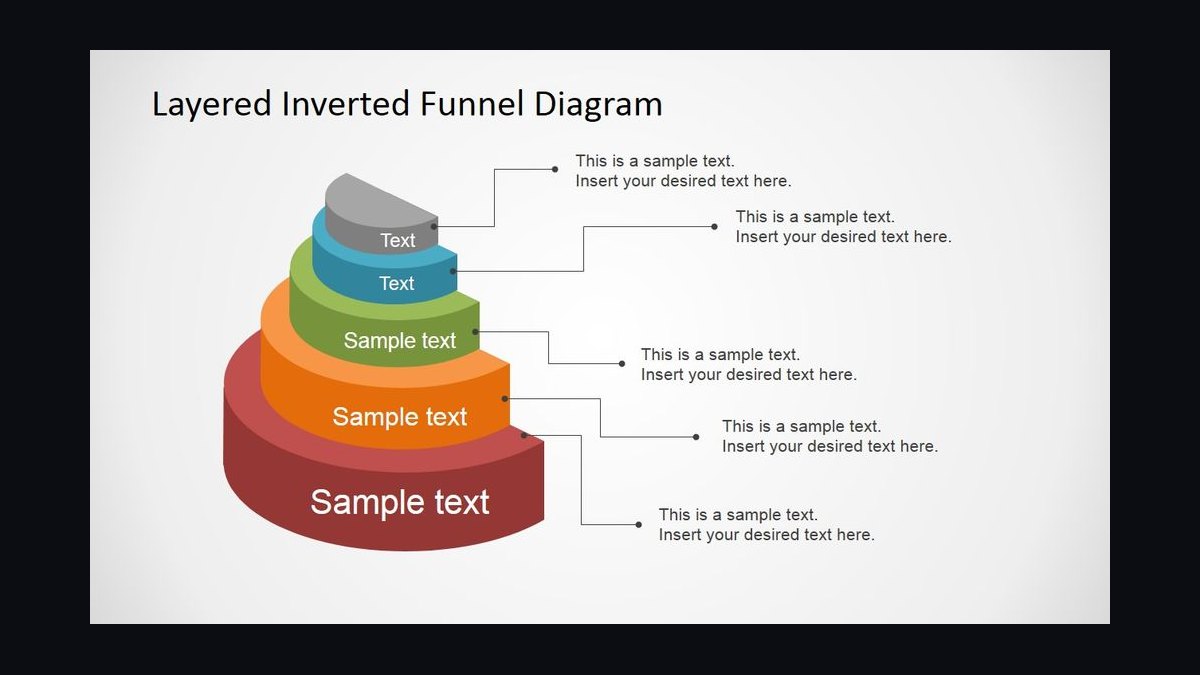
The most useful internal benchmark is cohort-over-cohort improvement. If quarter two's target list closes at a higher rate than quarter one's, the ICP model is learning. If it does not, the feedback loop is broken.
Risks, edge cases, and failure modes
The most common failure is treating ABM as a campaign rather than an operating model. A team runs a display campaign against a list of 500 accounts for one quarter, sees weak results, and concludes ABM does not work. The problem was never the concept — it was the absence of ownership, sequencing, and feedback.
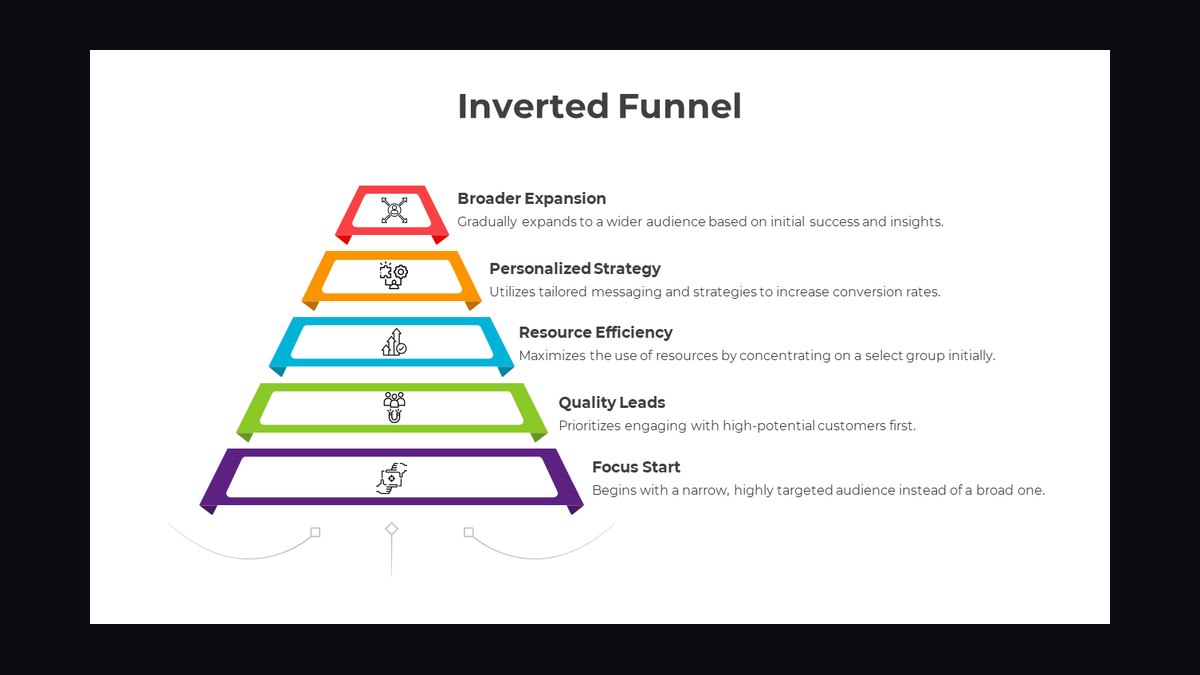
The second failure is list bloat. Target lists grow because every sales rep wants their favorite account included. Once the list exceeds what the team can genuinely cover, the program degrades into a slightly more expensive version of spray-and-pray. A useful discipline is a hard cap on tier 1 accounts tied to actual capacity: if you have five reps who can each personally work 20 accounts, tier 1 is 100 accounts, not 400.
The third failure is single-threading. An account shows engagement from one director, the rep treats it as qualified, and the deal stalls at the VP level because no one built a relationship with the economic buyer. Coverage depth is the antidote, and it has to be measured, not assumed.
The fourth failure is measurement mismatch. If leadership still reviews cost per lead weekly while the program runs on account coverage, the program will be defunded before it matures. RevOps has to publish a new dashboard before launch and get explicit agreement on which metrics define success in the first two quarters.
Edge cases worth planning for: accounts that go dark after strong early engagement (usually a budget freeze or a champion departure — build a re-engagement play), accounts already in an active opportunity when the program starts (exclude or handle separately to avoid double-counting), and accounts that match the ICP but are locked into a multi-year competitor contract (nurture, do not spend tier 1 budget). Also plan for the "too many cooks" problem: when advertising, SDRs, field marketing, and AEs all touch the same account without coordination, the buyer receives a chaotic experience. A single account owner and a shared activity log solve this.
Finally, watch for attribution distortion. In an inverted funnel, many touches precede the opportunity, and last-touch attribution will credit whichever channel happened to fire last. Use multi-touch or account-level attribution, and accept that precision is lower than in a lead-based model.
A practical rollout plan
Rolling out an inverted funnel takes roughly two quarters to reach a stable read. The sequence below is the one most teams converge on, and the order matters: measurement and list definition come before spend.
Phase one, weeks one to three: agree on the ICP definition and, critically, on the metrics that will govern the program. Write down the coverage, depth, and pipeline targets and get sign-off from sales and marketing leadership. Phase two, weeks three to six: build the target list from CRM data, third-party firmographic data, and intent sources, then tier it. Cap tier 1 by capacity. Phase three, weeks six to eight: assign a named owner to every tier 1 and tier 2 account, and define the plays — what happens in week one, week two, week four. Phase four, weeks eight onward: launch advertising, outbound, events, and content in a coordinated sequence rather than all at once. Phase five, ongoing: report weekly on coverage and depth, monthly on pipeline. Phase six, quarterly: re-score the ICP against closed-won and closed-lost outcomes and refresh the list.

Ownership across the phases: RevOps owns the data model, the list build, and the reporting. Marketing owns advertising, content, and event orchestration. Sales development owns sequencing and initial meetings. Account executives own committee coverage and opportunity progression. A single program owner — often a director of ABM or revenue marketing — arbitrates disputes over list inclusion and budget allocation.
The most common rollout mistake is launching spend in phase four before phases one through three are complete. Teams that skip list definition end up optimizing channels against the wrong accounts, and the resulting data is useless for the feedback loop.
Related questions
What is the difference between an inverted ABM funnel and a classic demand funnel?
A classic funnel starts with broad lead generation and narrows to qualified opportunities. An inverted funnel starts with a defined target account list and expands outward to cover the buying committee within each account. The first optimizes for volume; the second optimizes for fit and depth.
How many accounts should be on a target list?
It depends on capacity, not ambition. Cap tier 1 at what your reps can personally work — often 20 to 50 accounts each. Tier 2 and tier 3 can be larger, but every account needs a named owner and a defined play.
What metrics replace cost per lead in ABM?
Account coverage, buying-committee depth, engagement-to-opportunity conversion, pipeline per account, and average contract value. Cost per account touched is useful internally but should never be compared directly to cost per lead.
How long before an inverted funnel shows results?
Plan for 90 to 180 days before a reliable read, depending on sales cycle length. Coverage and depth metrics appear sooner, often within 30 to 60 days, but pipeline and closed-won data lag.
Does ABM replace inbound marketing?
No. Most mature programs run both. Inbound captures demand that already exists; ABM creates and accelerates demand in accounts you have chosen. They share content, brand, and data infrastructure.
FAQ
Is the inverted funnel only for enterprise deals? No, but the tier ratios change. Enterprise motions lean heavily on 1:1 and 1:few plays because deal sizes justify bespoke effort. Mid-market and SMB motions shift toward 1:many programmatic plays with lighter personalization. The underlying logic — pick accounts first, then work them — applies at any deal size where a named account list is meaningful.
What is the biggest reason ABM programs fail? Treating ABM as a campaign instead of an operating model. A one-quarter display campaign against a list, with no account owners, no sequencing, and no feedback loop, will underperform and be abandoned. The programs that work have named owners, defined plays, and a quarterly re-scoring cycle.
How do we handle accounts that are already in an open opportunity? Exclude them from the target list or handle them in a separate track. Including active opportunities in coverage metrics double-counts engagement and distorts the read on new account acquisition. Coordinate with the AE so advertising and outbound do not create a confusing buyer experience.
What data do we need to build a target list? At minimum: firmographic fit (industry, size, geography), technographic fit where relevant, and at least one intent or trigger signal such as funding, hiring, leadership change, or product launch. CRM history — closed-won and closed-lost patterns — is the most underused input and should shape the ICP scoring model.
How does attribution work in an inverted funnel? Last-touch attribution will mislead you, because many touches precede the opportunity and the final one is often incidental. Use multi-touch or account-level attribution, and accept lower precision. The more useful question is which plays correlate with accounts that reach opportunity, not which single touch "caused" it.
Can we run ABM without dedicated software? Yes, at small scale. A CRM, a spreadsheet for the target list, and a coordinated calendar of plays will work for a few dozen accounts. Dedicated ABM platforms add value at scale through intent data, account scoring, and orchestration, but they are not a prerequisite for the operating model.
Sources
- https://www.forrester.com
- https://www.gartner.com
- https://www.hubspot.com
- https://www.salesforce.com
- https://www.6sense.com
- https://www.demandbase.com
- https://www.linkedin.com
- https://www.mckinsey.com
Related on PULSE
- Ideal customer profile definition and scoring
- Buying-committee coverage and multi-threading
- Intent data sources and signal prioritization
- Account tiering models for ABM programs
- Attribution models for account-based motions
- Sales and marketing handoff design in ABM
This page will be disappearing soon. Save it to your device for $1 — or read it free while it is here.
@Kory-White- · if Venmo asks, the last 4 of my number are 2012
This page is gone.
This one is off the shelf now. $1 keeps it on your phone for good — the whole page, pictures and diagrams included.
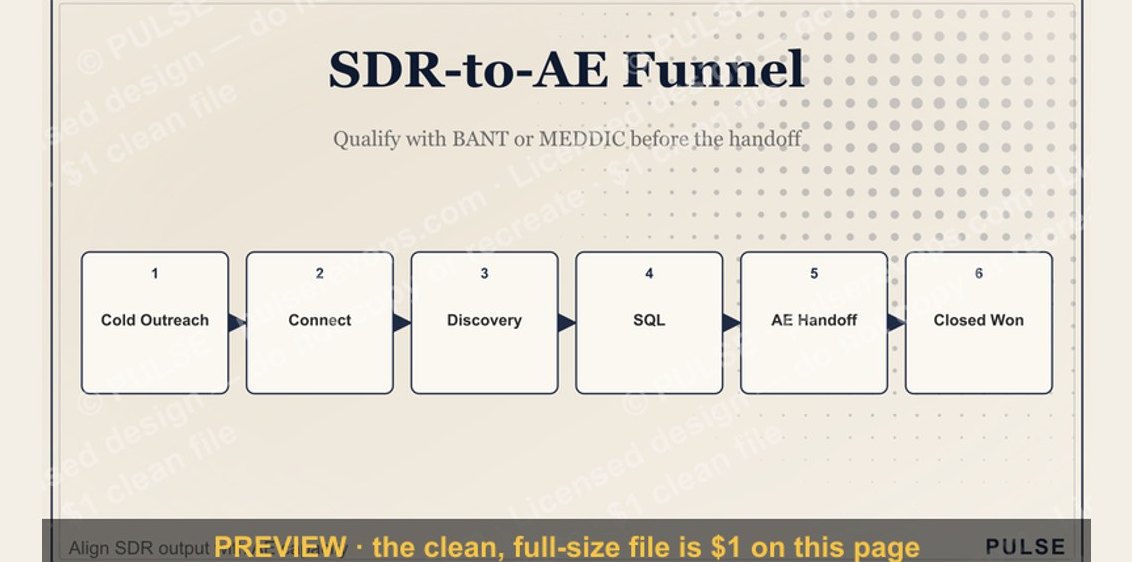 graphicSDR-to-AE Funnel
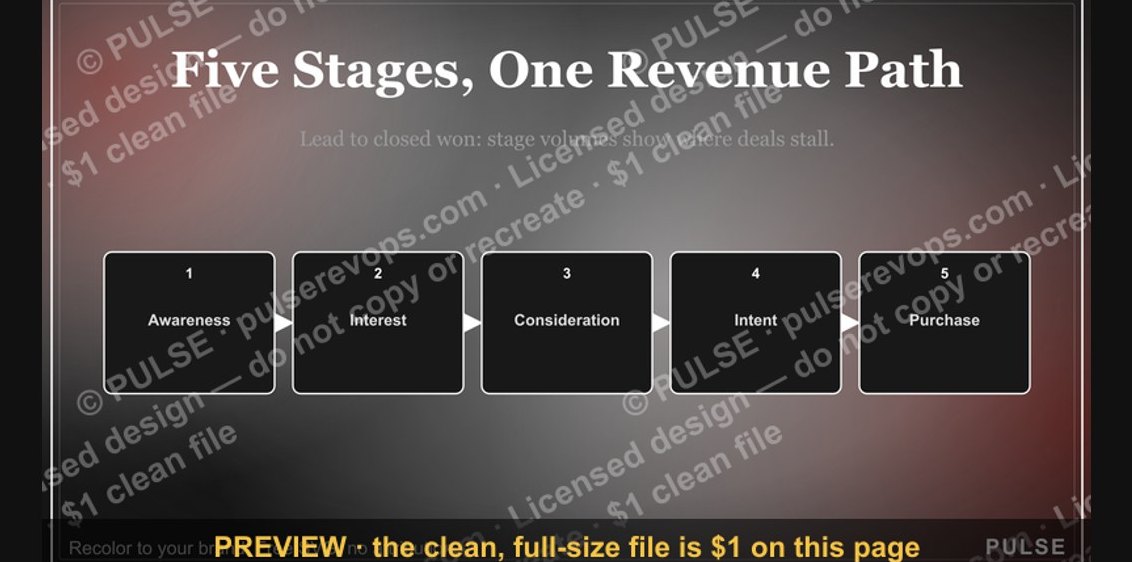 graphicSales Funnel — 5 Stages
 graphicSales Funnel — 7 Stages
 graphicPLG Conversion Funnel
 graphicSales Funnel — 4 Stages
 graphicCustomer Lifecycle Funnel
 graphicMarketing Funnel — TOFU MOFU BOFU
 graphic“Process scales. Heroics don't.” — Quote Card
 graphic“Great reps are coached, not born.” — LinkedIn Banner
 graphicOffensive Security Pentest CRO — LinkedIn Banner