
“Process scales. Heroics don't.” — Quote Card
 Curated byKory White · Fractional CRO · Maryland
 PULSEKNOWLEDGE LIBRARY
Quality
Certified
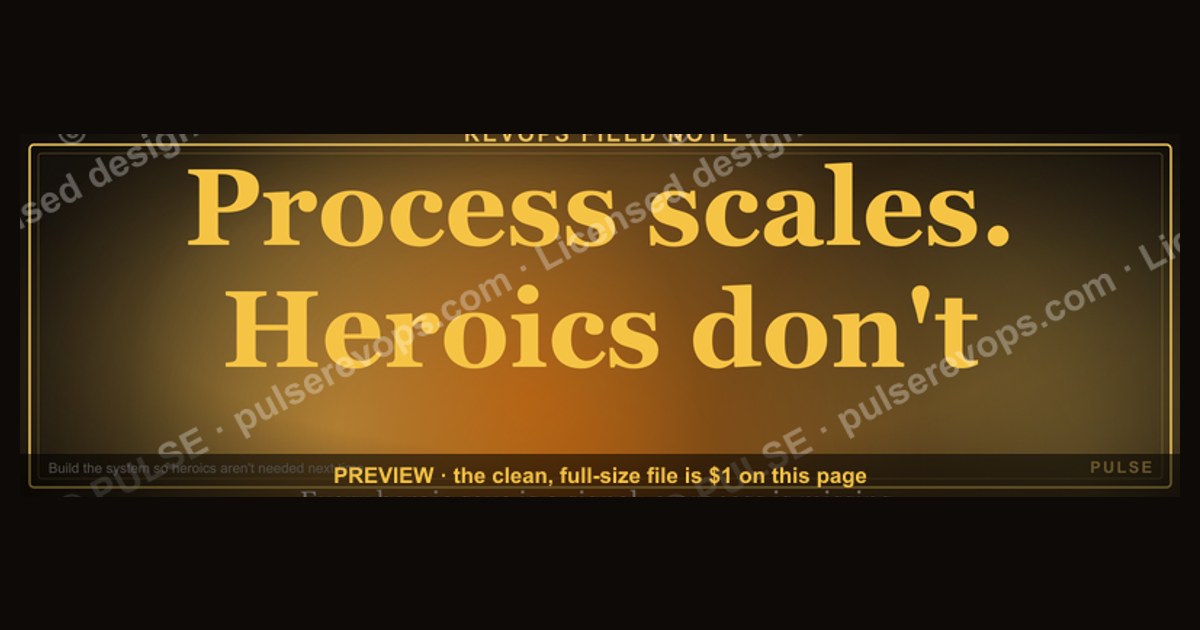

This banner is a free downloadable 1600x500 PNG quote card that reads "Process scales. Heroics don't." in bold type on a dark background. Use it in team channels, decks, or onboarding material to argue that repeatable systems beat individual firefighting. It is a conversation starter about operational discipline, not a performance review of anyone's effort.
The two options compared: process versus heroics
Every revenue team runs on some mix of two operating modes, and the quote card exists because most teams drift toward the wrong one without noticing. The first mode is Process: documented, repeatable steps that produce a predictable result whether the person executing them is brilliant, average, or brand new. The second mode is Heroics: individual effort, improvisation, and personal relationships that rescue a situation nobody planned for. Both modes produce results. They scale in opposite directions.
Process behaves like compound interest. A single well-built sequence — say, a five-touch outbound cadence with defined exit criteria at each stage — can be run by ten people, then fifty, then handed to a new hire in their second week. Each additional person adds capacity without adding coordination cost, because the coordination is baked into the steps. The marginal cost of the hundredth execution is close to the marginal cost of the first.

Heroics behave like a spot market. They are available on demand, they are expensive, and the supply does not increase when demand does. The account executive who personally calls in a favor to unblock a stalled deal is genuinely valuable — right up until there are forty stalled deals and one of them. Heroics also carry a hidden tax: they teach the organization that the rescue is the system. When a fire gets put out by a person rather than a fix, the underlying cause survives to burn again next quarter.
The practical distinction is not "good people versus bad systems." It is about where the variance lives. In a process-driven motion, variance sits in the inputs — lead quality, market conditions, pricing — and the team can measure and manage it. In a heroics-driven motion, variance sits in who happens to be on shift. That is unmeasurable in any way that helps you forecast.
There is a third position worth naming, because the quote card is often misread as an attack on individual initiative. The strongest teams run process as the default and heroics as the exception handler. Process handles the 80 to 90 percent of situations that recur. Heroics handle the genuinely novel 10 percent — the enterprise deal with an unusual legal structure, the outage during a product launch. The failure mode is not heroics existing. It is heroics becoming the default because nobody stopped to convert the last rescue into a step.

A concrete example from a mid-market SaaS revenue org: a team of eight account executives was closing roughly 22 deals a quarter, but the distribution was lopsided — two reps produced about 60 percent of the closed-won revenue, and both of them worked evenings and weekends. Leadership read this as a talent story. It was actually a process story. When the two top reps were asked to narrate their last five deals step by step, four of the five followed a near-identical sequence: a technical validation call before pricing was ever discussed, a mutual action plan sent within 48 hours, and a scheduled check-in with the economic buyer at the midpoint. None of that was documented anywhere. Once it was written down and added to the CRM as required stages, the other six reps' close rates moved within two quarters. The heroics had been real. They were also, once observed closely, a process nobody had bothered to name.
The reverse example matters too. A different org tried to process-ify everything at once — 14 new required fields, a rebuilt stage taxonomy, mandatory mutual action plans on every deal regardless of size. Reps routed around it within a month, logging fake data to clear the gates. The lesson: process that ignores the variance it is supposed to absorb becomes theater. The quote card's claim holds only when the process is built from observed reality rather than imposed from a template.

How to decide between them
The decision is not "should we have process." It is "which situations deserve a documented path, and which deserve to be escalated to a human." A workable rule: if a situation has occurred three or more times in the last two quarters, it earns a process. If it has occurred once and is unlikely to recur in the same shape, it earns a hero — and then a short write-up of what the hero actually did.
Two things about this flow are easy to get wrong. First, the "3+ times" threshold is a starting heuristic, not a law — a team handling 20 deals a quarter should set it lower than a team handling 400, because the absolute count matters less than whether the pattern is stable enough to codify. Second, the loop back from "interview the people routing around it" is the step most teams skip. If adoption is under 80 percent, the process is usually wrong in a specific, fixable way, and the people avoiding it know exactly what that way is. Asking them is cheaper than any change-management program.

There is also a sequencing question hidden in the diagram: do you build process top-down or bottom-up? Top-down process is faster to author and slower to adopt. Bottom-up process — where you observe what the best performers already do and write that down — is slower to author and much faster to adopt, because it describes behavior people already believe in. For a first process initiative, bottom-up almost always wins. For a compliance-driven requirement, top-down is the only option, and the adoption work has to be planned separately.
Concrete numbers behind each option
Numbers make the trade-off legible, and the ranges below are the ones practitioners typically see rather than precise benchmarks — treat them as planning assumptions, not guarantees.

Onboarding time. A rep joining a team with documented process typically reaches full quota attainment in three to five months. On a team where the motion lives in two people's heads, that stretches to six to nine months, and sometimes never happens for hires who do not happen to sit near the right person. The gap is roughly a full quarter of productivity per hire. On a ten-person team hiring four reps a year, that is four quarters of lost capacity — the equivalent of one full-time rep, gone.
Ramp variance. Process-driven teams show a narrower spread between their top and bottom performers. A common pattern is top performers at 130 to 150 percent of quota and bottom performers at 70 to 85 percent. Heroics-driven teams often show a wider spread — top performers at 200 percent or more, bottom performers at 40 to 60 percent. The average can look identical while the risk profile is completely different. Wide spreads are fragile: lose one hero and the number collapses.
Forecast accuracy. Teams with defined stage exit criteria typically forecast within 10 to 15 percent of actuals. Teams that forecast on rep sentiment and relationship strength often miss by 25 to 40 percent, and the misses cluster in the same direction — optimistic. Forecast error is expensive in ways that do not show up on the revenue line: over-hiring, over-spending on programs, and board credibility.

Cost per rescue. Every heroic intervention has a cost, even when it works. A senior leader spending four hours unblocking a deal is four hours not spent on hiring, strategy, or coaching. If that happens twice a week across a leadership team of five, that is roughly 40 hours a month — a full week of leadership capacity — consumed by exception handling. That number is almost never tracked, which is exactly why it grows.
Time to first documented process. A team starting from zero can usually document its three highest-leverage sequences — qualification, handoff, and renewal — in two to three weeks of part-time effort. The constraint is not writing; it is getting the best performers to articulate what they actually do, which requires watching real calls and real deals rather than asking people to describe their own habits from memory.

Adoption curve. New process typically hits 50 percent adoption in the first month, plateaus there for four to eight weeks, then either climbs past 80 percent or collapses back under 30. The plateau is the decision point. What moves teams through it is almost always removing a step, not adding training.
The comparison also extends upstream and downstream of the revenue team. Upstream, product and marketing feel it: a team with process can absorb a new product launch or a repositioning in weeks, because the change lands in a document rather than in twenty people's heads. Downstream, customer success and finance feel it: predictable handoffs mean fewer surprise churns and cleaner revenue recognition. Adjacent functions — support, implementation, even recruiting — run the same trade-off, which is why the quote travels well beyond sales.

Implementation details and sequencing
Turning the quote into an operating change follows a predictable sequence, and the order matters more than the speed.
Start by picking one motion, not five. The highest-leverage first candidate is usually the one with the most repetitions and the most variance — often lead-to-meeting conversion or the post-demo follow-up. Document it by shadowing the two or three people who do it best, capturing the actual steps, the actual timing, and the actual artifacts they produce. Write it in plain language at the level of "send the mutual action plan within 48 hours," not "drive urgency."

Then instrument it. A process with no measurement decays within a quarter. Pick two or three signals — stage conversion rate, time-in-stage, and one quality marker — and put them somewhere the team sees weekly. Do not build a 20-metric dashboard; nobody reads it, and it invites arguments about definitions instead of behavior.
Pilot before rollout. Three to five people, one quarter, measured against the baseline you captured before you started. If the pilot does not beat the baseline, the process is wrong — revise it rather than pushing it wider. This is the single most-skipped step and the most common reason process initiatives die: a bad process rolled out to everyone teaches the whole team that process does not work.
Once a motion is live, protect it. The most common failure is a quarter where the team misses plan, leadership reverts to heroics, and the process quietly stops being followed. The counter is to make the process the thing that gets reviewed, not the thing that gets abandoned. If the process is being followed and the number is still short, the problem is upstream — targeting, pricing, product — and reverting to heroics will hide it rather than fix it.

Finally, plan for the heroics you still want. Keep an explicit escalation path with a named owner and a timebox, and require a five-day debrief after any escalation. The debrief is where heroics convert into process. Without it, you get the same rescue every quarter and a team that believes the only way to win is to work harder.
Sequencing across a full year, a realistic shape is: quarter one, document and pilot one motion; quarter two, roll it out and start a second; quarter three, review both and retire the workarounds; quarter four, extend to an adjacent function like onboarding or renewal. Teams that try to do all four in one quarter usually end up with four documents and no behavior change.
Related questions
What does "Process scales. Heroics don't." actually mean?
It means repeatable systems add capacity as headcount grows, while individual rescue efforts stay capped at the number of hours one person can work. The quote is an argument for documenting what already works, not a criticism of people who work hard.
Is this banner free to download and use?
Yes — it is offered as a free PNG download on this page. You can drop it into internal channels, slide decks, or onboarding docs without attribution, though checking your organization's brand guidelines before external use is sensible.
Does this apply outside sales teams?
Yes. Support, implementation, recruiting, and finance all run the same trade-off between documented steps and individual rescues. The quote travels well because the underlying dynamic — variance living in the system versus variance living in a person — is universal.
How do I know if my team is too heroics-dependent?
Look for lopsided performance distribution, forecast misses clustered in one direction, and the same escalations recurring quarter after quarter. If two people produce most of the output and both work unusual hours, you are heroics-dependent.
Won't process slow us down?
Bad process does. Good process — built from what your best people already do — usually speeds things up, because it removes the re-deciding that happens on every deal. The test is whether the steps describe observed behavior or imposed theory.
FAQ
What exactly is on this banner?
A 1600x500 pixel quote card carrying the line "Process scales. Heroics don't." in bold type against a dark background. It is a single-message graphic — no charts, no logos, no secondary text — designed to be readable at thumbnail size in a feed or a slide.
Where should I use it?
Internal team channels, all-hands decks, onboarding packets, and sales kickoff slides are the natural fits. It works best as a discussion prompt before a process review, not as a standalone motivational poster. In external settings, use it only if your brand voice tolerates blunt statements.
When does the message backfire?
It backfires when it is used to dismiss genuine effort, or when leadership posts it while the team is drowning in undocumented work. If the people reading it are the ones currently firefighting, the quote reads as blame rather than direction. Pair it with a concrete commitment to fix one process.
Can I customize the wording or colors?
Yes. The line can be adapted to your team's language — some teams swap "Process" for "Systems" or "Playbooks" — and the color palette can be matched to your brand. Keep the sentence short; the quote's power comes from its brevity, and longer variants lose the punch.
What file format and dimensions does it come in?
A PNG at 1600x500 pixels, which fits LinkedIn banner proportions and scales cleanly into slide decks. PNG is used rather than JPEG so the text edges stay sharp. Swapping it in is a simple file replacement wherever you host your internal graphics.
How do I turn the quote into an actual change?
Pick one recurring motion, shadow your best performers, write down what they do, pilot it with three to five people, and measure against a baseline. Then review it monthly. The quote is the argument; the pilot is the proof.
Sources
- Harvard Business Review — The Hidden Traps in Decision Making
- Harvard Business Review — Why Strategy Execution Unravels
- McKinsey & Company — The Keys to a Successful Process Transformation
- Salesforce — State of Sales Report
- Gartner — Sales Operations and Process Research
- Atlassian — Team Playbook: Documenting Repeatable Processes
- HubSpot — Sales Process Guide
- Project Management Institute — Process Groups and Knowledge Areas
Related on PULSE
- Building a sales process your team actually follows
- Forecasting accuracy when your pipeline is lopsided
- Onboarding new reps without relying on shadowing
- When to escalate versus when to document
- Retiring the workarounds your team quietly depends on
- Turning a one-off rescue into a repeatable playbook
This page will be disappearing soon. Save it to your device for $1 — or read it free while it is here.
@Kory-White- · if Venmo asks, the last 4 of my number are 2012
This page is gone.
This one is off the shelf now. $1 keeps it on your phone for good — the whole page, pictures and diagrams included.
 graphic“The next call is the most important one.” — Quote Card
 graphic“Champions sell when you're not in the room.” — Quote Card
 graphic“Discovery is the deal.” — Quote Card
 graphic“The best discovery feels like free therapy.” — Quote Card
 graphic“Don't pitch. Diagnose.” — Quote Card
 graphic“Sell the meeting, not the demo.” — Quote Card
 graphic“Win the week. The quarter wins itself.” — Quote Card
 graphic“Every no is closer to a yes.” — Quote Card
 graphic“Ask better questions.” — Quote Card
 graphic“People buy outcomes, not features.” — Quote Card