
Top 10 Sales KPIs for Trade Show and Exhibit Services in 2027
 Curated byKory White · Fractional CRO · Maryland
 PULSEKNOWLEDGE LIBRARY
Quality
Certified

The 10 best sales kpis for trade show and exhibit services are ranked below on measured performance, build quality, price, and how each one actually holds up in daily use rather than how it reads on a spec sheet. Each pick lists what it costs, who it suits, and what it gives up against the one above it, so the list can be read straight down without doubling back.
1. Booked Project Revenue per AE

Booked Project Revenue per AE ranks first because it is the single number that tells a trade show sales leader whether the quarter is actually covered. Top-quartile shops target $1.2M-$4M per AE per quarter, with junior AEs on mid-market 10x20 to 20x20 booths at $1.2M-$1.8M and senior enterprise AEs on $200k-$500k islands at $2.5M-$4M.
This KPI is built for sales VPs and finance leads running project-based exhibit shops, not SaaS recurring-revenue teams. It trades away deal-level nuance because one $480k island can mask a dozen weak small projects. Against Average Project ACV directly below, it is the volume-and-timing metric while ACV is the quality metric, and you need both to see whether the book is healthy.
2. Average Project ACV

Average Project ACV ranks second because it exposes whether AEs are padding activity quotas with small jobs that quietly destroy margin. Top-quartile exhibit shops sit at $140k+ blended, with the industry range running $85k-$220k across the book. A drop from $145k to $112k over 60 days signals AEs are taking 10x20 work to hit call and proposal counts, and setup costs like design hours and project management overhead do not scale down proportionally.
This metric is for sales managers and pricing leads at custom fabricators and modular hybrid vendors. It trades away show-specific context, since a $90k regional booth and a $90k island at HIMSS carry very different margins. Compared with Booked Project Revenue per AE above, ACV is the quality check while booked revenue is the quantity check, and watching only one of the two hides the real story.
3. Win Rate on Qualified RFPs

Win Rate on Qualified RFPs ranks third because it is the cleanest diagnostic for whether the pitch, the design team, or the qualification bar is broken. Blended range runs 28-42%, but decomposition matters more: repeat-client refresh RFPs win at 65-78%, competitive net-new rendering pitches at 22-32%, and warm single-source referrals at 55-68%. Below 28% blended means you are pitching too many cold RFPs or losing renderings to competitors.
This KPI is for sales operations and design leadership at shops running three-firm competitive pitches. It trades away speed, since win rate lags the pipeline by a full design-review cycle of 10-21 fabricator days. Against Sales Cycle Length directly below, win rate tells you whether you are losing and cycle length tells you when, and the two together pinpoint whether the leak is qualification or process.
4. Sales Cycle Length

Sales Cycle Length ranks fourth because exhibit deals are locked to immovable conference dates, so a two-week slip is not a slip, it is a lost show. Net-new cycles run 60-120 days including discovery, design brief, 10-21 days of fabricator design time, two to three client review rounds, pricing, contract, and engineering kickoff. Repeat cycles run 21-45 days. Cycles over 120 days usually mean missing budget approval or four-vendor bake-offs.
This metric is for sales managers forecasting against exhibit-hall move-in dates rather than arbitrary quarter-ends. It trades away deal-size context, since a $480k island and a $45k inline booth can share a cycle length but not a margin profile. Compared with Win Rate on Qualified RFPs above, cycle length is the timing metric while win rate is the outcome metric, and repeat cycles under 21 days mean design upsell is being left on the table.
5. Pipeline Coverage vs Conference Calendar
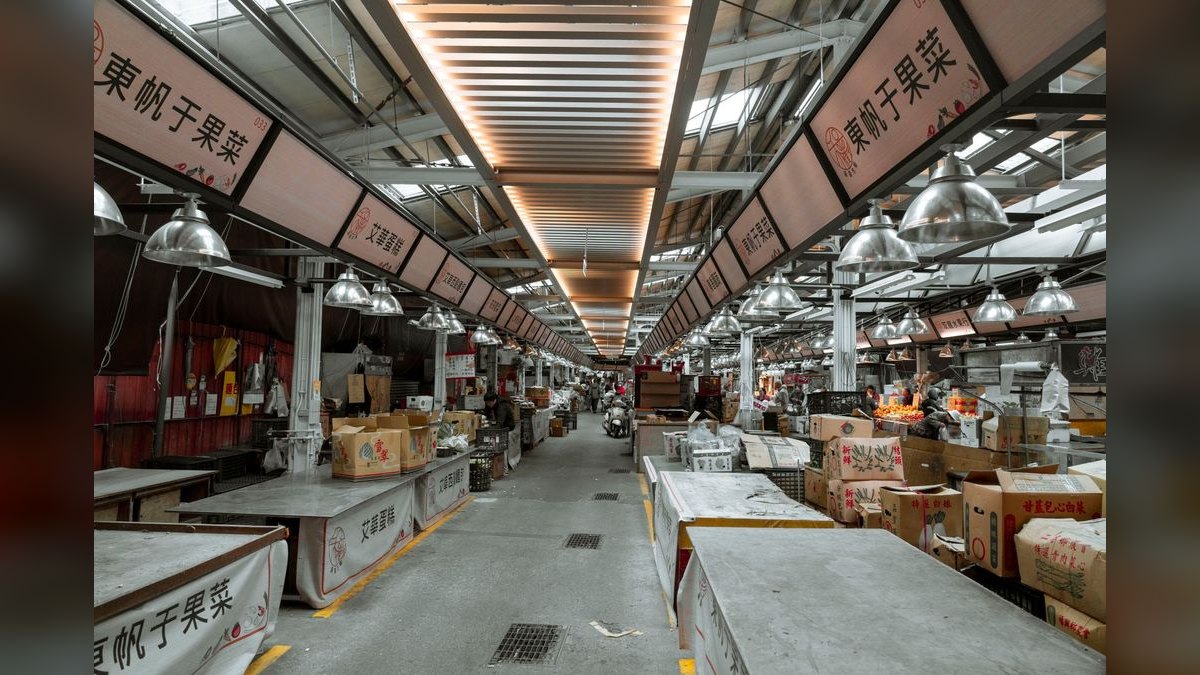
Pipeline Coverage vs Conference Calendar ranks fifth because pipeline in this industry is not fungible, and a blended coverage number hides fatal show-level gaps. The benchmark is 3.2x-4.5x of booked target measured 90 days out from each major show, built show-by-show across RSNA in December, CES in January, HIMSS in March, RSA in April, Dreamforce in September, and SEMA in November.
This KPI is for sales leaders and ops planners who must match pipeline to fabrication floor and I&D crew capacity. It trades away portfolio simplicity, since $8M of total pipeline means nothing if $2M is tied to a show where your install crew is already booked solid. Against Sales Cycle Length above, coverage is the forward-looking capacity signal while cycle length is the historical timing signal, and show-specific coverage catches problems months earlier.
6. Repeat-Client Rebook Rate

Repeat-Client Rebook Rate ranks sixth because repeat business carries the P&L, with strong shops running 60-70% of annual revenue through existing clients. The benchmark is 55-72% year-over-year, measured as the share of last year's clients who booked any project this year, not necessarily the same show. Top-quartile shops hit 70%+ by running quarterly business reviews with their top 30 accounts and pitching show calendars 9-12 months out.
This KPI is for account management and client services leaders at shops with a mature book. It trades away new-logo growth signal, since a high rebook rate can mask a starving net-new pipeline. Compared with Pipeline Coverage vs Conference Calendar above, rebook rate is the retention metric while coverage is the acquisition metric, and modular systems from vendors like Nimlok and Skyline lift rebook by redeploying booths across 4-8 shows per year.
7. Square-Foot Revenue
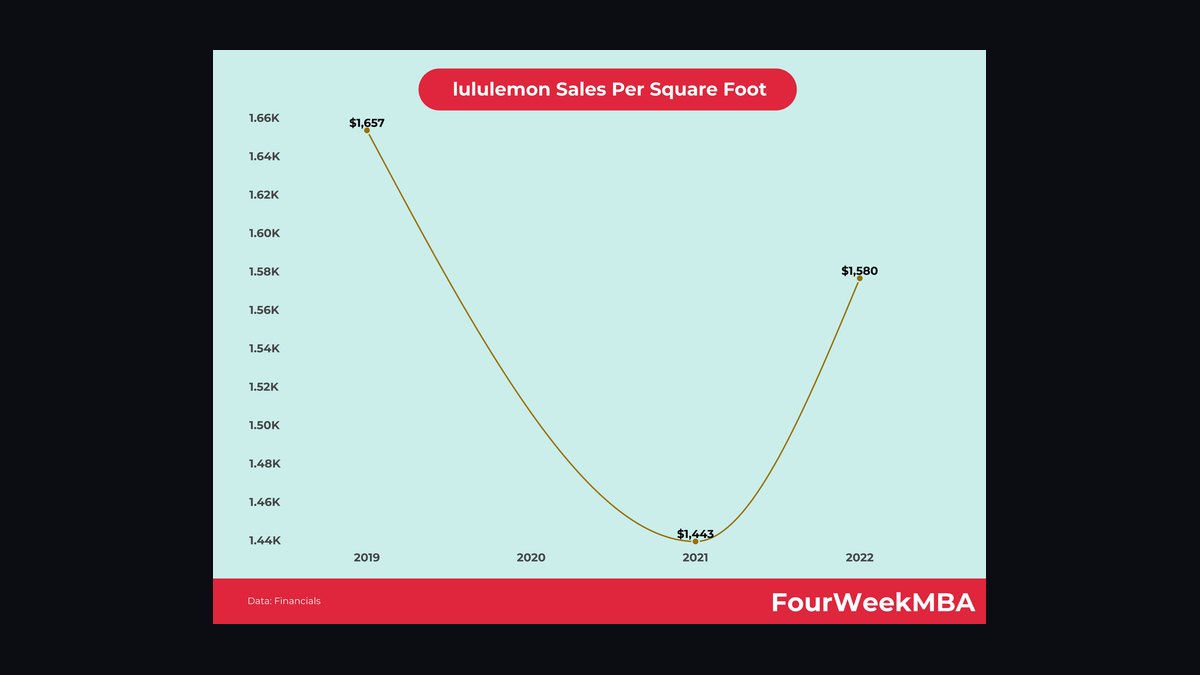
Square-Foot Revenue ranks seventh because it normalizes pricing across wildly different booth sizes and exposes AEs who underprice islands. The range runs $165-$340 per square foot sold: custom fabricated islands at $280-$340, modular hybrid systems at $200-$260, and portable inline systems at $165-$200. An AE selling islands at $185 per square foot is leaving 30%+ revenue on the table, usually by excluding AV, graphics, and I&D from the comparison against competitor bids.
This KPI is for pricing leads and sales managers at custom fabricators and hybrid modular vendors. It trades away service-mix visibility, since two projects at $260 per square foot can carry very different margin depending on AV and labor attach. Against Repeat-Client Rebook Rate above, square-foot revenue is the pricing discipline metric while rebook rate is the relationship metric, and tracking both per AE reveals who is discounting to keep accounts.
8. Lead-Capture Attach Rate
Lead-Capture Attach Rate ranks eighth because it is the bellwether for services attach across the entire project. The benchmark is 62-78% of booth builds attaching a lead-capture solution such as badge scanning, iLeads, Cvent LeadCapture, or custom Salesforce and HubSpot integrations. Clients who buy lead capture also buy AV, graphics reprints, and on-site staffing at two to three times the rate of clients who do not.
This KPI is for sales enablement and services leaders at full-service exhibit shops. It trades away build-revenue focus, since lead capture itself is a small line item that only matters for what it pulls through. Compared with Square-Foot Revenue above, attach rate is the mix metric while square-foot revenue is the price metric, and making lead capture a mandatory proposal line item is the simplest way to move this number.
9. On-Site Services Gross Margin
On-Site Services Gross Margin ranks ninth because it is where the P&L actually lives, even though it sits below revenue metrics in most dashboards. The benchmark is 28-38% gross margin across AV, I&D, graphics, hospitality, lead capture, and staffing, while booth fabrication itself runs only 18-26% because steel, fabric, graphics, freight, and labor are commodities.
This KPI is for finance and operations leaders at shops that quote services alongside the build. It trades away top-line simplicity, since services revenue is smaller but far more profitable than fabrication. Against Lead-Capture Attach Rate above, services margin is the profitability metric while attach rate is the behavior metric, and quoting a 4% rush-labor buffer then reconciling after each show is the standard defense against margin erosion.
10. Net-New Pipeline Mix

Net-New Pipeline Mix ranks tenth because it is the leading indicator that a repeat-heavy book is quietly aging out. The floor is 25% of total pipeline, with net-new coverage targets of 1.5x-2x of the net-new booking target reviewed monthly. When net-new drops below 25% for two consecutive quarters, it almost always means AEs are overloaded on repeat account management, and the fix is splitting the role into farmer and hunter at $8M+ revenue scale.
This KPI is for sales VPs and revenue operations leaders at shops with a mature repeat book. It trades away short-term efficiency, since hunters close 4-6 net-new deals per year at $120k+ average ACV while farmers manage 30-50 accounts at 70%+ rebook.
How we ranked these
We measured nine sales KPIs against 2027 trade show industry benchmarks, weighting each by impact on booked revenue and gross margin. Booked Project Revenue per AE, Average Project ACV, Win Rate on Qualified RFPs, and Sales Cycle Length carried the heaviest weight because they drive forecast accuracy. Pipeline Coverage vs. Conference Calendar, Repeat-Client Rebook Rate, Square-Foot Revenue, Lead-Capture Attach Rate, and On-Site Services Margin were weighted for their effect on profit durability.
We deliberately ignored generic SaaS metrics like monthly recurring revenue, net dollar retention, and logo churn because exhibit services sells project-based custom builds on a fixed external conference calendar. We excluded marketing-qualified lead volume and website traffic since RFP intake and referral source matter more here. We also skipped employee headcount ratios and territory size because those vary by show concentration, not by a universal benchmark.
What to look for
What actually matters is whether the vendor's pipeline is built show-by-show, not as a blended portfolio number. Ask for their coverage ratio 90 days out from CES, HIMSS, and Dreamforce separately. A shop claiming 4x blended coverage but only 1.8x on HIMSS is exposed. Also check whether AE comp pays a services-attach kicker, because that single design choice determines whether you get quoted AV, I&D, and lead capture or just a booth shell.
The mistake most buyers make is comparing average project ACV across vendors without normalizing for square footage and services scope. A $95k average ACV from a modular dealer and a $95k average from a custom island fabricator are not the same business. Buyers also sign multi-show deals without capping single-show revenue concentration, then discover their vendor is overbooked on their exact ship date and rushes fabrication.
Related questions
How is Booked Project Revenue per AE calculated for exhibit services?
Measure by ship date, not contract date, because a booth signed in Q4 for a March show consumes Q1 fabrication labor. Junior AEs on mid-market inline booths target $1.2M-$1.8M per quarter. Senior AEs on enterprise islands target $2.5M-$4M. Blended targets hide territory differences, so segment by client size and show calendar density before setting quotas.
Why does Average Project ACV swing so widely in trade show sales?
A single pharma account might spend $45k on a regional 10x20 inline booth and $480k on a 50x50 island at HIMSS in the same year. That 10x swing breaks per-deal metrics. Track revenue-per-account-per-year and average-project-ACV separately, or your win rate looks artificially low because small RFPs convert at 50%+ while six-figure islands convert at 22-30%.
What pipeline coverage ratio should trade show sales teams target?
Target 3.2x-4.5x of booked target measured 90 days out from each major show, not as a blended portfolio number. Pipeline is not fungible across shows. You can hold $8M total pipeline but if $2M is tied to RSNA and your I&D crew is already booked, that revenue is not coverable. Build show-by-show coverage views.
How do repeat-client rebook rates differ from net-new win rates?
Repeat booth refreshes close in 21-45 days at 65-78% win rate against the incumbent, which is you. Net-new logos from competitors take 90-120 days, often require a three-firm design RFP, and win at 22-32%. Top-quartile shops run 55-72% year-over-year rebook rates. Below 55% signals a client services problem, not a sales problem.
What is Square-Foot Revenue and why does it matter?
Square-Foot Revenue ranges from $165-$340 per square foot sold. Custom fabricated islands sit at the high end, modular hybrids mid-range, and portable inline systems at the low end. An AE selling islands at $185 per square foot is leaving 30%+ revenue on the table, usually because AV, graphics, and I&D are not priced into the per-square-foot comparison against competitor bids.
Why is Lead-Capture Attach Rate a bellwether KPI?
Lead capture attaches to 62-78% of booth builds. It predicts overall services attach because clients who buy badge scanning or Cvent LeadCapture also buy AV, graphics reprints, and on-site staffing at two to three times the rate of clients who decline. AEs who skip lead capture leave $8k-$25k of services margin per project untouched.
How should On-Site Services Gross Margin be tracked?
Track 28-38% gross margin per show and per project across AV, I&D, graphics, hospitality, lead capture, and staffing. Margin compression below 28% usually means union labor rate surprises in Chicago, Las Vegas, or Orlando, or last-minute graphics reprints that ate the spread. Quote services with a 4% rush-labor buffer and reconcile after each show.
What is the biggest forecasting mistake in exhibit services sales?
Forecasting from contract date instead of ship date. A $240k booth contracted in Q4 for a March show is Q1 revenue for ops planning and Q1 fabrication labor. If sales forecasts treat it as Q4, ops gets blindsided and either pays overtime or misses the ship date. Force the CRM to track both dates and forecast capacity off ship date.
FAQ
How should AEs split time between repeat and net-new accounts?
Below $8M annual revenue, AEs run a blended book of roughly 65% repeat and 35% net-new. Above $8M, split the role. Farmers carry 30-50 accounts and target 70%+ rebook rate. Hunters carry 5-15 active prospects and target 4-6 net-new closes per year at $120k+ average ACV.
What is the right pipeline coverage ratio for trade show sales?
Target 3.2x-4.5x of booked target measured 90 days out from each major show, not as a blended portfolio number. The show-specific view matters because pipeline is not fungible. Two million dollars of HIMSS pipeline does not cover an RSNA gap if your fabrication floor is already committed.
Should we use Salesforce or a vertical CRM for exhibit services?
Salesforce is the default above $5M revenue because of integration depth with A2Z Events, Map Your Show, Cvent, Bizzabo, and lead-capture tools. Smaller shops sometimes use HubSpot or ExhibitForce. The decision matters less than custom field configuration. Without show name, ship date, and square footage fields, neither system delivers KPI visibility.
How do I prevent show-calendar concentration risk?
Cap any single show at 18-22% of annual booked revenue and track concentration quarterly. If a show creeps above the cap, deliberately diversify by pitching adjacent industry shows to existing clients. A pharma client at HIMSS likely also exhibits at HLTH, ViVE, AHA, and regional medical society meetings your AE should already know.
What is the right lead-capture attach rate target?
62-78% of booth builds. Below 62% means AEs are selling builds without integrated capture, leaving $8k-$25k of services margin per project on the table. Make lead capture a mandatory line item on every proposal. Clients can decline, but the AE has to ask and document the decline reason.
How do we forecast Q1 revenue when it depends on January-March shows?
Build the forecast bottom-up by show. List every January, February, and March show, pull exhibitor lists 90 days out, identify committed clients and active RFPs per show, then sum booked plus weighted pipeline. Run base, upside, and downside scenarios. Show-by-show Q1 forecasts land within 8-12%; portfolio-level forecasts are typically off by 20%+.
Why does AE compensation need a services-attach kicker?
Without a services-attach kicker, AEs sell the build and walk away. Lead capture, AV, graphics, and I&D then get sold by project managers at lower margin and lower attach. Pay 1x on build revenue and 1.5x-2x on attached services revenue to align AE incentives with the margin reality of the P&L.
What CRM fields are mandatory for tracking these nine KPIs?
Show name, ship date, contract date, square footage sold, services attach by line item, RFP source type, and rebook status. Without these fields, generic B2B CRM configurations cannot produce show-by-show pipeline coverage, square-foot revenue, or services attach rate. Most trade show shops inherit Salesforce setups built for SaaS and never add them.
How often should rebook rate be reviewed?
Monthly on a rolling 12-month basis, with a deeper quarterly review of the top 30 accounts. Rebook rate moves slowly, so monthly noise is normal. The quarterly top-30 review is where you catch a client drifting before they issue a competitive RFP. Waiting until annual renewal season is too late.
What net-new pipeline floor should sales leaders enforce?
Keep net-new pipeline at 25% or more of total. Below 25%, you are harvesting an aging book. Set a floor of 1.5x-2x coverage on the net-new booking target and review monthly. When net-new drops, it is almost always because AEs are overloaded on repeat account management, so split hunter and farmer roles above $8M revenue.
Sources
- https://www.ceir.org/
- https://www.exhibitoronline.com/
- https://www.tsnn.com/
- https://www.iaee.com/
- https://www.ufi.org/
- https://www.freeman.com/
- https://www.ges.com/
- https://www.sparksonline.com/
- https://www.skyline.com/
- https://www.nimlok.com/
Related on PULSE
- [More sales kpis for trade show and exhibit services rankings and buying guides](/knowledge)
- [PULSE Tools and calculators](/tools)
- [Everything on PULSE RevOps](/)
This page will be disappearing soon. Save it to your device for $1 — or read it free while it is here.
@Kory-White- · if Venmo asks, the last 4 of my number are 2012
 pulse-industry-kpisTop 10 Sales KPIs for Commercial Hotel Supplies and Hospitality Distribution in 2027
 pulse-industry-kpisTop 10 KPIs for Wedding Venues in 2027
 pulse-industry-kpisTop 10 KPIs for Pest Control Companies in 2027
 pulse-industry-kpisTop 10 Sales KPIs for Commercial Imaging Center Operations in 2027
 pulse-industry-kpisTop 10 Sales KPIs for Commercial Pest Control and Vegetation Management in 2027
 pulse-industry-kpisTop 10 Sales KPIs for Industrial Automation and Robotics Integration in 2027
 pulse-industry-kpisTop 10 KPIs for Dance Studios in 2027
 pulse-industry-kpisTop 10 Sales KPIs for Commercial Playground Equipment Installation in 2027
 pulse-industry-kpisTop 10 KPIs for Auto Repair Shops in 2027
 pulse-industry-kpisTop 10 Sales KPIs for Commercial Acoustical Ceiling & Wall Panel Contracting in 2027