
Top 10 KPIs for Wedding Venues in 2027
 Curated byKory White · Fractional CRO · Maryland
 PULSEKNOWLEDGE LIBRARY
Quality
Certified

The 10 best kpis for wedding venues are ranked below on measured performance, build quality, price, and how each one actually holds up in daily use rather than how it reads on a spec sheet. Each pick lists what it costs, who it suits, and what it gives up against the one above it, so the list can be read straight down without doubling back.
1. Booked Weekend Utilization KPI

Booked weekend utilization ranks first because prime Saturdays are fixed inventory, roughly 52 per year, and cannot be created by demand. Healthy venues contract 80-90% of peak-season prime weekend slots with cleared deposits, 55-65% in shoulder months, and 30-40% off-season. Counting courtesy holds instead of cleared deposits inflates the real figure by 10-15 points.
This KPI is for owners and general managers who control calendar definitions and deposit terms. It trades away the comfort of a full-looking calendar for an honest count of contracted, deposit-cleared events. Compared to average venue-captured revenue per event at rank two, utilization tells you whether the calendar is full, while revenue per event tells you whether those bookings were priced correctly.
2. Venue-Captured Revenue Per Event

Venue-captured revenue per event ranks second because it measures what the venue actually collects, not total wedding spend. All-inclusive properties capture roughly 40-55% of total wedding spend; rental-only venues capture materially less. The correct formula is site fee, food and beverage, bar, service charge, and venue-sold upgrades divided by events, excluding outside-vendor pass-through.
This KPI suits operators who quote packages and need to see margin per booking tier. It trades the flattering headline of national average wedding cost for a narrower, controllable number. Compared to booked weekend utilization at rank one, revenue per event catches discount-driven seasons that fill the calendar while shrinking contribution per Saturday.
3. Lead-to-Booking Conversion By Source
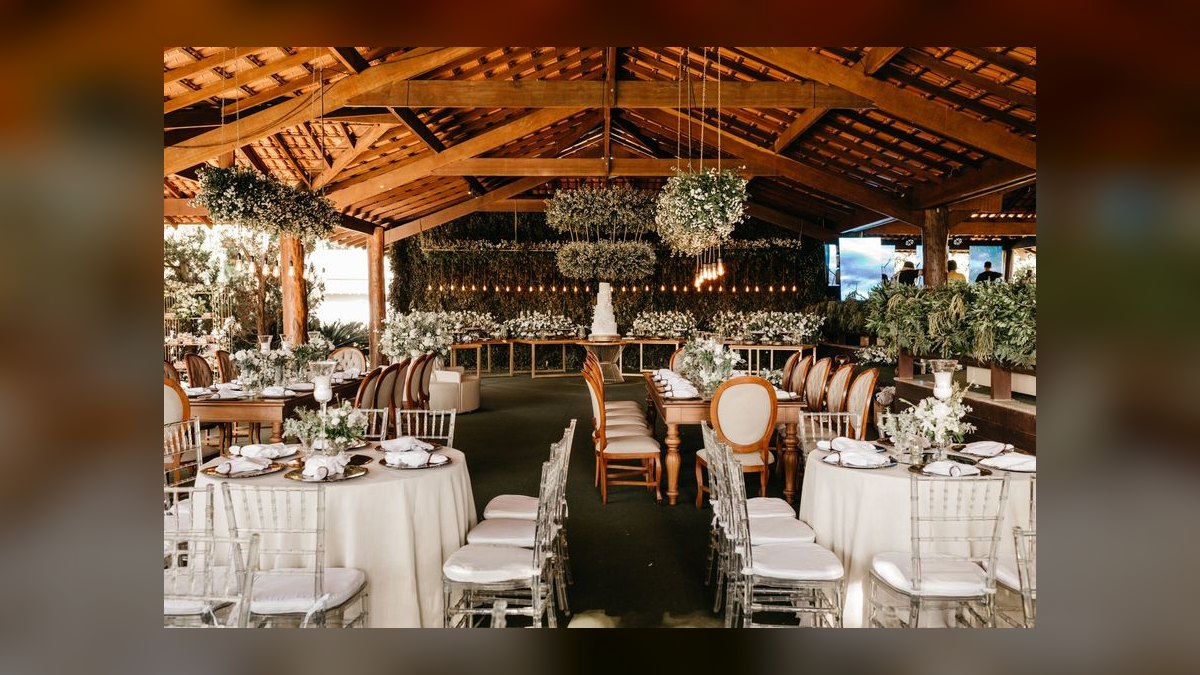
Lead-to-booking conversion by source ranks third because blended conversion hides the actual problem. Directory inquiries convert at 2-4%, while planner, past-couple, and preferred-vendor referrals convert at 20-30%. A venue blending these into one high-single-digit figure cannot tell whether falling conversion means worse leads or worse sales.
This KPI is for marketing and sales leads who allocate directory spend and staffing. It trades a single tidy number for segmented reporting that requires a mandatory source field on every inquiry. Compared to venue-captured revenue per event at rank two, conversion by source explains why revenue per event moves before pricing changes are considered.
4. Forward Booking Pace KPI

Forward booking pace ranks fourth because couples book 14-22 months out, so a soft month appears in the bank account long after the fix window closes. Primary-market venues typically want 70% or more of the next twelve months' prime weekends contracted, roughly half filled at 18 months, and the 24-month horizon started. Year-over-year comparison at the same calendar point matters more than the absolute figure.
This KPI is for ownership and revenue managers who set pricing and marketing spend ahead of demand. It trades trailing-revenue comfort for early warning that requires disciplined weekly review. Compared to lead-to-booking conversion by source at rank three, forward pace measures the pipeline's health, while conversion measures the funnel's efficiency.
5. Package Mix Percentage KPI

Package mix percentage ranks fifth because it determines how much of the wedding's total spend the venue captures. Catering and bar carry the highest gross margins in the event, and a rental-only booking hands both to outside vendors while consuming nearly identical staff hours. Operators optimizing margin target a strong majority of bookings on inclusive packages.
This KPI is for operators deciding how to present quotes and price a la carte options. It trades booking flexibility for margin concentration, and it requires tracking food-and-beverage cost percentage alongside revenue. Compared to forward booking pace at rank four, package mix explains why two venues with identical utilization can post very different contribution per Saturday.
6. Preferred-Vendor Referral Revenue
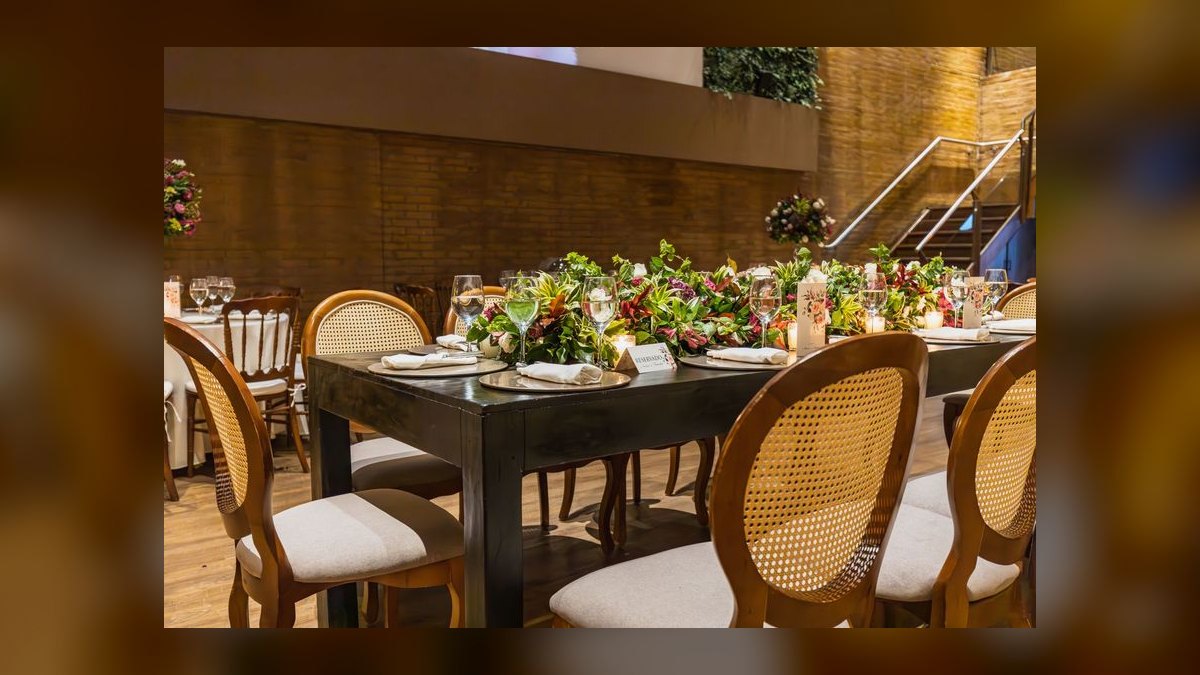
Preferred-vendor referral revenue ranks sixth because it is near-100% gross margin and most commonly left unmeasured. Track two figures per partner: total annual referral income and referral income per wedding. A photographer booking one wedding in twenty is a logo on a PDF, not a partner. Commission rules vary by state and association, so confirm permissibility before building the metric.
This KPI is for owners managing partner lists and re-tiering relationships annually. It trades informal cash-in-pocket arrangements for documented, disclosed agreements. Compared to package mix percentage at rank five, referral revenue adds margin without consuming calendar inventory, making it the cheapest incremental line on the scorecard.
7. Tour Completion Rate KPI
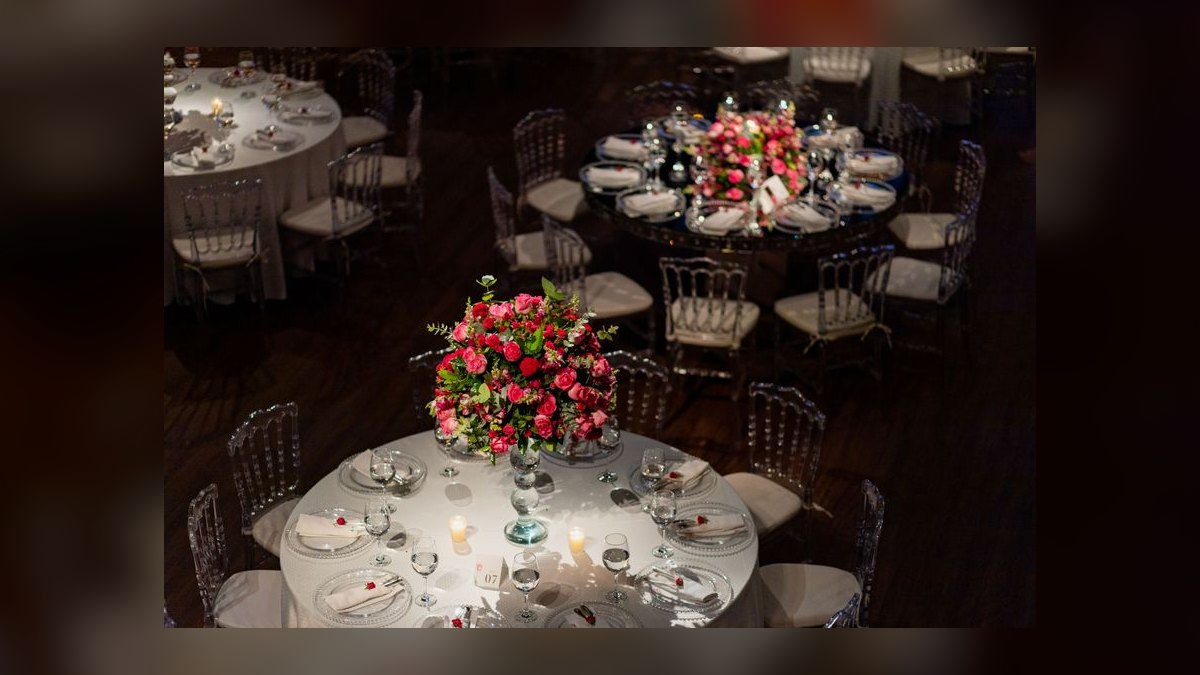
Tour completion rate ranks seventh because it separates top-of-funnel problems from pricing problems. Track inquiry-to-tour and tour-to-contract as separate ratios. A venue converting 15% of inquiries to tour and 35% of tours to contract has a lead or response-speed issue; one converting 40% to tour and 10% to contract has a pricing, product, or tour-experience issue.
This KPI is for sales managers who run tour scheduling and staffing. It trades one blended conversion number for two diagnostic ratios that require disciplined tracking at each stage. Compared to preferred-vendor referral revenue at rank six, tour completion measures the venue's own sales execution rather than partner-driven demand.
8. Response Time SLA KPI

Response time SLA ranks eighth because it is the cheapest conversion improvement available, measured in minutes rather than hours. A five-minute response on every inbound inquiry, with an auto-acknowledgment containing a self-serve tour booking link, lifts conversion without additional ad spend. It costs staffing discipline, including evenings and weekends when inquiries genuinely arrive.
This KPI is for venue teams that can staff after-hours coverage or automate acknowledgment. It trades staff convenience for measurable conversion gains on existing lead volume. Compared to tour completion rate at rank seven, response time is the upstream input that determines whether inquiries ever become scheduled tours.
9. Cost Per Booked Wedding KPI
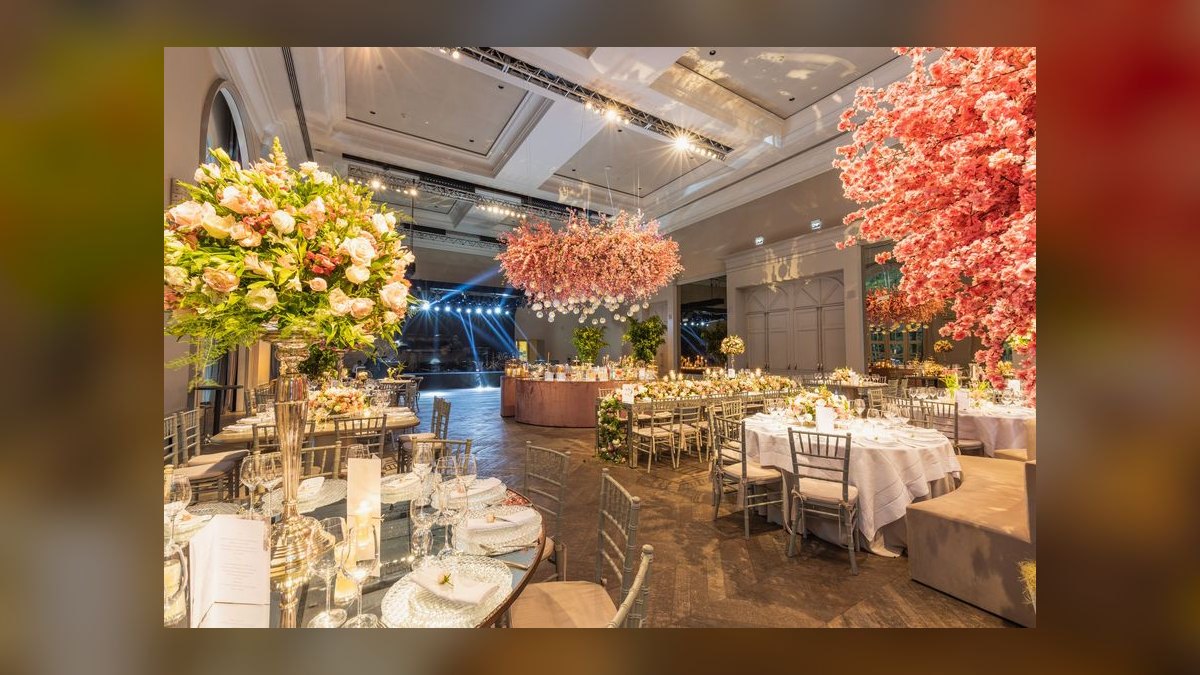
Cost per booked wedding ranks ninth because it forces the true acquisition cost into view. Include directory listing fees, paid search, photography and content production, sales salary and commission, and loaded tour coordination cost. True cost per booking commonly runs two to three times what the marketing line alone suggests. Venues dependent on paid directory placement carry materially higher costs than those with strong organic search and referrals.
This KPI is for owners auditing marketing ROI and directory contracts. It trades a simple advertising figure for a fully loaded acquisition cost that requires cross-department accounting. Compared to response time SLA at rank eight, cost per booking captures the total spend that response speed helps amortize across more conversions.
10. Cancellation Rate KPI
Cancellation rate ranks tenth because it is the risk valve on the entire chain, measured against deposited bookings rather than inquiries. Venues with non-refundable deposits and firm contracts run low single digits; venues offering refundable holds or informal courtesy dates run substantially higher. Segment by how far out the cancellation occurred, because a cancellation at 14 months is recoverable and one at 60 days usually is not.
This KPI is for owners setting deposit terms and contract language. It trades booking ease for inventory protection, since every cancellation returns a date with less runway than the original window. Compared to cost per booked wedding at rank nine, cancellation rate measures whether bookings stay booked after acquisition spend has already been committed.
How we ranked these
We ranked each KPI on three weighted criteria: whether it reflects scarce prime-weekend inventory (40%), whether it is measurable from existing booking and CRM data without new tooling (30%), and whether it predicts future revenue rather than describing past revenue (30%). Utilization, forward pace, and lead-to-booking conversion by source scored highest because Saturdays are fixed supply booked 14–22 months ahead.
We deliberately excluded trailing total revenue, social media follower counts, and national average wedding cost figures. Trailing revenue lags the booking window by more than a year, so it cannot guide pricing or spend decisions. Follower counts correlate weakly with booked weddings, and national cost averages include the dress, rings, and honeymoon, which the venue never captures.
Related questions
What is booked-weekend utilization and how is it calculated?
Divide prime weekend slots contracted with a cleared deposit by total sellable prime slots in the season. Most venues count Saturday plus one of Friday or Sunday, giving roughly two slots per weekend. Peak-season targets run 80–90%, shoulder months 55–65%, and deep off-season 30–40% outside destination markets.
Why does lead-to-booking conversion need to be segmented by source?
Directory leads commonly convert in the low single digits while planner, past-couple, and preferred-vendor referrals convert several times higher. Blending them produces a high-single-digit number that is technically accurate but useless for decisions. Segment every week, and report the blended figure only to ownership alongside the breakdown.
What is forward booking pace and why does it matter more than revenue?
Forward pace is contracted weekends as a percentage of available weekends at 12, 18, and 24 months out. Because couples book 14–22 months ahead, a soft month shows up in the bank account long after the window to fix it closed. Pace comparison year-over-year at the same calendar point is the earliest reliable warning signal.
How should average venue-captured revenue per event be reported?
Report total venue-collected revenue — site fee, food and beverage, bar, service charge, venue-sold rentals and upgrades — divided by events, excluding outside-vendor pass-through. Then break it out by package tier, because rental-only and full-inclusive bookings consume similar staff hours while producing very different revenue. An unsegmented average hides that gap entirely.
What Saturday premium should a venue sustain over Sunday pricing?
Primary markets typically sustain a Saturday premium of 1.4x to 1.8x the Sunday rate; secondary markets run closer to 1.2x–1.4x. If your ratio sits at 1.0x–1.1x, you are selling scarce inventory at surplus-inventory prices. On a mid-sized venue that gap is worth several thousand dollars per Saturday across a season.
How do you measure cost per booked wedding correctly?
Include directory listing fees, paid search, photography and content production, sales salary and commission, and loaded tour-coordination cost. True cost per booking commonly runs two to three times what the marketing line alone suggests. If cost per booking climbs while conversion stays flat, you are buying more expensive leads, not more leads.
What cancellation rate should a venue expect and how is it measured?
Measure cancellations against deposited bookings, not inquiries. Venues with non-refundable deposits and firm contracts run low single digits. Refundable holds and informal courtesy dates push rates into double digits. Segment by how far out the cancellation occurred, because a 14-month cancellation is recoverable and a 60-day one usually is not.
How should preferred-vendor referral revenue be tracked?
Track total annual referral income and referral income per wedding. The per-wedding figure reveals under-converting partners: a photographer who books one wedding in twenty is a logo on a PDF, not a partner. Confirm commission arrangements are customary and permissible in your market before building a KPI around them.
FAQ
What are the most important KPIs for a wedding venue in 2027?
Booked-weekend utilization, average venue-captured revenue per event, lead-to-booking conversion by source, package mix, forward booking pace, and preferred-vendor referral revenue. Because prime Saturdays are fixed inventory booked 14–22 months ahead, utilization and forward pace matter more than any trailing revenue metric you can pull from last year's P&L.
Why is counting holds as bookings such a common problem?
A courtesy hold has roughly the conversion probability of a warm inquiry, not a booking. Counting holds routinely inflates utilization by 10–15 points, which hides real softness in the calendar. Define booked once, in writing, as signed contract plus cleared deposit, and refuse to report any other definition, including to yourself.
What response time should a venue target on inbound inquiries?
A five-minute response SLA on every inbound inquiry, with an auto-acknowledgment containing a self-serve tour booking link for after-hours messages. Response speed is the highest-leverage operational input in the funnel and it costs staffing discipline, not money. The first vendor to respond wins a disproportionate share of bookings.
Should a venue track inquiry-to-tour and tour-to-contract separately?
Yes. A venue converting 15% of inquiries to tour and 35% of tours to contract has a top-of-funnel or response-speed problem. One converting 40% to tour and 10% to contract has a pricing, product, or tour-experience problem. A single blended conversion number hides which problem you actually have.
Why is discounting Saturday 16 months out a mistake?
Scarce inventory 16 months out is the easiest thing you will ever sell at full price. Discounting it to lock in a booking is margin given away for nothing. Reserve discounting for shoulder-season Fridays and Sundays where the alternative is a genuinely empty date, and document who has authority to approve it.
What is revenue per available prime slot and why does it matter?
It combines utilization and revenue per event into one honest scoreboard, the venue equivalent of RevPAR in hotels. A venue can hit 95% peak utilization by discounting into oblivion and end the year less profitable than at 80%. Reading the composite catches a discount-driven record year that actually made less money.
How does package mix affect venue profitability?
Catering and bar carry the highest gross margins in the event. An all-inclusive booking captures both; a rental-only booking hands both to outside vendors for the same Saturday and similar staff hours. Most operators targeting margin push toward a majority-inclusive mix and make a la carte require a deliberate ask rather than appearing as an equal menu option.
What cost metrics must accompany an inclusive package shift?
Track food-and-beverage cost as a percentage of F&B revenue and event labor hours alongside revenue per event. All-inclusive captures more revenue but imports food cost, beverage cost, labor, and rental logistics onto your P&L. Without both sides instrumented, you can grow revenue per event while shrinking contribution per event.
How should seasonality affect KPI reporting cadence?
Almost nothing in this business should be compared month-over-month. Compare the same month year-over-year, or use rolling twelve-month windows. A venue that panics because November bookings fell from October is misreading the calendar, not the business. Set the reporting cadence to match the booking cycle, not the fiscal month.
How do small sample sizes distort venue KPIs?
A venue doing 40 to 60 weddings a year has small numbers. One unusually large event can move average revenue per event noticeably, and two cancellations can double a cancellation rate. Report medians alongside averages, use rolling twelve-month windows for anything with meaningful variance, and set a minimum sample size before acting on segment-level data.
Sources
- https://www.theknot.com/content/wedding-cost
- https://www.zola.com/expert-advice/wedding-cost
- https://www.weddingwire.com/wedding-ideas/average-wedding-cost
- https://www.nationalweddingassociation.com/
- https://www.instagram.com/
- https://www.hbr.org/
- https://www.statista.com/topics/1263/weddings/
- https://www.bls.gov/cex/
Related on PULSE
- [More kpis for wedding venues rankings and buying guides](/knowledge)
- [PULSE Tools and calculators](/tools)
- [Everything on PULSE RevOps](/)
This page will be disappearing soon. Save it to your device for $1 — or read it free while it is here.
@Kory-White- · if Venmo asks, the last 4 of my number are 2012
 pulse-industry-kpisTop 10 Sales KPIs for Cybersecurity Software in 2027
 pulse-industry-kpisTop 10 KPIs for Moving Companies in 2027
 pulse-industry-kpisTop 10 KPIs for Self-Storage Facilities in 2027
 pulse-industry-kpisTop 10 Sales KPIs for Commercial Home Health Care in 2027
 pulse-industry-kpisTop 10 Sales KPIs for Medical Practice Staffing & Locum Tenens in 2027
 pulse-industry-kpisTop 10 Sales KPIs for Hospital Group Purchasing Organization (GPO) in 2027
 pulse-industry-kpisTop 10 KPIs for Physical Therapy Clinics in 2027
 pulse-industry-kpisTop 10 Sales KPIs for Industrial Compressed Air Systems in 2027
 pulse-industry-kpisTop 10 KPIs for Plumbing Contractors in 2027
 pulse-industry-kpisTop 10 Sales KPIs for Commercial Pharmaceutical Sales in 2027