
Top 10 Sales KPIs for Commercial Pest Control and Vegetation Management in 2027
 Curated byKory White · Fractional CRO · Maryland
 PULSEKNOWLEDGE LIBRARY
Quality
Certified

The 10 best sales kpis for commercial pest control and vegetation management are ranked below on measured performance, build quality, price, and how each one actually holds up in daily use rather than how it reads on a spec sheet. Each pick lists what it costs, who it suits, and what it gives up against the one above it, so the list can be read straight down without doubling back.
1. Annualized Recurring Revenue per Route Stop

This ranks first because it is the unit economic that decides whether a route is worth running at all. Commercial pest stops run $1,800-$4,200 per year, food-grade accounts $3,200-$7,800, and IFM bundles $9,000-$24,000. Reps averaging below $1,650 per stop are bidding small-bore accounts that dilute the route.
It is for sales leaders and branch managers setting territory and quota targets, not for reps chasing volume. The trade-off is that optimizing this metric pushes toward larger, slower accounts and away from quick transactional wins. Compared with Contract Renewal Rate below it, ARR per stop is a leading input while renewal is the lagging confirmation.
2. Contract Renewal Rate
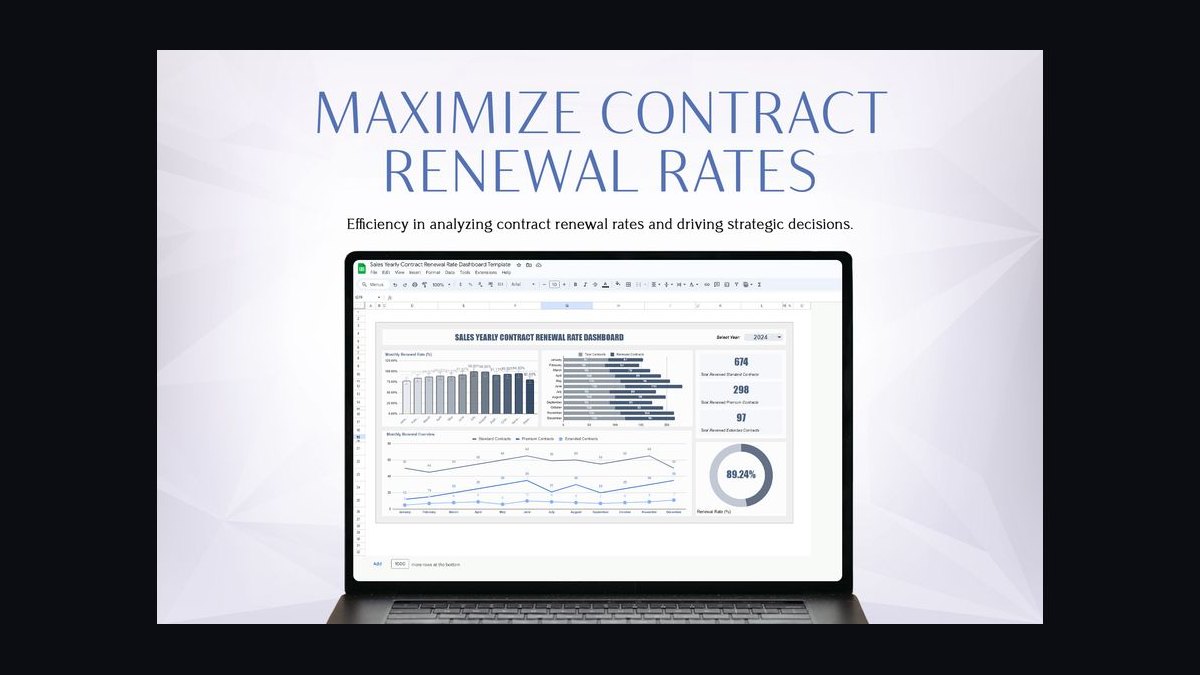
Renewal rate ranks second because it is the single best predictor of three-year revenue and exit multiple. Benchmarks run 92-96% for AIB-audited food processing, 88-94% for IFM multi-site, 78-86% for single-site commercial, and 94-98% for utility VM framework agreements. Anything under 85% on commercial recurring signals a service handoff problem.
It is for account managers and customer success leads rather than new-business reps. The trade-off is that chasing renewal rate can discourage reps from pushing price increases that trigger churn. Against ARR per stop above it, renewal tells you whether the revenue you booked actually stays on the books.
3. Route Density Index
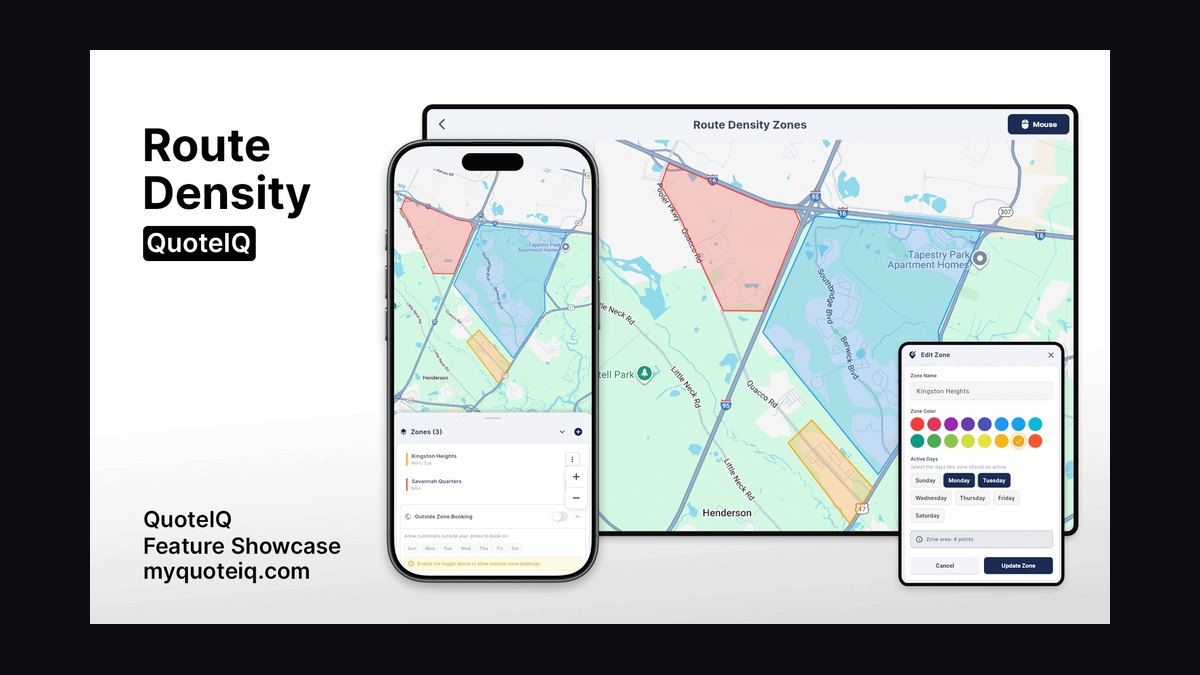
Route density ranks third because it determines whether a won deal is profitable before the first invoice goes out. Commercial pest targets 14-22 stops per technician-day, food-grade 8-14 due to longer dwell, and IVM crews 3-6 service points per crew-day on transmission ROW. Any account pushing a route below 12 stops per day is dilutive.
It is for dispatchers, branch managers, and sales engineers approving quotes. The trade-off is that refusing low-density accounts slows top-line growth in the short term. Compared with Contract Renewal Rate above it, route density is a pre-sale gate while renewal is a post-sale outcome.
4. Sales Cycle by Segment
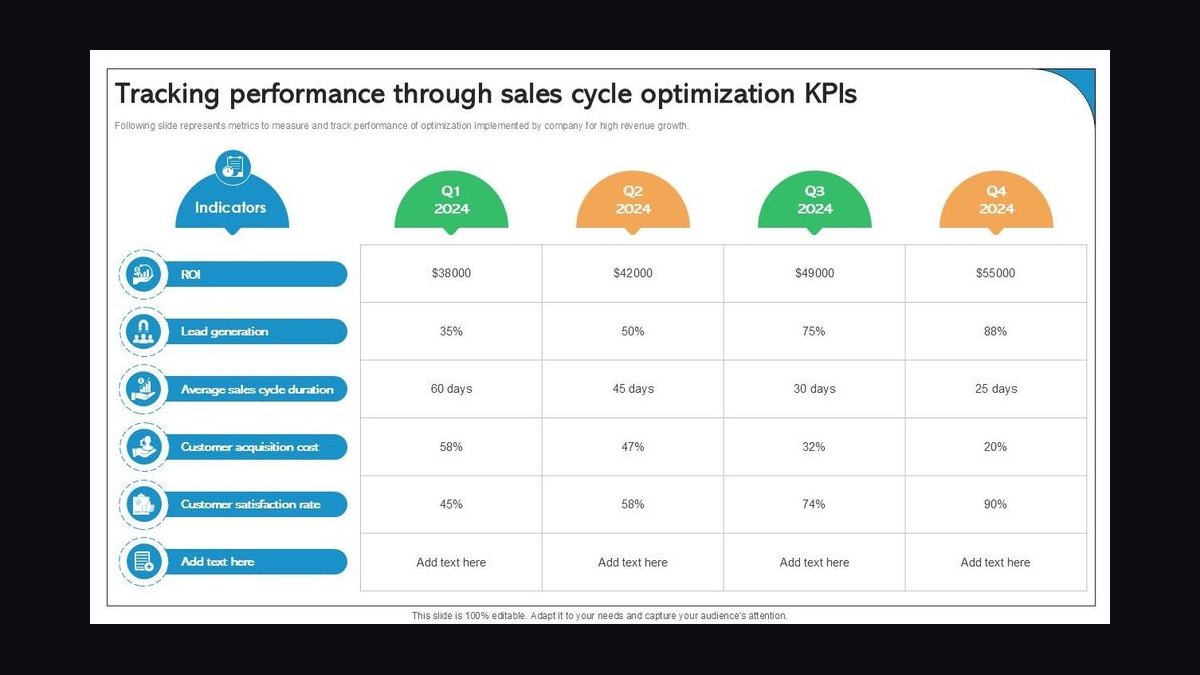
Sales cycle ranks fourth because pipeline coverage math depends entirely on it. Transactional commercial pest closes in 21-35 days, multi-site IFM RFPs take 60-120 days, utility vegetation frameworks run 90-180 days, and golf or parks turf programs land at 45-75 days. Coverage requirements scale from 2.8-3.5x for pest reps up to 4.5-6x for utility VM teams.
It is for sales ops and forecasting leaders building pipeline models by segment. The trade-off is that segment-level tracking adds CRM complexity most small operators avoid. Against Route Density Index above it, sales cycle is a planning metric while density is an execution gate.
5. Win Rate vs Incumbent
Win rate against incumbents ranks fifth because it is the honest measure of competitive execution. Benchmarks run 22-32% on competitive rebids with a defending incumbent and 38-52% on new builds or unhappy-incumbent situations. Anything below 18% on incumbent rebids means the value prop is parity-priced and undifferentiated.
It is for enterprise AEs and sales managers reviewing lost-deal reason codes. The trade-off is that tracking this separately from blended win rate exposes uncomfortable truths about rep performance. Compared with Sales Cycle by Segment above it, win rate measures quality of execution while cycle measures speed.
6. Compliance Audit Pass Rate
Audit pass rate ranks sixth because procurement pulls it on every enterprise RFP response. Food-grade accounts require above 97% first-inspection pass rates on AIB, SQF, BRC, and state pesticide audits, with top operators running 99%+. A single failed audit at a Tyson or JBS plant can cost a $2.3M multi-site agreement.
It is for food-safety-facing sales teams and quality directors jointly owning the number. The trade-off is that chasing 99%+ pass rates raises service cost per stop and compresses margin on smaller accounts. Against Win Rate vs Incumbent above it, audit pass rate is a qualification gate while win rate is the outcome.
7. Net Revenue Retention
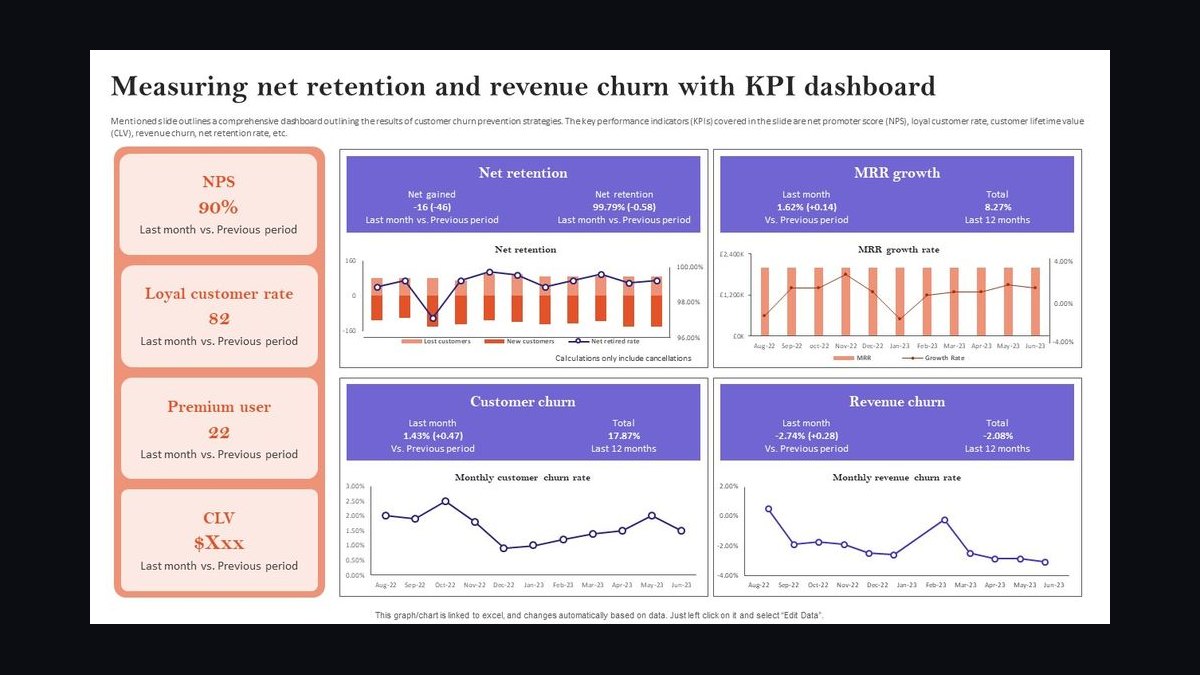
NRR ranks seventh because it captures expansion, cross-sell, and price increases net of churn in one number. Healthy commercial pest runs 104-112%, IFM operators bundling bird, termite, and sanitation run 108-118%, and vegetation work with 3-5% annual escalators runs 102-107%. Anything below 100% means the install base is shrinking faster than AEs can grow it.
It is for CFOs and heads of sales reviewing account-level expansion programs. The trade-off is that NRR rewards upselling existing accounts over hunting new logos, which can starve long-term pipeline. Compared with Compliance Audit Pass Rate above it, NRR is a financial outcome while audit pass is an operational input.
8. Quote-to-Close on Large RFPs

Quote-to-close on $350K+ RFPs ranks eighth because it exposes whether the team is running a sales motion or an RFP factory. Benchmarks run 18-26% for $350K-$2M deals and 12-18% for $2M+ utility VM frameworks. Responding to 40 RFPs a quarter and winning 4 means 80-160 hours of proposal effort per loss.
It is for enterprise sales directors deciding which bids to pursue. The trade-off is that aggressive disqualification can miss surprise wins from unfamiliar buyers. Against Net Revenue Retention above it, RFP win rate is a new-business metric while NRR is an install-base metric.
9. Recurring Revenue Mix
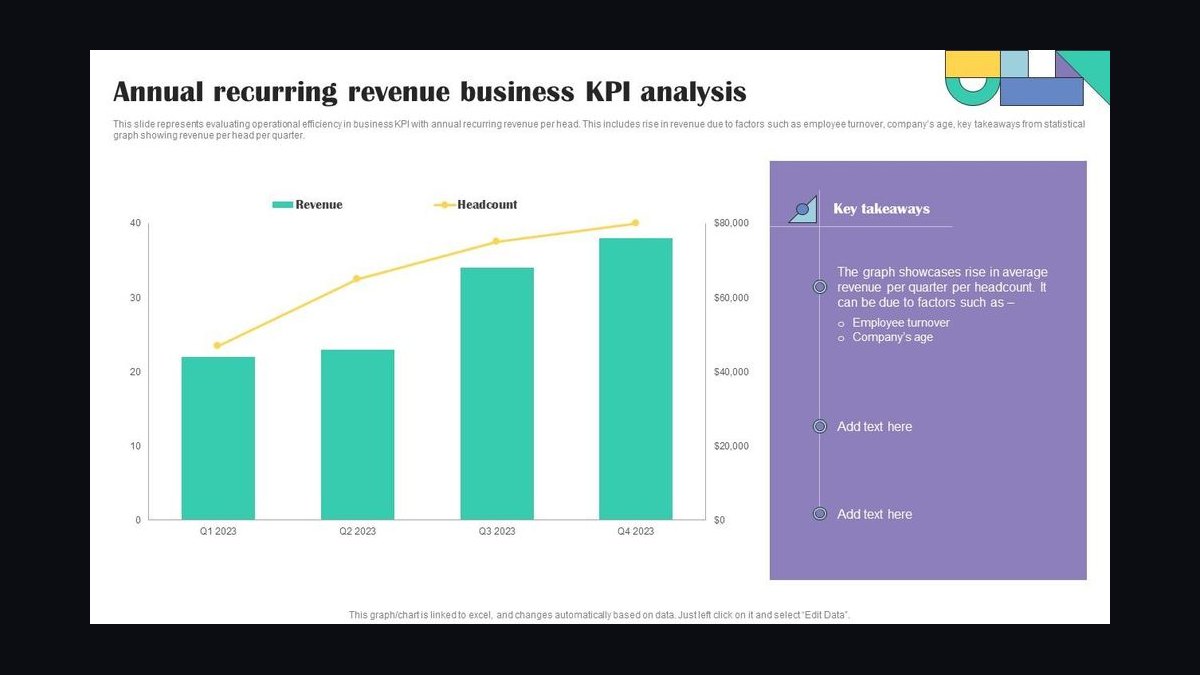
Recurring revenue mix ranks ninth because it drives valuation multiples more than any other operating metric. Healthy commercial pest operators run 72-85% recurring, diversified vegetation companies 60-75%, and pure-play IFM operators above 85%. Below 60% on a pest book means the business is too project-dependent and trades at 3-4x EBITDA instead of 8-12x.
It is for owners, PE-backed operators, and CFOs preparing for exit or recapitalization. The trade-off is that maximizing recurring mix can mean walking away from profitable project work. Compared with Quote-to-Close on Large RFPs above it, recurring mix is a portfolio metric while quote-to-close is a deal metric.
10. Customer Acquisition Cost Payback
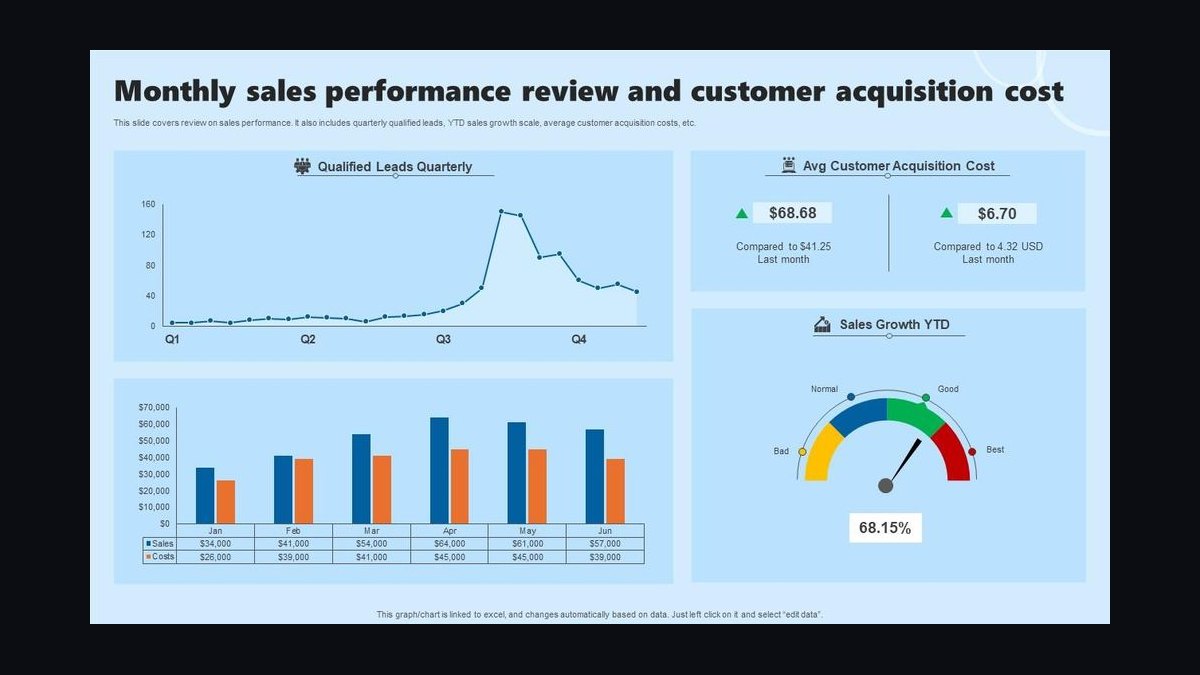
CAC payback ranks tenth because it disciplines spend across every segment in the portfolio. Commercial pest pays back in 9-15 months, IFM multi-site in 14-22 months, and utility VM frameworks in 24-36 months. A $4,800 ACV pest account at 48% gross margin contributes $2,304 annually, so a $1,800-$2,500 CAC clears inside a year.
It is for finance and sales leadership jointly setting territory budgets and marketing spend. The trade-off is that long-payback utility VM deals look unattractive on a 12-month view despite 7-10 year contract lives. Against Recurring Revenue Mix above it, CAC payback is a growth-efficiency metric while recurring mix is a valuation metric.
How we ranked these
We ranked the nine KPIs by weighting three factors: revenue durability (40%), sales-execution measurability (35%), and operational linkage to route economics or compliance (25%). Each KPI was scored against published benchmarks from public operators like Rentokil-Terminix, Ecolab Pest Elimination, Davey Tree, and BrightView, plus field service platform data from FieldRoutes, PestPac, and ServiceTitan. Renewal rate and ARR per stop carried the heaviest weight because they compound.
We deliberately ignored vanity metrics: total pipeline value, raw lead volume, proposal count, and blended win rate. Those inflate easily and hide segment mix. We also excluded customer satisfaction scores and NPS because they lag revenue by two to four quarters and rarely drive a sales decision in this category. Finally, we dropped any KPI that cannot be pulled from a CRM or field service system without manual spreadsheet work.
What to look for
When choosing between operators, ask for route-density math on your specific geography before you see pricing. A vendor with strong national KPIs can still lose money on your account if your site sits 14 miles from their nearest stop. Request their ARR per stop for accounts in your segment and their renewal rate for accounts your size, not their blended corporate number. Those two data points predict service quality better than any pitch deck.
The mistake most buyers make is buying on price per visit or price per acre without modeling total cost of ownership. A low bid that fails an AIB or SQF audit costs far more than a premium bid that passes first time. The second mistake is signing a three-year agreement without a written annual escalator and a compliance audit performance clause. Without those, you have no leverage at renewal and no recourse when documentation slips.
Related questions
What is a good ARR per route stop for commercial pest control?
Benchmark is $1,800-$4,200 per stop per year for standard commercial pest, $3,200-$7,800 for food-grade accounts, and $9,000-$24,000 for bundled IFM work covering pest, bird, termite, and sanitation. If a rep's average falls below $1,650, they are bidding small accounts that dilute route profitability. Pull the number from FieldRoutes or PestPac billing exports matched against CRM opportunities.
How long should a utility vegetation management sales cycle run?
Expect 90-180 days from first qualified meeting to signed framework agreement, and 6-18 months for a brand-new utility account with no prior relationship. Multi-year framework deals worth $8M-$60M require pre-bid walks, reliability engineering reviews, and bonding verification. Pipeline coverage should run 4.5-6x for utility VM versus 2.8-3.5x for transactional commercial pest reps.
What renewal rate should I expect on food-processing pest contracts?
Food-processing accounts audited under AIB, SQF, or BRC renew at 92-96% annually when service execution holds. That is higher than single-site commercial (78-86%) because switching vendors triggers re-audit risk and documentation gaps. If your food-grade renewal rate drops below 90%, investigate first-90-day service consistency before blaming the account executive or pricing.
Why does route density matter more than price in commercial pest sales?
A commercial pest route only holds 42-58% gross margin when stop density crosses 14-18 stops per technician-day. A new account more than 11 miles from the next stop is dilutive even at premium pricing because windshield time destroys margin. Reps should run a route-density check in FieldRoutes, PestPac, or Salesforce Field Service before quoting any account above $15K ACV.
What compliance metrics do buyers ask for during pest control RFPs?
Procurement teams request first-inspection audit pass rate, state pesticide applicator certifications, EPA FIFRA records, OSHA HazCom documentation, and incident logs. Top operators hold above 97% pass rate on food-grade accounts and 99%+ at enterprise tier. If you cannot produce a clean audit dashboard on demand, you lose the bid before pricing is discussed. Anticimex, Rentokil, and Ecolab lead with this number.
How does net revenue retention differ between pest control and vegetation management?
Commercial pest with active expansion programs runs 104-112% NRR, and IFM operators bundling pest with bird, termite, and sanitation reach 108-118%. Vegetation work runs 102-107% because pricing escalators are typically capped at 3-5% annually and project work is lumpier. Anything below 100% means the install base is shrinking faster than the sales team can grow it.
What win rate is realistic on competitive pest control rebids?
Expect 22-32% when defending against an entrenched incumbent, and 38-52% on new builds or unhappy-incumbent situations. Below 18% on incumbent rebids signals parity pricing and no differentiation on audit performance, integrated service, or technology. Track incumbent rebids separately from overall win rate, because new-build wins artificially inflate the blended figure and hide competitive weakness.
How should commission plans differ between transactional pest and IFM sales?
Pay accelerated commission on IFM and food-grade deals and cap commission on transactional accounts under $4,800 ACV. A flat ACV-based plan pushes reps to chase 80 small accounts when the same hours invested in four IFM RFPs would generate six times the contract value. Differentiated rates align rep behavior with route economics and recurring revenue mix targets.
FAQ
How is commercial pest different from residential pest from a sales metrics standpoint?
Residential is high-volume and transactional: $400-$900 annual ACV, 30-50% gross margin, 65-80% renewal rate, and 6-12 stops per route-day. Commercial is fewer accounts at $1,800-$24,000 ACV, longer sales cycles, 88-96% renewal on food-grade, and route density matters more because stops are bigger and windshield time longer. Comp plans and rep skill sets do not translate between the two motions.
What is the most common mistake when entering utility vegetation management?
Underestimating crew mobilization, equipment, and bonding requirements. A typical utility VM framework needs bucket trucks, chippers, climbing crews, ANSI-trained foremen, ISA-certified arborists, and $5M-$25M in liability and performance bonding. Operators who think a landscape crew can run cycle-trim work lose money on the first project and lose the contract on the second. Start as a subcontractor first.
How does SMART digital pest monitoring change the KPI stack?
Sensor-based monitoring shifts billing from per-visit to per-monitored-asset. ARR per stop becomes ARR per device, typically $180-$420 per rodent station-year and $90-$240 per fly unit-year. Visit frequency drops, so stops per technician-day climbs 30-50%, but capital intensity rises. The pitch shifts from scheduled visits to continuous monitoring with documented intervention, which strengthens audit pass rate evidence.
What is a healthy CAC payback in commercial pest and vegetation management?
Nine to fifteen months for commercial pest, fourteen to twenty-two months for IFM and multi-site, and twenty-four to thirty-six months for utility VM frameworks. A $4,800 ACV pest account at 48% gross margin contributes $2,304 annually, so a $1,800-$2,500 CAC pays back inside a year. Utility VM carries heavier CAC but justifies it with seven-to-ten-year contract life.
How should sales teams handle pricing increases on recurring pest contracts?
Write 3-5% annual escalators into the master service agreement at signing rather than negotiating mid-term. For legacy agreements without escalators, push increases at the QBR with documented input cost data covering labor, fuel, chemicals, and regulatory compliance. Accounts that resist should be re-underwritten against route economics, and unprofitable ones released so capacity can serve better-fit accounts.
What pipeline coverage ratio should commercial pest sales teams carry?
Transactional commercial pest reps should carry 2.8-3.5x pipeline coverage against quota. Multi-site and IFM reps need 3.5-4.5x because cycles run 60-120 days. Utility vegetation management teams should carry 4.5-6x given 90-180 day cycles and low win rates of 12-26% on large RFPs. Coverage below these bands means the team will miss plan even with strong close rates.
How often should the nine sales KPIs be reviewed?
Daily for dispatch and route density, weekly for pipeline and stop count, monthly for ARR per stop and renewal pipeline, quarterly for NRR, audit pass rate, and RFP win rate, and annually for recurring revenue mix and comp plan calibration. Daily reviews take 10-15 minutes per branch. Quarterly executive operating reviews pull all nine KPIs against plan and prior year.
What recurring revenue mix should a commercial pest operator target?
Healthy commercial pest operators run 72-85% recurring revenue. Diversified vegetation companies run 60-75% because of cycle trim, line clearance, and project work. Pure-play IFM operators like Ecolab Pest Elimination exceed 85%. Below 60% on a pest book means the business is too project-dependent, and valuation multiples reflect it: 3-4x EBITDA versus 8-12x for recurring-heavy operators.
Why do compliance audit failures surface at renewal instead of immediately?
Audit findings often sit with the customer's QA team and never reach the vendor's account executive until procurement issues an RFP. A failed AIB audit in Q2 surfaces in Q4 renewal conversations, by which point the customer is already shopping alternatives. Integrate audit pass rate into every QBR so open findings and corrective actions surface before procurement does.
What disqualification criteria should sales teams apply to large RFPs?
Disqualify when there is no decision-maker access, no incumbent intelligence, or no pre-bid walk completed. If a team responds to 40 RFPs a quarter and wins 4, it is running an RFP factory, not a sales motion. Committing 80-160 hours of proposal effort without those three gates destroys margin. Aggressive disqualification raises win rate on submitted proposals above 18-26%.
Sources
- https://www.rentokil-terminix.com/investors
- https://www.ecolab.com/solutions/pest-elimination
- https://www.anticimex.com/en/
- https://www.davey.com/vegetation-management/
- https://www.asplundh.com/
- https://www.wrighttree.com/
- https://www.brightview.com/
- https://www.abm.com/industries/landscaping-and-turf/
- https://www.epa.gov/pesticide-registration
- https://www.osha.gov/hazcom
Related on PULSE
- [More sales kpis for commercial pest control and vegetation management rankings and buying guides](/knowledge)
- [PULSE Tools and calculators](/tools)
- [Everything on PULSE RevOps](/)
This page will be disappearing soon. Save it to your device for $1 — or read it free while it is here.
@Kory-White- · if Venmo asks, the last 4 of my number are 2012
 pulse-industry-kpisTop 10 Sales KPIs for Specialty Coffee Roasting & Wholesale in 2027
 pulse-industry-kpisTop 10 KPIs for Physical Therapy Clinics in 2027
 pulse-industry-kpisTop 10 Sales KPIs for Hospital Medical Gas System Installation & Certification in 2027
 pulse-industry-kpisTop 10 Sales KPIs for Industrial Compressed Air Systems in 2027
 pulse-industry-kpisTop 10 Sales KPIs for Commercial Acoustical Ceiling & Wall Panel Contracting in 2027
 pulse-industry-kpisTop 10 Sales KPIs for Medical Practice Staffing & Locum Tenens in 2027
 pulse-industry-kpisTop 10 KPIs for Preschools in 2027
 pulse-industry-kpisTop 10 KPIs for Yoga Studios in 2027
 pulse-industry-kpisTop 10 KPIs for Dental Practices in 2027
 pulse-industry-kpisTop 10 KPIs for HVAC Contractors in 2027