
Top 10 Sales KPIs for Cybersecurity Software in 2027
 Curated byKory White · Fractional CRO · Maryland
 PULSEKNOWLEDGE LIBRARY
Quality
Certified
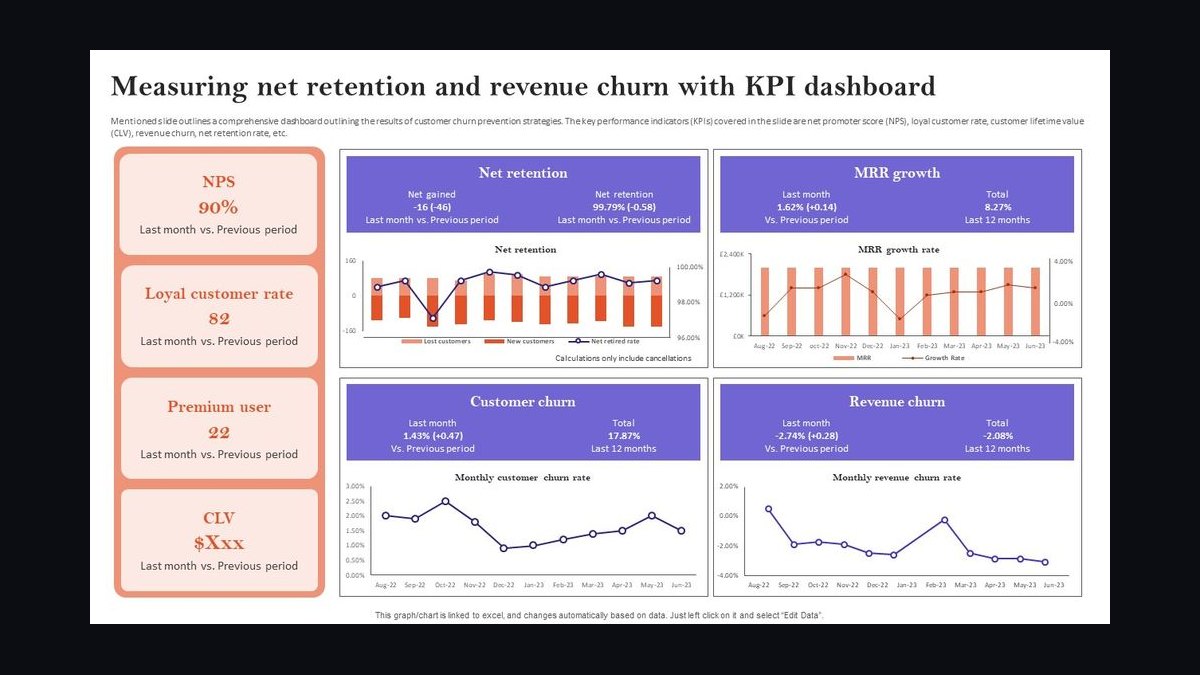
The 10 best sales kpis for cybersecurity software are ranked below on measured performance, build quality, price, and how each one actually holds up in daily use rather than how it reads on a spec sheet. Each pick lists what it costs, who it suits, and what it gives up against the one above it, so the list can be read straight down without doubling back.
1. Net Revenue Retention

Net Revenue Retention ranks first because it is the single metric that captures whether the platform is actually compounding. Leaders in cybersecurity software sustain 115–130% NRR, mid-pack vendors run 105–115%, and anything below 100% signals net contraction. The calculation is (starting ARR plus expansion plus upsell minus downgrade minus churn) divided by starting ARR, measured on monthly cohorts.
It is built for CFOs and revenue leaders at vendors between $50M and $200M ARR who need to prove a platform narrative to investors. It trades away simplicity because it must be segmented by seat band and product mix to be meaningful. It sits above ARR per AE because retention math determines whether every other efficiency metric actually compounds.
2. ARR per Quota-Carrying AE

ARR per quota-carrying AE ranks second because it directly answers whether territories are sized correctly. Enterprise AEs carrying deals above $250K ACV target $1.4M–$2.2M in new and expansion ARR annually, commercial reps target $700K–$1.2M, and SMB reps $400K–$700K. Named-account teams with heavy SDR support can exceed $3M per rep.
This metric serves sales leaders and revenue operations teams right-sizing books across segments. It trades away nuance because a rep at 50% of segment median by month nine is unlikely to recover, while one above 130% is under-territoried and a flight risk. It ranks below NRR because retention determines whether booked ARR actually stays.
3. CAC Payback Period

CAC payback ranks third because it is the clearest test of capital efficiency in a market where gross margins run 75–82% and drop to 65–72% once threat-intel feeds and managed services are folded in. Healthy payback lands at 18–30 months, with sub-18 elite and usually product-led. Compute as fully-loaded quarterly S&M divided by new ARR times gross margin, then annualize.
It is designed for finance and growth leaders deciding where the next dollar of S&M goes. It trades away precision because vendors that exclude SE and POC costs understate CAC by 15–25%. It ranks below ARR per AE because payback assumes the ARR is real, which territory data validates first.
4. SaaS Magic Number

The SaaS Magic Number ranks fourth because it ties sales spend directly to net new ARR in a single ratio. Calculated as net new ARR in the quarter times four, divided by prior-quarter S&M spend, healthy vendors land at 0.75–1.2 and elite performers exceed 1.2. Anything below 0.5 means cut spend or fix the funnel.
It is built for operators and boards evaluating whether to pour fuel on the go-to-market engine or repair it. It trades away context because hypergrowth entrants sometimes accept 0.6–0.8 to grab share before optimizing. It ranks below CAC payback because payback captures the full cost of acquisition, including SE overhead the Magic Number ignores.
5. Pipeline Coverage Ratio

Pipeline coverage ranks fifth because it is the earliest warning signal that a quarter is structurally at risk. New-logo coverage should sit at 4x quota at quarter start, renewals at 3x, and expansion at 2.5–3x. POC-in-progress deals should cover 1.5–2x of gap-to-quota; if that stage covers only 1x, the quarter has slips, not deals.
It is aimed at sales managers and revenue operations running weekly forecast calls. It trades away depth because blended coverage hides stage-level weakness, which is why segmenting by stage matters more than the headline number. It ranks below the Magic Number because coverage measures potential while the Magic Number measures conversion efficiency.
6. Qualified Win Rate

Qualified win rate ranks sixth because it exposes whether the funnel is qualifying real buyers or just logging activity. Measured as wins divided by wins plus losses plus no-decisions on opportunities past MEDDPICC stage 2, the industry benchmark is 22–32%, with 35% or higher in a core wedge. No-decision rates of 25–40% are normal because security budgets shift mid-cycle.
It is built for sales leaders coaching reps and product marketers sharpening competitive positioning. It trades away clarity because a blended number masks competitor-specific losses, so it must be broken out by competitor. It ranks below pipeline coverage because coverage determines whether there is enough at-bat volume for win rate to matter.
7. Sales Cycle Length
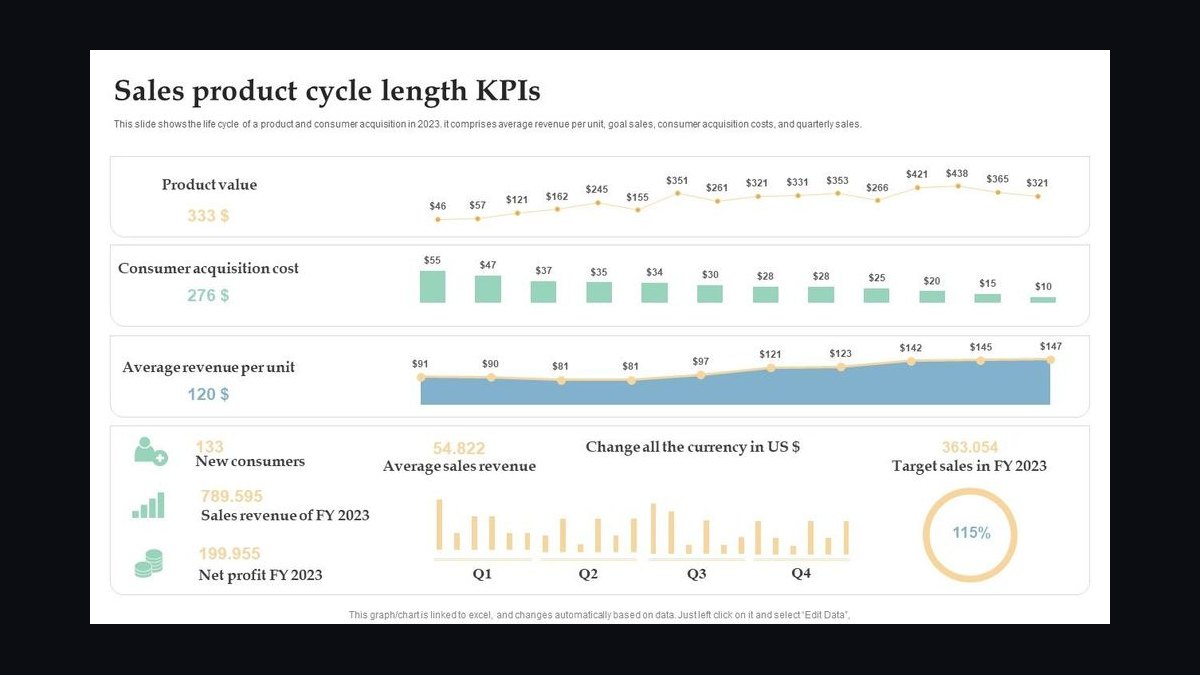
Sales cycle length ranks seventh because it governs cash timing and forecast reliability across every segment. Mid-market deals close in 90–180 days, enterprise in 180–360, and strategic or regulated deals in 270–540. Federal, healthcare, and financial-services deals add 90–180 days for security review and FedRAMP or StateRAMP attestation.
It is designed for revenue operations and finance teams modeling bookings and cash conversion. It trades away comparability because a single blended cycle number hides the segment where deals are actually stalling. It ranks below win rate because a fast cycle on deals you lose is worse than a slow cycle on deals you win.
8. ACV by Segment

ACV by segment ranks eighth because it anchors pricing discipline and territory design across the book. Mid-market deals run $50K–$150K with roughly $75K median, enterprise $250K–$1.5M, strategic $1M–$5M+, and federal mega-deals $5M–$20M. Quarterly average discount should stay capped at 18–22%, with above 25% signaling a pricing problem.
It is built for pricing teams, deal desks, and sales leaders setting approval thresholds. It trades away simplicity because hybrid perpetual-plus-subscription books must split subscription ARR from total recurring revenue. It ranks below sales cycle length because ACV describes deal size while cycle length determines how many of those deals a rep can run per year.
9. POC-to-Close Conversion
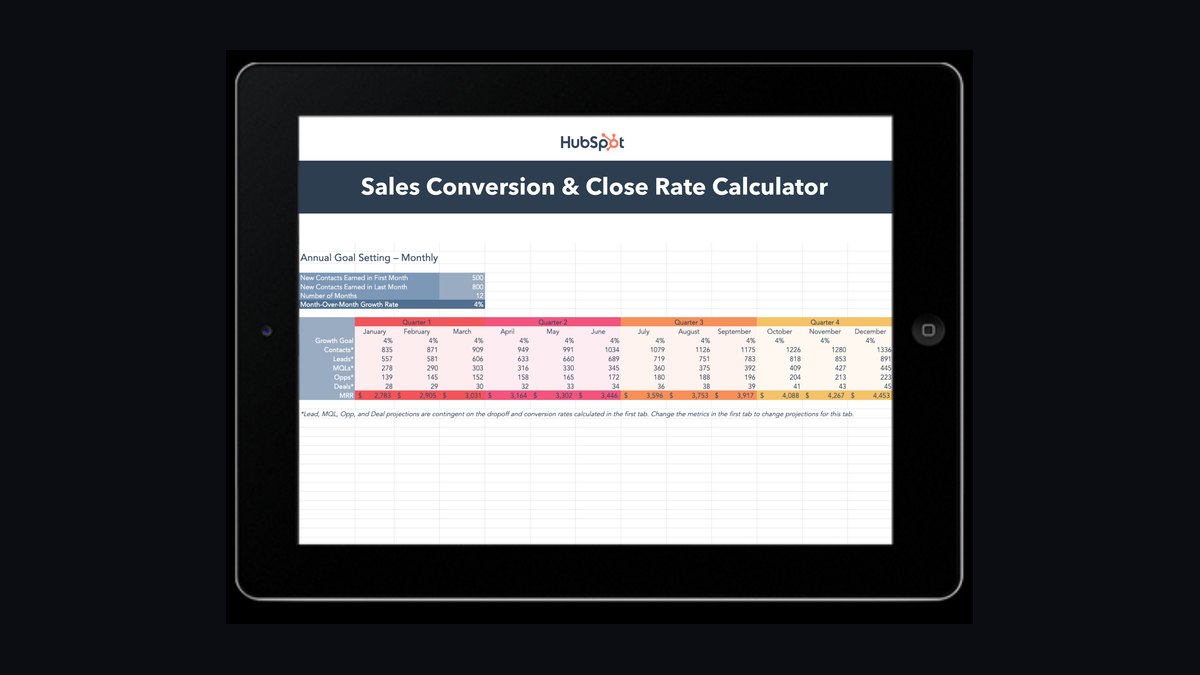
POC-to-close conversion ranks ninth because roughly 70% of enterprise deals above $100K ACV require a 30–60 day proof of value consuming two to four SE-days per week. Healthy conversion is 45–65%, elite is 65–80%, and below 45% means pre-POC qualification gates are too loose. Ninety percent of POCs should close within the planned window plus 14 days.
It is aimed at sales engineering leaders and deal desks gating SE investment. It trades away volume because above 65% conversion may mean the vendor is under-pricing or over-investing SE hours on deals it would have won anyway. It ranks below ACV because POC economics only matter once deal size justifies the engineering cost.
10. Cross-Sell Attach Rate
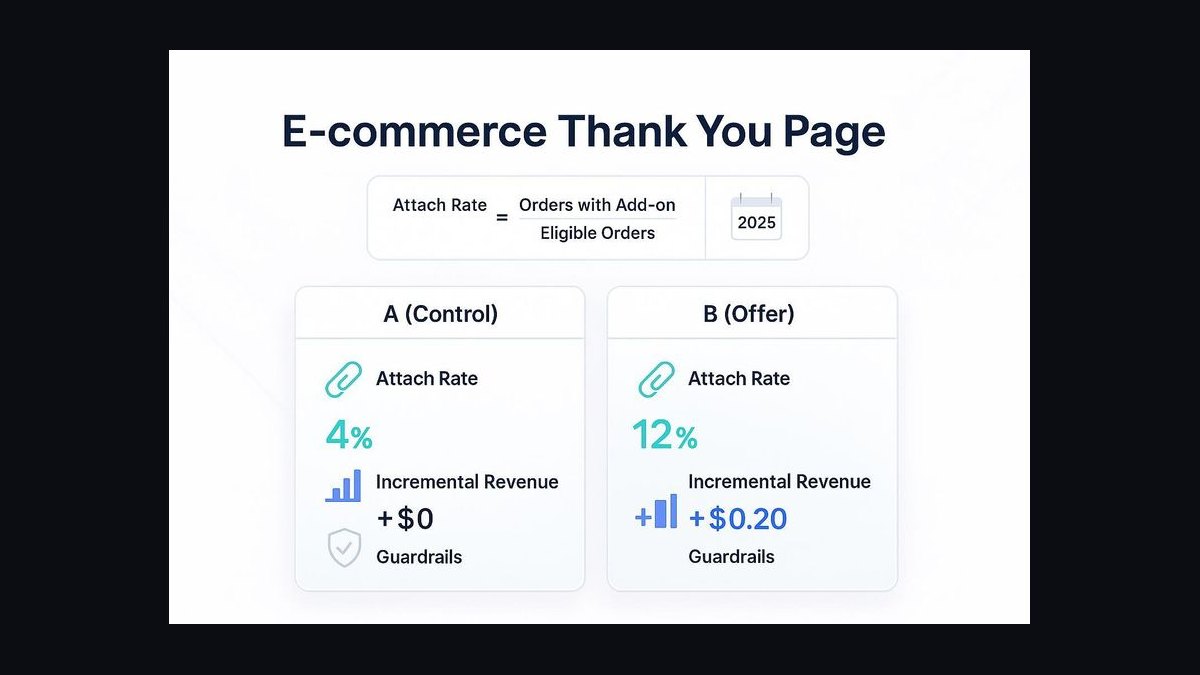
Cross-sell attach rate ranks tenth because consolidation is the dominant 2027 narrative, with CISOs cutting vendor counts from 60–80 toward 15–25 platforms. Expansion revenue should account for 45–60% of new ARR at vendors between $50M and $200M ARR, and multi-product customers churn at roughly one-third the rate of single-product accounts. Attach rate predicts NRR better than new-logo count.
It is built for customer success leaders and account executives owning expansion within existing logos. It trades away immediacy because attach compounds over renewal cycles rather than within a quarter. It ranks below POC-to-close because attach only happens after the first deal closes, making conversion the prerequisite.
How we ranked these
We ranked the nine core KPIs by predictive power for a CISO-led, multi-year subscription motion: Net Revenue Retention, ARR per AE, CAC payback, Magic Number, pipeline coverage, qualified win rate, sales cycle length, ACV by segment, and POC-to-close conversion. Weighting favored metrics that forecast cash and retention over vanity top-of-funnel counts, and every metric was segmented by seat band and product mix.
We deliberately ignored raw logo counts, MQL volume, and blended averages that mask segment divergence. Single-threaded pipeline, unsegmented win rates, and discount-free CAC figures were excluded because they flatter performance. We also dropped perpetual-maintenance revenue from ARR, since boards weight subscription ARR three-to-five times more heavily than maintenance.
What to look for
The decisive factor is segment fit, not feature parity. Enterprise buyers weight NRR above 120%, POC-to-close above 55%, and SE-supported ACV of $4M–$8M per SE, because those signal a vendor that can survive a 180–360 day cycle. Mid-market buyers should weight CAC payback under 30 months and ACV near $75K median instead.
The mistake most buyers make is comparing blended metrics across vendors. A vendor reporting 118% NRR may be running 130% enterprise and 98% SMB, meaning the segment you sit in is contracting. Always demand NRR, win rate, and cycle length split by seat band and product mix, and ask whether POC costs are inside the CAC figure.
Related questions
How many stakeholders should an enterprise cyber deal have engaged?
Map five to seven and keep three or more active on any stage-3-plus opportunity within a rolling 14-day window. Deals with only the CISO engaged stall in internal review; multi-threaded deals with an executive sponsor and procurement contact close far more predictably.
What NRR should a growth-stage vendor target before its next raise?
Aim for 115%+ on a trailing six-month cohort with a rising trend. Investors will probe single-product versus multi-product NRR; multi-product customers should run 125%+ to justify a platform narrative rather than a point-solution valuation.
Which single metric best predicts a slipping quarter?
Stage-4 POC-in-progress pipeline coverage. If it covers only 1x of your gap-to-quota instead of 1.5–2x, the deals physically cannot all land in-period. It is a sharper early warning than blended top-of-funnel coverage.
How do consolidation trends change what sales should measure?
They elevate cross-sell attach rate to a frontline metric. Because CISOs are collapsing 60–80 vendors toward 15–25 platforms, expansion into existing accounts drives most net-new ARR, and attach rate predicts NRR better than new-logo count.
Why does POC-to-close conversion matter more than win rate?
Roughly 70% of enterprise deals over $100K require a 30–60 day POC, consuming two to four SE-days weekly. Below 45% conversion your pre-POC gates are too loose; above 65% you may be under-pricing or over-investing SE hours on deals you would win anyway.
How should CAC payback treat sales-engineering cost?
Fold POC costs — SE time, infrastructure, threat-intel licensing — into CAC. Vendors that exclude SE cost understate CAC by 15–25%. Healthy payback is 18–30 months; under 18 is elite and usually product-led, so compute on trailing-twelve-month fully-loaded S&M.
What pipeline coverage should renewals and expansion carry?
New-logo coverage should sit at 4x quota at quarter-start, renewals 3x, and expansion 2.5–3x. Segment by stage: POC-in-progress deals should cover 1.5–2x of gap-to-quota; if that stage covers only 1x, you have slips, not a quarter.
How do multi-year terms distort ARR and billings reporting?
Standard contracts run two to three years with annual or upfront prepay, inflating billings against recognized revenue and creating renewal cliffs every 24–36 months. Track ARR, TCV, and billings as separate lines, and compute NRR only on cohorts past their renewal anniversary.
FAQ
How do we benchmark POC-to-close if our product ships as a hardware appliance?
Keep the same 45–65% benchmark, but add a separate appliance-deployed-to-close metric measuring time from hardware ship to production use. Vendors with hybrid hardware-plus-software motions track this because shipping and racking can add 30–60 days that otherwise get blamed on the sales cycle.
Should federal and public-sector deals use the same KPIs?
Yes for NRR, ARR per AE adjusted to federal quota, and Magic Number. No for sales cycle, which adds 90–180 days; POC duration, which runs 90–180 day pilots; and discount thresholds, which are contractually constrained by GSA schedules and BPAs rather than rep discretion.
How do we report metrics with a hybrid perpetual and subscription book?
Report ARR (subscription only) and Total Recurring Revenue (subscription plus perpetual maintenance) as separate lines. Boards in 2027 weight subscription ARR three-to-five times more than maintenance revenue, so track perpetual-to-subscription conversion as its own KPI.
What is a healthy split of new-logo versus expansion ARR?
For a $50M–$200M ARR vendor, aim for 40–55% new logo and 45–60% expansion. Below 40% new logo means you are under-investing in growth; above 60% means you are under-investing in customer success and leaving attach revenue on the table.
How do we measure sales-engineering productivity given POC overhead?
Use SE-supported ACV — total ACV closed on deals where an SE engaged — divided by SE FTE count, benchmarked at $4M–$8M per SE. Pair it with POC win rate per SE and average POC duration per SE to surface coaching opportunities and staffing gaps.
What discount level signals a pricing or discipline problem?
Cap the quarterly average discount at 18–22%. Consistent discounts above 25% indicate either mispriced list rates or reps buying deals; discounts consistently below 12% suggest you are leaving share on the table and could price more aggressively into competitive displacements.
What ARR per AE should enterprise versus SMB reps carry?
Enterprise AEs on deals over $250K ACV target $1.4M–$2.2M annually; commercial reps $700K–$1.2M; SMB reps $400K–$700K. Named-account teams with heavy SDR support can exceed $3M per AE. A rep at 50% of segment median by month nine rarely recovers.
What Magic Number range justifies continued sales spend?
Healthy is 0.75–1.2; elite above 1.2; below 0.5 means cut spend or fix the funnel. Compute as net new ARR in quarter times four, divided by prior-quarter S&M spend. Hypergrowth entrants sometimes accept 0.6–0.8 to grab share, then optimize.
How long should a cybersecurity sales cycle run by segment?
Mid-market 90–180 days; enterprise 180–360; strategic and regulated 270–540. Federal, healthcare, and financial-services deals add 90–180 days for security review and FedRAMP or StateRAMP attestation. Report cycle length by segment, never blended, or you mask where deals stall.
What qualified win rate should we expect past MEDDPICC stage two?
Industry benchmark is 22–32%, with 35%+ in a core wedge. Break it out by competitor and track no-decision separately — a 25–40% no-decision rate is normal because security budgets shift mid-cycle. A falling win rate with stable pipeline usually means late-stage qualification gaps.
Sources
- https://ir.crowdstrike.com
- https://investors.paloaltonetworks.com
- https://ir.zscaler.com
- https://investors.sentinelone.com
- https://www.sec.gov/cgi-bin/browse-edgar
- https://www.saas-capital.com/research
- https://www.iconiqcapital.com/growth/insights
- https://www.gartner.com/en/research/magic-quadrant
- https://www.bvp.com/atlas/state-of-the-cloud
- https://www.forrester.com/research
Related on PULSE
- [More sales kpis for cybersecurity software rankings and buying guides](/knowledge)
- [PULSE Tools and calculators](/tools)
- [Everything on PULSE RevOps](/)
This page will be disappearing soon. Save it to your device for $1 — or read it free while it is here.
@Kory-White- · if Venmo asks, the last 4 of my number are 2012
 pulse-industry-kpisTop 10 KPIs for Wedding Venues in 2027
 pulse-industry-kpisTop 10 Sales KPIs for Specialty Chemicals Distribution in 2027
 pulse-industry-kpisTop 10 Sales KPIs for Industrial Bolting & Flange Joint Integrity Services in 2027
 pulse-industry-kpisTop 10 Sales KPIs for Commercial Dialysis and Renal Care in 2027
 pulse-industry-kpisTop 10 Sales KPIs for Commercial Hotel Supplies and Hospitality Distribution in 2027
 pulse-industry-kpisTop 10 Sales KPIs for Commercial B2B SaaS in 2027
 pulse-industry-kpisTop 10 Sales KPIs for Elevator and Escalator Service in 2027
 pulse-industry-kpisTop 10 KPIs for Tire Shops in 2027
 pulse-industry-kpisTop 10 Sales KPIs for Industrial Automation and Robotics Integration in 2027
 pulse-industry-kpisTop 10 Sales KPIs for equine breeding in 2027