
Top 10 Sales KPIs for Commercial Pharmaceutical Sales in 2027
 Curated byKory White · Fractional CRO · Maryland
 PULSEKNOWLEDGE LIBRARY
Quality
Certified

The 10 best sales kpis for commercial pharmaceutical sales are ranked below on measured performance, build quality, price, and how each one actually holds up in daily use rather than how it reads on a spec sheet. Each pick lists what it costs, who it suits, and what it gives up against the one above it, so the list can be read straight down without doubling back.
1. Pharma TRx Volume Per Rep

TRx per rep is the headline volume KPI because it is the number every commercial leader reports first each Monday. A primary care rep on a mature brand books 1,200-2,500 TRx weekly across a territory; a specialty oncology rep books 80-150 TRx weekly on a $15,000-per-month therapy. Launch-year specialty reps typically run 30-60% of mature-state TRx.
This KPI is for commercial ops leaders who need one shared volume number across primary care and specialty. It trades away quality signal: a rep can ride incumbent refill volume for 18 months without a single productive call. Compare it to NRx share directly below, which captures new decisions rather than refills.
2. Pharma NRx Share
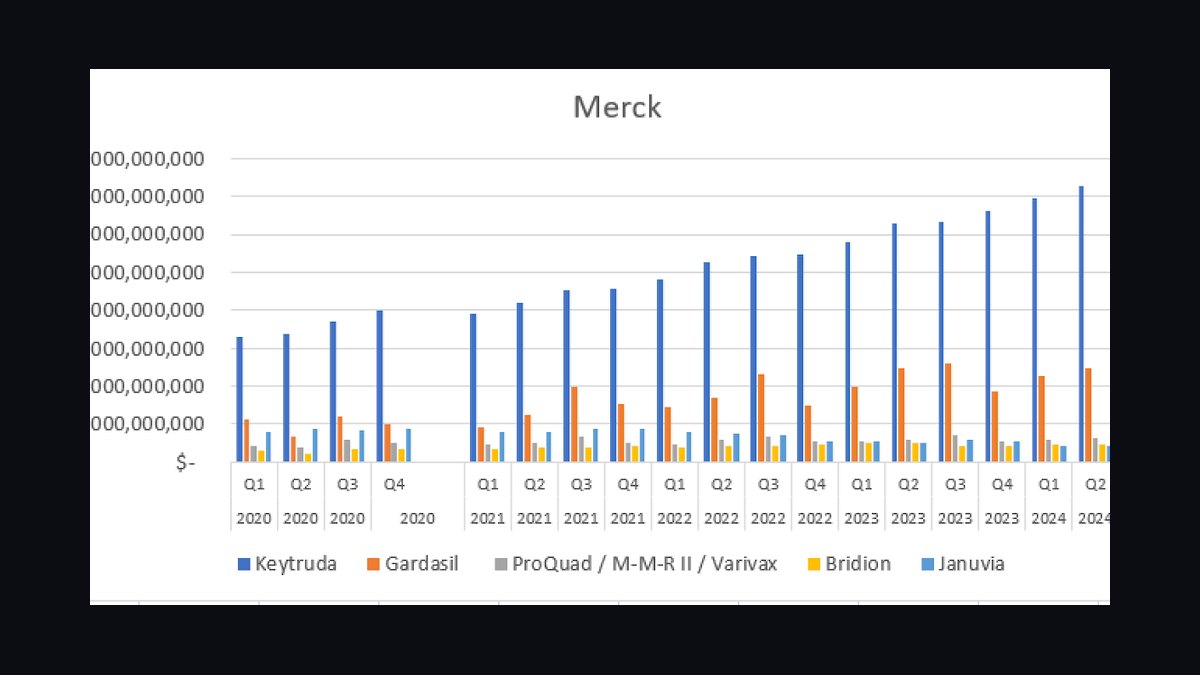
NRx share is the leading indicator that ranks second because it captures new starts and switches, not refills. Strong launch performance is 18-25% NRx share within 12 months in primary care and 25-40% in specialty where the indication is narrower. Lilly's Mounjaro hit 50%+ NRx share in new GLP-1 starts inside 18 months, the outlier ceiling.
This KPI is for launch brand teams and district managers coaching against the S-curve. It trades away absolute volume context, since a small class makes share look large. Compare it to decile-level market share below, which narrows the same signal to the rep's actual call list.
3. Targeted Decile Market Share

Market share within the targeted physician decile ranks third because it separates rep effectiveness from market effects. A specialty rep calling 110 decile 7-10 cardiologists should run 35-55% share inside that list once established; inside a launch year, 10-18% is the target. IQVIA and Symphony segment prescribers into deciles 1-10 by historical writing volume.
This KPI is for individual coaching plans and territory-level QBRs. It trades away national comparability, since every rep's list differs. Compare it to NRx share above, which measures the whole class rather than the rep's own call cohort.
4. Pharma Formulary Win Rate
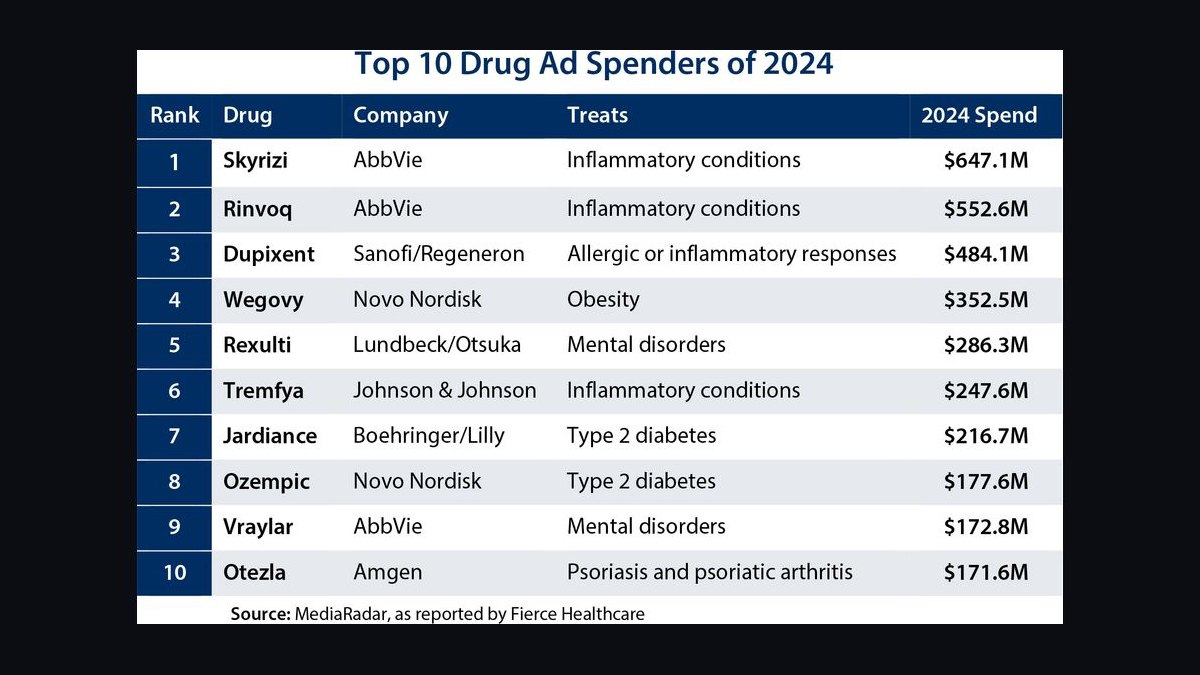
Formulary win rate ranks fourth because payer contracting gates volume before the field can sell anything. A national brand needs to win 70-80% of Tier 2 placements and 40-55% of Tier 1 preferred slots to hit forecast. Losing a top-3 PBM is a re-forecast event, costing 25-40% of covered lives access in a single P&T cycle.
This KPI is for KAM teams and commercial leadership reviewing payer strategy quarterly. It trades away field-level granularity, since wins are national or regional. Compare it to payer access coverage below, which is the cumulative output of every win and loss.
5. Payer Access Covered Lives

Payer access coverage ranks fifth because below 65% at launch the field cannot make quota regardless of call activity. Pre-launch target is 65%+ at launch, 80%+ by month 12, and 90%+ by month 24. Below that gate, too many scripts get abandoned at the pharmacy counter for call volume to matter.
This KPI is for launch planners and market access leads tracking MMIT, Fingertip Formulary, or Policy Reporter feeds. It trades away speed, since P&T cycles move quarterly and Medicare Part D follows a separate CMS bid calendar. Compare it to formulary win rate above, which is the input rather than the cumulative result.
6. Tier 1 HCP Call Frequency
Tier 1 call frequency ranks sixth because it is the leading execution indicator that breaks before TRx does. Primary care benchmark is 4-6 calls per quarter on Tier 1 and 2-4 on Tier 2; specialty runs 8-12 calls per year on Tier 1 KOLs with longer dwell time. Reps below 70% plan attainment by end of Q2 get flagged for PIP.
This KPI is for district managers running Monday call-plan reviews in Veeva CRM. It trades away persuasion quality, counting presence rather than impact. Compare it to sample-to-script conversion below, which measures whether those calls actually moved a prescription.
7. Sample-to-Script Conversion
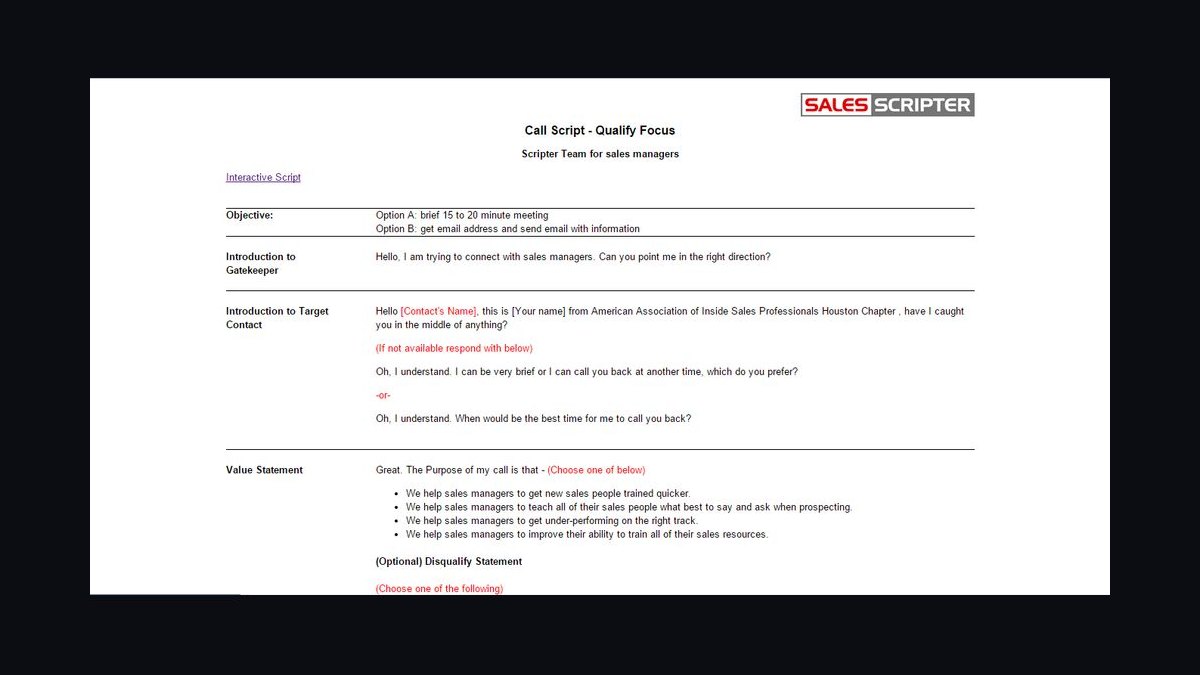
Sample-to-script conversion ranks seventh because samples remain the highest-leverage tool a rep carries. Primary care benchmark is 22-30% TRx within 30 days of a sample drop; specialty runs 35-45% on smaller, more deliberate denominators. Below 18%, the rep is dropping samples without a call plan.
This KPI is for field analytics teams running matched-pair attribution through Symphony or DDD data. It trades away easy interpretation, since above 40% in primary care often means sampling already-converted prescribers. Compare it to Tier 1 call frequency above, which measures the visit that precedes the drop.
8. MSL Engagement Prescribing Lift
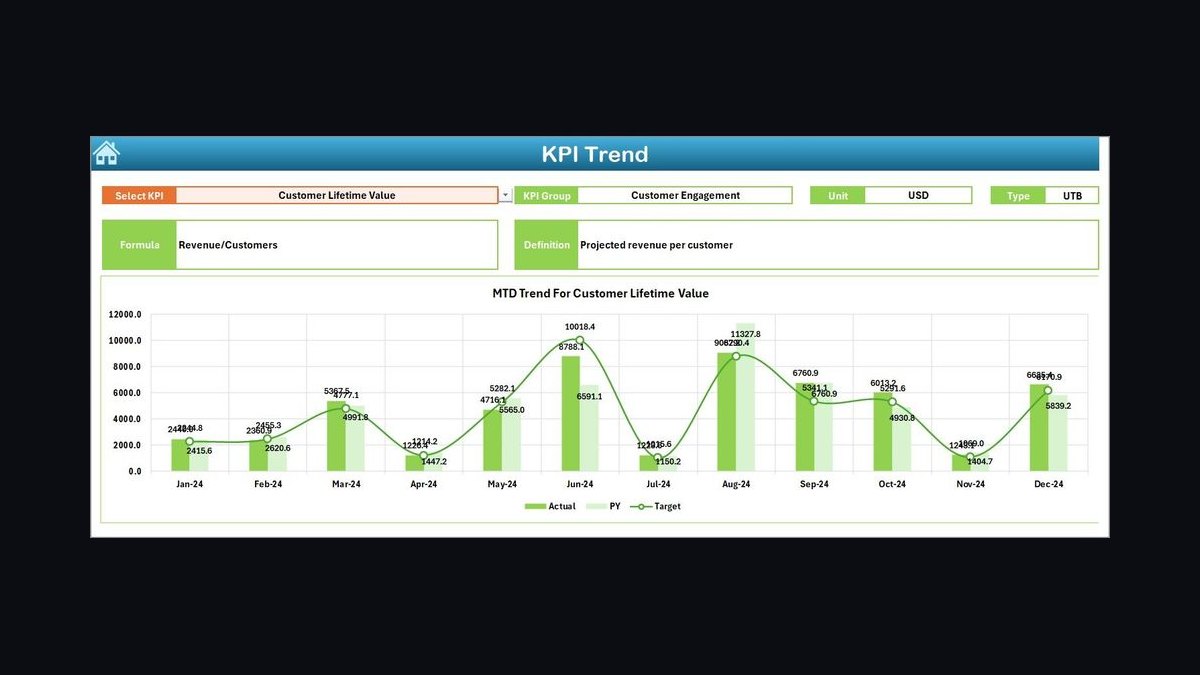
MSL engagement-to-prescribing lift ranks eighth because it is one of the few legal channels to discuss clinical data depth. Benchmark is 4-6 scientific exchange touches per Tier 1 KOL per year, producing 8-15% NRx lift versus matched-pair controls on specialty molecules. AbbVie and Vertex both measure this quarterly.
This KPI is for medical affairs and commercial analytics teams running ZS or IQVIA attribution methodology. It trades away direct control, since MSLs are non-promotional and cannot be quota-managed. Compare it to sample-to-script conversion above, which is a field-owned lever rather than a medical-owned one.
9. Rep Quota Attainment
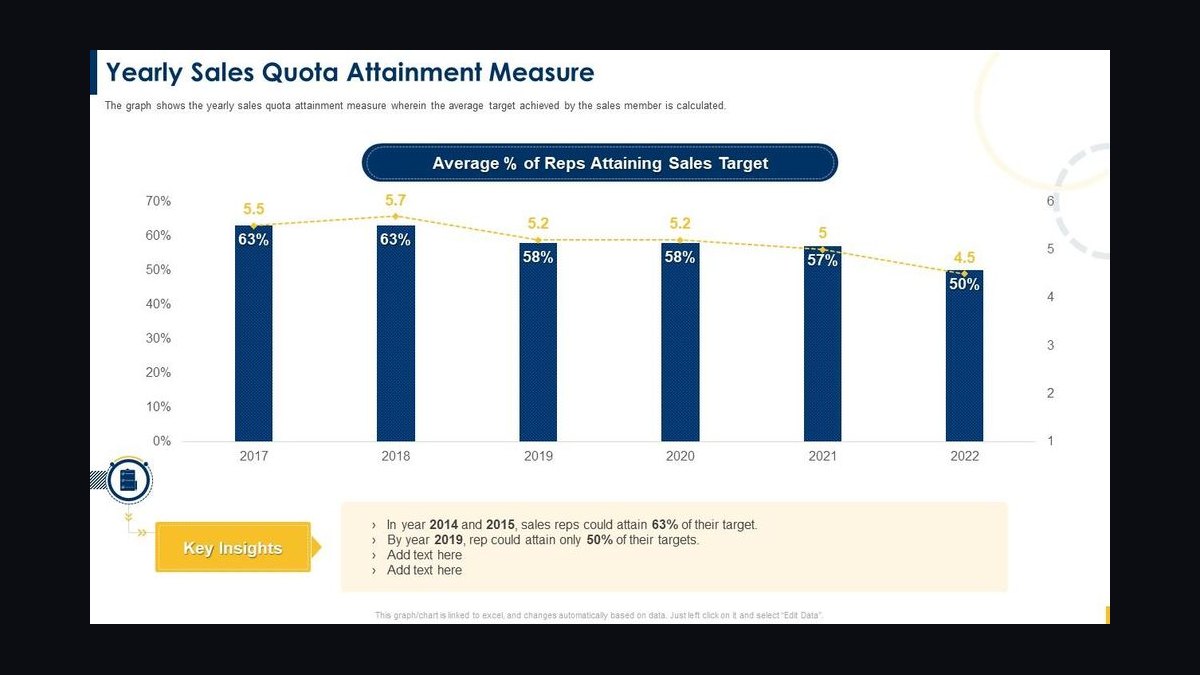
Rep-to-quota attainment ranks ninth because it is the compensation KPI every rep watches daily. Healthy distribution is 60-70% of the field at 90-110% attainment, 15-20% above 110%, and 10-15% below 90%. Pharma comp plans typically run 70/30 base/bonus with acceleration above 100%.
This KPI is for sales leadership setting quotas and comp plans each planning cycle. It trades away diagnostic value, since a district with 40%+ below 90% usually signals a quota-setting problem rather than a performance one. Compare it to Tier 1 call frequency above, which is the leading input to attainment.
10. Pharma Virtual Engagement Rate

Virtual engagement rate ranks tenth because hybrid models post-2023 permanently shifted 20-30% of total touches to virtual, especially for Tier 2-3 HCPs. Primary care reps now run 4-6 virtual touches daily alongside 8-10 in-person calls. Rare disease and oncology teams use virtual for follow-up between longer in-person KOL visits.
This KPI is for field deployment teams optimizing territory coverage against travel cost. It trades away relationship depth, since virtual touches convert at lower rates than in-person details on complex molecules. Compare it to Tier 1 call frequency above, which still anchors the in-person benchmark.
How we ranked these
We ranked nine operator-grade KPIs by weight of impact on commercial pharma sales performance in 2027: TRx volume per rep, NRx share, market share within targeted physician decile, formulary win rate, payer access coverage, Tier 1 call frequency, sample-to-script conversion, MSL engagement lift, and rep-to-quota attainment. Weighting favored leading indicators (NRx share, Tier 1 frequency, payer access) over lagging volume metrics, because launch windows and PBM cycles compress the time available to correct course.
We deliberately ignored soft engagement metrics like rep satisfaction scores, brand-awareness surveys, and digital click-through rates, since none reliably predict script movement in a regulated multi-stakeholder sale. We also excluded gross call volume without decile weighting, because a rep can hit 10 calls per day on low-decile prescribers and still miss quota. Compliance flags were treated as hygiene, not performance KPIs.
Related questions
What is the single most predictive KPI for a pharmaceutical launch?
NRx share within the rep's targeted physician decile is the strongest leading indicator. It isolates rep effectiveness from market effects and shows whether the field is winning the next prescribing decision rather than riding refills. Launch-year specialty reps should target 10-18% NRx share inside their call list; established brands run 35-55%. Falling NRx share two quarters running is a re-forecast trigger.
How does payer access coverage change field quota expectations?
Below 65% of covered lives with unrestricted or Tier 2 access at launch, the field cannot make quota regardless of call activity, because too many scripts abandon at the pharmacy counter. Commercial leaders should set quota against realized access, not contracted access. A top-3 PBM loss can strip 25-40% of covered lives in one P&T cycle and force immediate territory re-forecasting.
Why is sample-to-script conversion a trap KPI?
Gross sample-to-script conversion rewards reps who drop samples only on already-converted prescribers, producing 50%+ ratios with zero incremental TRx. The fix is matched-pair attribution against NRx lift, not gross conversion. Primary care benchmarks run 22-30%; specialty 35-45%. Anything above 40% in primary care usually signals sample spraying rather than productive new-patient starts.
How should MSL engagement be measured commercially?
Track scientific exchange touches per Tier 1 KOL per year, typically 4-6, and downstream NRx lift from engaged KOLs versus matched-pair controls. AbbVie and Vertex measure 8-15% NRx lift from sustained MSL engagement on specialty molecules. Attribution runs quarterly through commercial analytics. Treating MSL activity as soft ignores one of the few legal channels for deep clinical data discussion.
What does a healthy rep-to-quota attainment distribution look like?
Aim for 60-70% of the field at 90-110% attainment, 15-20% above 110%, and 10-15% below 90%. A district where 40%+ of reps fall below 90% is a quota-setting problem, not a performance problem. Pharma comp plans typically run 70/30 base/bonus with accelerators above 100%. Two consecutive trailing quarters trigger territory realignment review.
How often should TRx and NRx data refresh in 2027?
Weekly, landing every Tuesday for the prior week from IQVIA Xponent or Symphony Health PHAST. Field leadership reviews territory-level TRx, NRx, and market share with district managers in that cycle. Daily cadence covers only call counts and sample drops. Monthly consolidates payer access, speaker programs, and MSL touches. Quarterly runs full QBRs, comp finalization, and payer cycle reviews.
What is the biggest failure mode in pharma KPI reporting?
Riding inherited territory volume instead of working the deciles. A rep hits TRx quota on refills without moving NRx share, then the territory collapses when refills erode or a competitor launches. The fix is non-substitutable NRx share and Tier 1 call frequency KPIs that cannot be satisfied by incumbent volume. Twelve months of clean TRx can mask a broken call cohort.
How does decile targeting shape rep deployment math?
IQVIA and Symphony segment prescribers into deciles 1-10 by historical writing volume. Reps deploy against decile 7-10 prescribers in their therapeutic class, because roughly 20% of HCPs write 70-80% of molecule volume. Reach and frequency are the operational KPIs, but the underlying math is decile concentration. Miss the deciles and the launch S-curve never bends.
FAQ
How many calls per day should a pharma rep make in 2027?
Primary care: 8-10 in-person calls per day plus 4-6 virtual touches. Specialty: 5-7 in-person calls per day given longer dwell time and travel between offices. Oncology and rare disease: 3-5 calls per day, often with deeper KOL conversations. Hybrid models post-2023 have permanently shifted 20-30% of total touches to virtual, particularly for Tier 2-3 HCPs.
What is the right ratio of reps to KAMs to MSLs on a specialty launch?
For a specialty launch with 40,000-80,000 target patients, a typical deployment is roughly 100-180 sales reps, 25-40 KAMs covering top IDNs and payers, and 30-60 MSLs aligned to KOLs and treating institutions. Vertex and Regeneron run leaner; big pharma typically runs heavier on reps. The ratio shifts toward KAMs and MSLs as the indication becomes more specialty.
How is sample compliance tracked under the PDMA in 2027?
Every sample drop requires a signature capture on the rep iPad through Veeva CLM or equivalent, reconciliation against inventory, and periodic audits. PDMA limits samples to licensed prescribers, requires record retention for two years, and mandates storage and handling controls. Open Payments reporting adds annual transparency filings. Non-compliance triggers warning letters and can suspend the entire sample program for a brand.
What is a realistic NRx share target in launch year one?
Primary care launches should target 18-25% NRx share within 12 months. Specialty launches with narrower indications target 25-40%. Outlier ceilings exist: Lilly's Mounjaro hit 50%+ NRx share in new GLP-1 starts inside 18 months. The reportable benchmark is NRx share trending +1 to +2 points per quarter during the launch window, not a single-point target.
How do formulary wins translate into field quota?
A national brand needs 70-80% of Tier 2 placements and 40-55% of Tier 1 preferred slots to hit forecast. Each formulary win expands covered lives, which expands the addressable script base, which raises quota. Losing a top-3 PBM is a re-forecast event. Commercial leadership reviews formulary win rate quarterly with KAMs and contracting, separate from field execution reviews.
What is the benchmark for Tier 1 call frequency?
Primary care: 4-6 calls per quarter on Tier 1 (decile 9-10) targets, 2-4 on Tier 2. Specialty: 8-12 calls per year on Tier 1 KOLs with longer dwell time. Veeva CRM is the system of record, pulled against territory call plans every Monday. Reps below 70% plan attainment on Tier 1 frequency by end of Q2 are flagged for performance improvement regardless of TRx.
How is MSL engagement-to-prescribing lift actually measured?
Commercial analytics runs matched-pair designs comparing NRx lift from KOLs with sustained MSL engagement against demographically matched controls without engagement. AbbVie and Vertex measure 8-15% NRx lift on specialty molecules. ZS Associates and IQVIA both publish attribution methodologies. The KPI is quarterly, not weekly, because the sample size per KOL cohort is small.
What triggers a territory realignment in pharma sales?
Two consecutive quarters of trailing quota attainment, a major payer access change, a competitor launch into the same decile cohort, or a portfolio change from an acquisition or divestiture. Realignment decisions get teed up in quarterly business reviews and executed in the next planning cycle. Reps typically receive 60-90 days notice before territory boundaries change.
How does hybrid virtual selling change the KPI stack?
Virtual touches now count toward reach and frequency, but with lower weight than in-person calls in most commercial models. AstraZeneca and Lilly run hybrid deployment where virtual reps cover Tier 2-3 HCPs that in-person reps cannot reach at 4+ frequency. The KPI stack adds virtual reach, email open-to-detail conversion, and rep-led webinar attendance alongside traditional call metrics.
What is the 30/60/90 day priority for a new commercial leader?
Days 1-30: audit Veeva CRM data quality against IQVIA Xponent, reconcile decile assignments, and ride along with 8-12 reps. Days 31-60: build a single weekly KPI scorecard across all nine KPIs, run matched-pair sample attribution, and put bottom-quartile Tier 1 reach reps on coaching plans. Days 61-90: run the first full QBR against the new scorecard and pressure-test the launch forecast.
Sources
- https://www.iqvia.com/solutions/commercialization
- https://www.veeva.com/products/crm/
- https://www.symphonyhealth.com/
- https://www.komodohealth.com/
- https://www.zs.com/solutions/commercial-strategy
- https://www.phrma.org/code-on-interactions-with-health-care-professionals
- https://oig.hhs.gov/compliance/physician-education/
- https://openpaymentsdata.cms.gov/
- https://www.mmitnetwork.com/
- https://www.fda.gov/drugs/drug-approvals-and-databases/drugs-fda-approved-databases
Related on PULSE
- [More sales kpis for commercial pharmaceutical sales rankings and buying guides](/knowledge)
- [PULSE Tools and calculators](/tools)
- [Everything on PULSE RevOps](/)
This page will be disappearing soon. Save it to your device for $1 — or read it free while it is here.
@Kory-White- · if Venmo asks, the last 4 of my number are 2012
 pulse-industry-kpisTop 10 KPIs for Boutique Fitness Studios in 2027
 pulse-industry-kpisTop 10 KPIs for Residential Cleaning Companies in 2027
 pulse-industry-kpisTop 10 Sales KPIs for Commercial Locksmith & Access Control Services in 2027
 pulse-industry-kpisTop 10 Sales KPIs for Cybersecurity Software in 2027
 pulse-industry-kpisTop 10 KPIs for Bars and Pubs in 2027
 pulse-industry-kpisTop 10 KPIs for Driving Schools in 2027
 pulse-industry-kpisTop 10 Sales KPIs for Commercial B2B SaaS in 2027
 pulse-industry-kpisTop 10 Sales KPIs for Commercial Physical Therapy Clinic in 2027
 pulse-industry-kpisTop 10 KPIs for General Contractors in 2027
 pulse-industry-kpisTop 10 KPIs for Florists in 2027