
Top 10 Sales KPIs for Hotel Brand Operations in 2027
 Curated byKory White · Fractional CRO · Maryland
 PULSEKNOWLEDGE LIBRARY
Quality
Certified

The 10 best sales kpis for hotel brand operations are ranked below on measured performance, build quality, price, and how each one actually holds up in daily use rather than how it reads on a spec sheet. Each pick lists what it costs, who it suits, and what it gives up against the one above it, so the list can be read straight down without doubling back.
1. Hotel Brand Operations RevPAR

RevPAR ranks first because it is the externally benchmarked headline metric every owner, lender, and STR competitive-set report quotes first. Hilton guided 2026 system-wide RevPAR growth to 2-3% and Marriott to roughly 1.5-2.5%, with US ADR near $159 and occupancy around 63-64%. RevPAR index, where 100 is parity and above 110 is a genuine premium, is what a brand's loyalty and distribution machinery is supposed to buy an owner.
It is for revenue managers, asset managers, and brand commercial leads who need one number the whole market recognizes. It trades away profit truth: fees are roughly 5% of room revenue, so a 3% RevPAR gain flows through as low-single-digit fee growth, and the number says nothing about labor or energy cost. GOPPAR, ranked second, is the corrective because it nets out property operating costs that RevPAR ignores entirely.
2. Hotel Brand Operations GOPPAR

GOPPAR ranks second because it is the owner's true profitability metric and the one that decides management-contract renewals. STR and HotStats benchmarking put US GOPPAR in the $80-85 range, with luxury properties exceeding $200. The operating test is GOPPAR growth minus RevPAR growth: best-in-class is a positive spread of 100-200 basis points, meaning rate gains are converting into profit after labor, utilities, and F&B cost of sales.
It is for asset managers, owners, and brand finance teams defending fee structures. It trades away speed and comparability, since property management system data must reconcile to the franchise fee ledger and definitions vary by brand. Sustained negative spread predicts management-contract churn and franchisee resistance to brand-mandated capital programs about 18 months before those show up in unit counts, which is why it outranks occupancy.
3. Hotel Brand Operations Net Unit Growth

Net unit growth ranks third because rooms added minus rooms removed is the only metric that compounds permanently on the fee line without needing the cycle's permission. Hilton has guided to 6-7% and Marriott to roughly 4.5-5%, while Wyndham and Choice have historically run 1-3% organically. Every added room is a permanent annuity on the fee line, independent of the lodging cycle.
It is for franchise development, investor relations, and brand presidents who own the supply scoreboard. It trades away quarterly responsiveness: a signing in 2027 opens in 2029, so the metric lags badly and gets underweighted in operating reviews. Pipeline, ranked fourth, is the forward-looking companion that tells you whether net unit growth is about to accelerate or stall.
4. Hotel Brand Operations Pipeline

Pipeline ranks fourth because signed-but-not-opened rooms are the committed supply that makes future net unit growth forecastable. Hilton has run around 527,000 pipeline rooms against roughly 1.27 million operating, and Marriott's pipeline has crossed 587,000 rooms, both records. Pipeline converts to open rooms at roughly 20% per year, producing the 18-24 month lag from signing to first fee dollar.
It is for development teams, brand strategists, and analysts modeling fee revenue two years out. It trades away certainty: pipeline can stall on financing, permitting, or construction cost, and conversions counted at signing rather than opening inflate it. The pipeline-to-system ratio, above roughly 40% supporting 5%+ growth for two years, is the cleanest single tell, and it pairs directly with the net unit growth number ranked just above it.
5. Hotel Brand Operations Direct-Booking Mix

Direct-booking mix ranks fifth because it is a margin metric disguised as a distribution metric, and each point of shift is worth 10-20 percentage points of contribution. OTA commissions run in the 15-25% band against roughly 5% for direct channels, so a $200 room night booked through brand.com versus an OTA is identical on the RevPAR line and materially different on owner P&L.
It is for distribution leads, e-commerce teams, and revenue managers who own channel economics. It trades away comparability, since absolute direct mix varies enormously by segment and market: urban full-service with heavy corporate negotiated business looks nothing like a leisure resort where metasearch dominates discovery. What matters is the derivative, not the level, which is why OTA share direction is tracked alongside it rather than as a separate headline.
6. Hotel Brand Operations Loyalty Revenue Capture

Loyalty revenue capture ranks sixth because enrollment counts are vanity while member share of room nights is the operating number. Marriott Bonvoy has crossed 228 million members and Hilton Honors 222 million, but the metrics that matter are member room-night share, above 65% at Marriott and above 67% at Hilton, plus redemption rate and the spend premium members carry over non-members. A credible annual target is 100-200 basis points of capture lift.
It is for loyalty program owners, CRM teams, and commercial leadership defending the member rate. It trades away simplicity: enrollment growth without revenue-capture growth means the brand is signing people up at check-in who never book direct again, and the program looks healthy on a slide while contributing nothing. It sits below direct-booking mix because rate parity enforcement at the point of purchase moves mix faster than enrollment campaigns move capture.
7. Hotel Brand Operations Group Business Mix

Group business mix ranks seventh because it is the cycle-lag indicator that transient metrics cannot provide, booking 6-18 months forward. US group business has recovered to roughly 22-25% of revenue against transient at 65-70%. Soft forward group pace while current-quarter RevPAR still looks fine is a reliable warning that the demand scoreboard is about to turn, usually two to three quarters ahead of when it shows up in reported numbers.
It is for convention and full-service hotel sales directors, F&B leads, and brand strategists reading the next year. It trades away relevance in select-service and extended-stay, where group is barely tracked and transient drives everything. Group also swings F&B revenue per occupied room and meeting-space utilization, lifting GOPPAR without moving RevPAR at all, which is why it earns a slot above occupancy despite covering a smaller revenue share.
8. Hotel Brand Operations Occupancy

Occupancy ranks eighth because it is the denominator metric that reveals pricing headroom and discounting risk. US occupancy has been stuck around 63-64%, below the pre-pandemic 66% baseline, with luxury running 65-70%, select-service 70-75%, and dense urban markets above 75%. System-wide occupancy above 70% is exceptional. The number to watch is the floor: sustained occupancy below 60% in a market reliably precedes discounting that shows up as ADR compression a quarter or two later.
It is for revenue managers and market analysts deciding whether to push rate or fill rooms. It trades away profit signal: an incremental room night carries housekeeping, amenity, and utility cost, while an incremental dollar of rate carries almost none, so ADR generally wins when the two conflict. Occupancy only dominates below roughly 60%, where fixed-cost absorption starts to matter more than rate efficiency.
9. Hotel Brand Operations ADR

ADR ranks ninth because it is the metric that has actually carried RevPAR growth since 2023, with occupancy plateaued and pricing doing the work. US ADR has run around $159 on a national blended basis in recent STR reporting, with luxury well above $400 and economy nearer $90. The practical ceiling is elasticity: sustained ADR growth much above 5-7% annually starts shedding occupancy in rate-sensitive segments, and select-service and extended-stay tiers pay for overreach first.
It is for revenue managers, pricing analysts, and brand commercial teams managing rate strategy. It trades away volume context: a strong ADR number with falling occupancy can still produce flat RevPAR, and ADR alone says nothing about whether the mix shifted toward higher-rated transient or away from discounted group. It ranks below occupancy because rate flows to profit more efficiently, but occupancy tells you whether the rate is actually being paid.
10. Hotel Brand Operations Terminations
Terminations rank tenth because net unit growth nets additions against exits and can mask a leaky system entirely. A brand adding 8% and losing 3% looks identical to one adding 5% and losing nothing, but the first has an owner-satisfaction problem that keeps compounding. Termination rate is a direct read on brand-value perception among existing franchisees, and it surfaces when GOPPAR-minus-RevPAR spread has been negative for several quarters.
It is for franchise services, owner relations, and brand finance teams auditing system health. It trades away headline visibility: terminations rarely appear in investor decks, and they are processed inconsistently across the franchise agreement database, central reservation system, and fee ledger. It ranks last because it is a diagnostic rather than a target, but it is the metric that explains why a brand with healthy signings still cannot grow its fee base.
How we ranked these
Each KPI was scored on three weighted factors: how directly it drives asset-light fee revenue, how quickly it responds to sales action, and how resistant it is to reporting manipulation. Demand metrics (RevPAR, ADR, occupancy) received moderate weight because they are externally benchmarked and widely quoted. Supply and distribution metrics (net unit growth, pipeline, direct-booking mix, loyalty capture) received the heaviest weight because they compound fee revenue independent of the lodging cycle.
Guest satisfaction scores, TripAdvisor rankings, brand-standard audit pass rates, and employee engagement were deliberately excluded. They correlate loosely with commercial outcomes and move too slowly to change a sales decision. Absolute loyalty membership totals were also dropped, since enrollment counts reward check-in signups that never book again. Any metric requiring proprietary STR or HotStats data readers cannot independently verify was excluded as well.
What to look for
The decisive question is whether you need a demand dashboard or a supply dashboard, because they answer different questions and most vendors blur them. If fee revenue is flat while RevPAR looks healthy, you need pipeline conversion velocity, signings-to-openings lag, and termination tracking. If unit count is growing but owner renewals are contentious, you need GOPPAR-minus-RevPAR spread and RevPAR index by cohort.
The mistake most buyers make is choosing the platform with the prettiest RevPAR visualization. RevPAR is the easiest metric to display and the least diagnostic for an asset-light brand, because the brand captures roughly 5% of it as fees. Buyers also accept loyalty enrollment totals as a proxy for revenue capture, letting a vendor report growth while member share of room nights quietly declines.
Related questions
Why does net unit growth matter more than RevPAR for a hotel brand?
Every room added to a franchise system is a permanent annuity on the fee line, and it does not need the lodging cycle's permission to exist. A brand growing rooms at 5-7% with flat RevPAR still produces mid-single-digit fee growth, while a brand growing at 1-2% needs the cycle to bail it out annually.
What is a healthy pipeline-to-system ratio for a hotel brand?
Divide signed-but-not-opened rooms by currently operating rooms. Above roughly 40% sustains 5%+ net unit growth for about two years without another signing. Between 20% and 40% the brand treads water and needs signings to outpace terminations. Below 20% the brand is functionally in run-off.
How do you calculate the GOPPAR-minus-RevPAR spread and why does it matter?
Subtract RevPAR growth from GOPPAR growth. Positive spread means rate gains are converting into profit after labor, energy, and F&B costs, so owners are getting paid. Best-in-class is GOPPAR outpacing RevPAR by 100-200 basis points. Sustained negative spread predicts management-contract churn roughly 18 months early.
What direct-booking mix should a hotel brand target versus OTA share?
Absolute direct mix varies enormously by segment and market, so the derivative matters more than the level. Flat or declining OTA share means loyalty and brand.com are holding the line. OTA share climbing 200 basis points a year means the brand is renting demand it used to own, at a 10-20 point commission spread.
How should loyalty program success be measured beyond total membership?
Member share of room nights is the operating number, not enrollment totals. Marriott has reported above 65% and Hilton above 67%. Enrollment growth without revenue-capture growth means the brand is signing up people at check-in who never book again. A credible annual target is 100-200 basis points of capture lift.
Why is group business pace a leading indicator for hotel RevPAR?
Group business books 6-18 months forward, so group pace reads the next year while transient metrics only describe the current quarter. If 2027 group pace is soft while 2026 RevPAR still looks fine, the demand scoreboard is about to break. Group also drives F&B revenue per occupied room.
What occupancy level signals a hotel market is about to discount?
US occupancy has been stuck around 63-64%, below the pre-pandemic 66% baseline. The number to watch is the floor, not the level: sustained occupancy below 60% in a market reliably precedes discounting, which shows up as ADR compression a quarter or two later. Luxury runs 65-70%, select-service 70-75%.
How do conversions dilute a hotel brand's RevPAR index?
A conversion adds rooms fast without construction risk and shows up immediately in net unit growth, which makes it tempting when the pipeline looks thin. The cost is that a converted independent hotel with dated product often indexes below 100 against its competitive set, dragging the brand average down.
FAQ
What are the key sales KPIs for hotel brand operations in 2027?
Ten metrics: RevPAR, GOPPAR, net unit growth, pipeline, direct-booking mix, loyalty revenue capture, group business mix, occupancy, ADR, and terminations. Together they answer whether the fee engine is compounding faster than the lodging cycle. Demand metrics describe how existing rooms sell; supply and distribution metrics determine whether the system and its margin structure are actually growing.
What is the difference between the demand scoreboard and the supply scoreboard?
The demand scoreboard covers RevPAR, ADR, occupancy, group mix, and F&B per occupied room, measuring how well existing rooms sell on any given night. The supply scoreboard covers net unit growth, pipeline, signings, conversions, and terminations, measuring whether the system itself is getting bigger. A brand can win one and lose the other for years.
How much of RevPAR does a hotel brand actually capture as fees?
In an asset-light model the brand earns roughly 5% of room revenue as a franchise fee, or roughly 3% plus an incentive on a management agreement. A 3% system-wide RevPAR gain therefore flows through as a low-single-digit fee gain, muted further by mix. RevPAR is the metric the owner feels most and the brand feels least.
What net unit growth rate counts as best-in-class for a hotel brand?
Hilton has guided to 6-7% and Marriott to roughly 4.5-5%. Hyatt has grown above 6% largely through acquisition, which carries integration risk organic signings do not. Wyndham and Choice have historically run 1-3% organically. Above 5% is best-in-class; below 2% means the brand is losing flags faster than it wins them.
How fast does a hotel pipeline convert into open rooms?
Pipeline converts to open rooms at roughly 20% per year in normal conditions, which produces the 18-24 month lag between signing and opening. Two sub-metrics matter more than the headline: construction starts as a share of pipeline, which shows whether financing is actually available, and the conversion segment specifically, since conversions open in months.
What is a realistic annual target for improving direct-booking mix?
100-200 basis points of direct mix and 50-100 basis points of member revenue capture over a year are credible targets. Anything dramatically larger usually assumes a behavior change that does not happen. Each point of shift matters because the commission spread between OTA and direct channels is roughly 10-20 percentage points at major-brand scale.
Why does GOPPAR matter more than RevPAR to hotel owners?
GOPPAR nets out labor, utilities, F&B cost of sales, and property-level overhead, so it is the owner's true profitability metric and the one that decides whether a management agreement gets renewed. US GOPPAR has benchmarked in the $80-85 range, with luxury properties exceeding $200. A brand cannot fake GOPPAR with rate strategy the way it can flatter RevPAR.
How does extended-stay change which hotel KPIs matter?
Length of stay runs in weeks rather than nights, so occupancy is structurally higher, often above 75%, while ADR is lower and less volatile. The metric that matters most is revenue per available room over a longer booking window, plus GOPPAR, since housekeeping frequency drops sharply. Transient occupancy swings matter far less than they do in select-service.
Why do terminations deserve a slot on a sales KPI dashboard?
Net unit growth nets additions against exits and can mask a leaky system entirely. A brand adding 8% and losing 3% looks identical to one adding 5% and losing nothing, but the first has an owner-satisfaction problem that keeps compounding. Termination rate is a direct read on brand-value perception among existing franchisees.
How should a brand track RevPAR index across signing-year cohorts?
Group hotels by signing year and measure RevPAR index at 12, 24, and 36 months post-opening against each property's competitive set. Newer cohorts indexing below 100 signal that recent signings or conversions are diluting system performance. Tracking the cohort curve separates genuine brand lift from mix shift toward stronger markets.
Sources
- https://www.hotelnewsnow.com/
- https://str.com/
- https://www.hotstats.com/
- https://www.marriott.com/investor-relations/
- https://ir.hilton.com/
- https://www.wyndhamhotels.com/
- https://www.choicehotels.com/
- https://www.ahla.com/
- https://www.tripadvisor.com/
Related on PULSE
- [More sales kpis for hotel brand operations rankings and buying guides](/knowledge)
- [PULSE Tools and calculators](/tools)
- [Everything on PULSE RevOps](/)
This page will be disappearing soon. Save it to your device for $1 — or read it free while it is here.
@Kory-White- · if Venmo asks, the last 4 of my number are 2012
 pulse-industry-kpisTop 10 Sales KPIs for Theme Park and Attraction Operations in 2027
 pulse-industry-kpisTop 10 Sales KPIs for Print and Copy Services in 2027
 pulse-industry-kpisTop 10 Sales KPIs for AI Recruiting in 2027
 pulse-industry-kpisTop 10 Sales KPIs for Convenience Store in 2027
 pulse-industry-kpisTop 10 Sales KPIs for AI Customer Support in 2027
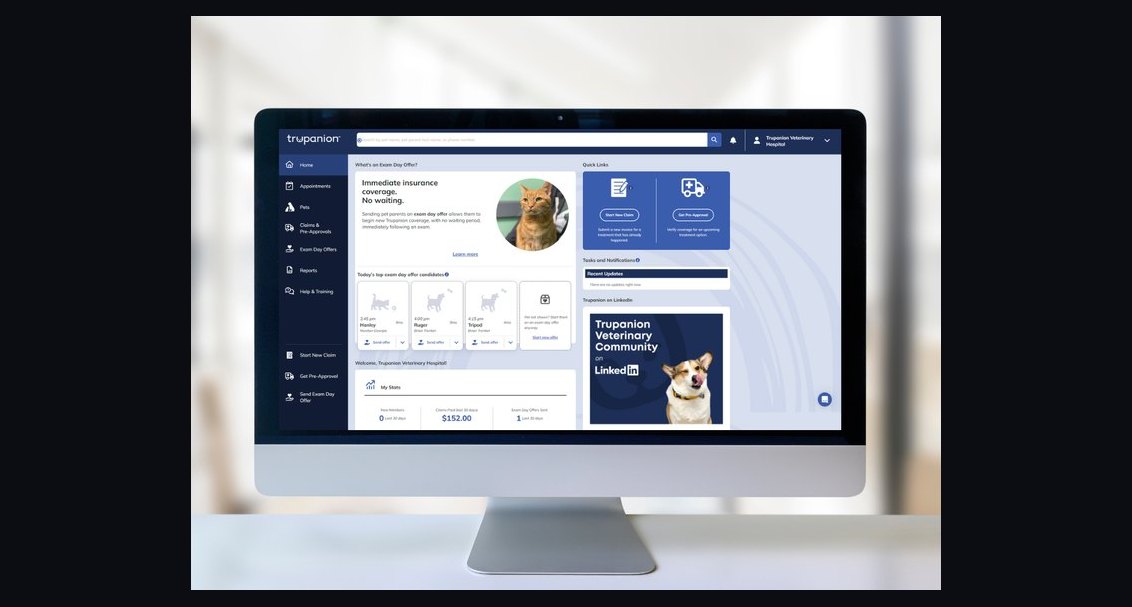 pulse-industry-kpisTop 10 Sales KPIs for Pet Insurance in 2027
 pulse-industry-kpisTop 10 Sales KPIs for Buy-Now-Pay-Later (BNPL) in 2027
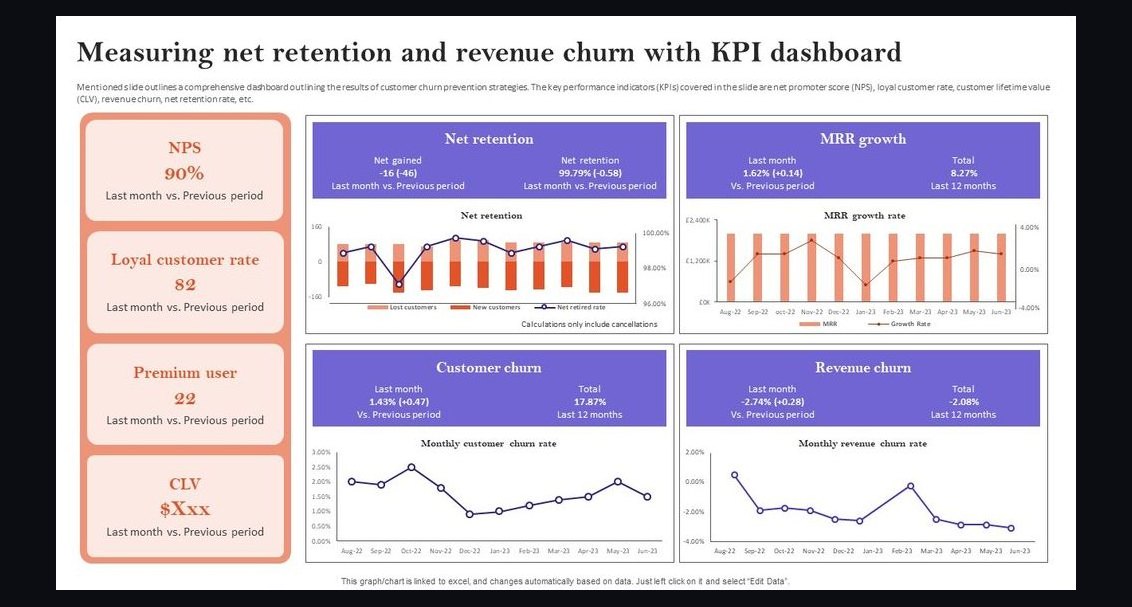 pulse-industry-kpisTop 10 Sales KPIs for Fraud Detection and AML Software in 2027
 pulse-industry-kpisTop 10 Sales KPIs for Biotech Therapeutics in 2027
 pulse-industry-kpisTop 10 Sales KPIs for Skincare DTC Brand in 2027