
Top 10 KPIs for Independent Restaurants in 2027
 Curated byKory White · Fractional CRO · Maryland
 PULSEKNOWLEDGE LIBRARY
Quality
Certified
The 10 best kpis for independent restaurants are ranked below on measured performance, build quality, price, and how each one actually holds up in daily use rather than how it reads on a spec sheet. Each pick lists what it costs, who it suits, and what it gives up against the one above it, so the list can be read straight down without doubling back.
1. Independent Restaurant Prime Cost

Prime cost ranks first because it is the single composite number that determines whether an independent restaurant survives 2027. Food plus labor should hold between 55-65% of sales, and anything above 65% leaves nothing for rent, utilities, or profit. Sweetgreen and Chipotle both ran roughly 55% in 2024, while Texas Roadhouse sat near 67%.
This metric is for operators who already track food and labor separately and need the combined view. It trades away granularity, since a healthy prime cost can still hide a 38% food cost offset by cheap labor. Compared to food cost percentage directly below, prime cost is the harder ceiling and the one to lock first.
2. Independent Restaurant Food Cost Percentage
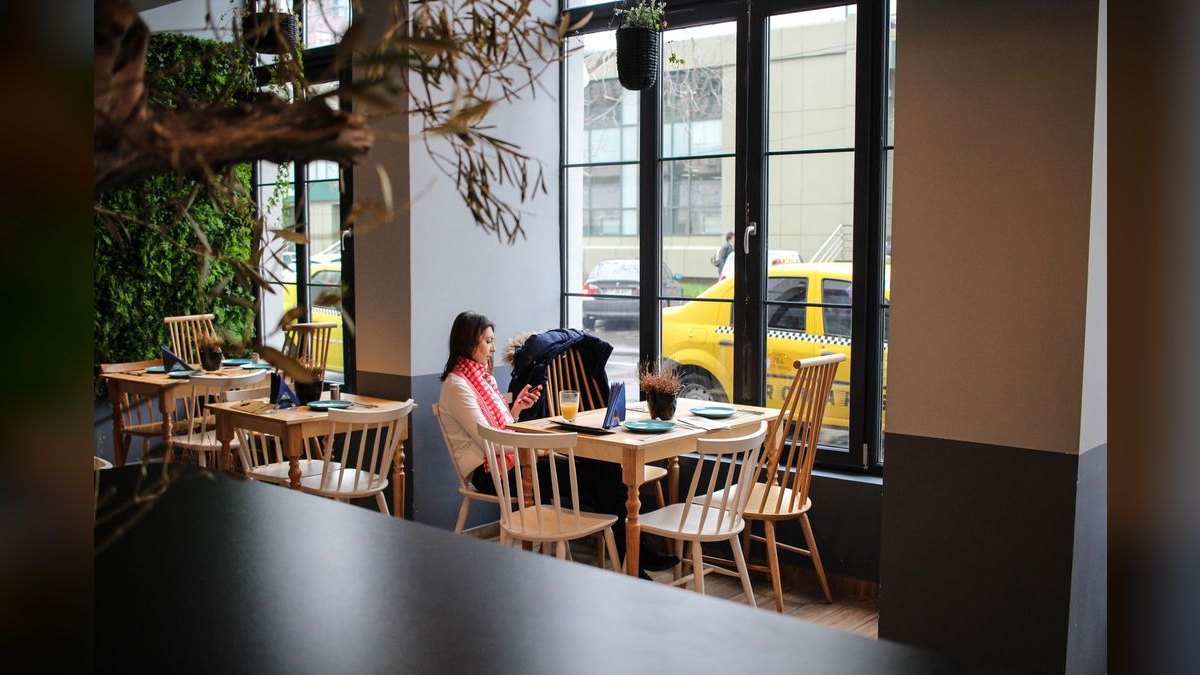
Food cost percentage ranks second because perishable inventory expires daily and sloppy tracking throws away $0.04-$0.07 of every sales dollar. The 2027 target band is 28-32% for most independents, with fine dining at 32-38% and pizza concepts at 22-28%. Sweetgreen disclosed 27.4% in its 2024 10-K.
This KPI suits operators running weekly true-inventory counts rather than monthly guesses. It trades away the labor picture, so a 30% food cost with 40% labor still fails. Compared to prime cost above, food cost is the more actionable weekly lever because menus and vendors can be adjusted within days.
3. Independent Restaurant Labor Cost Percentage
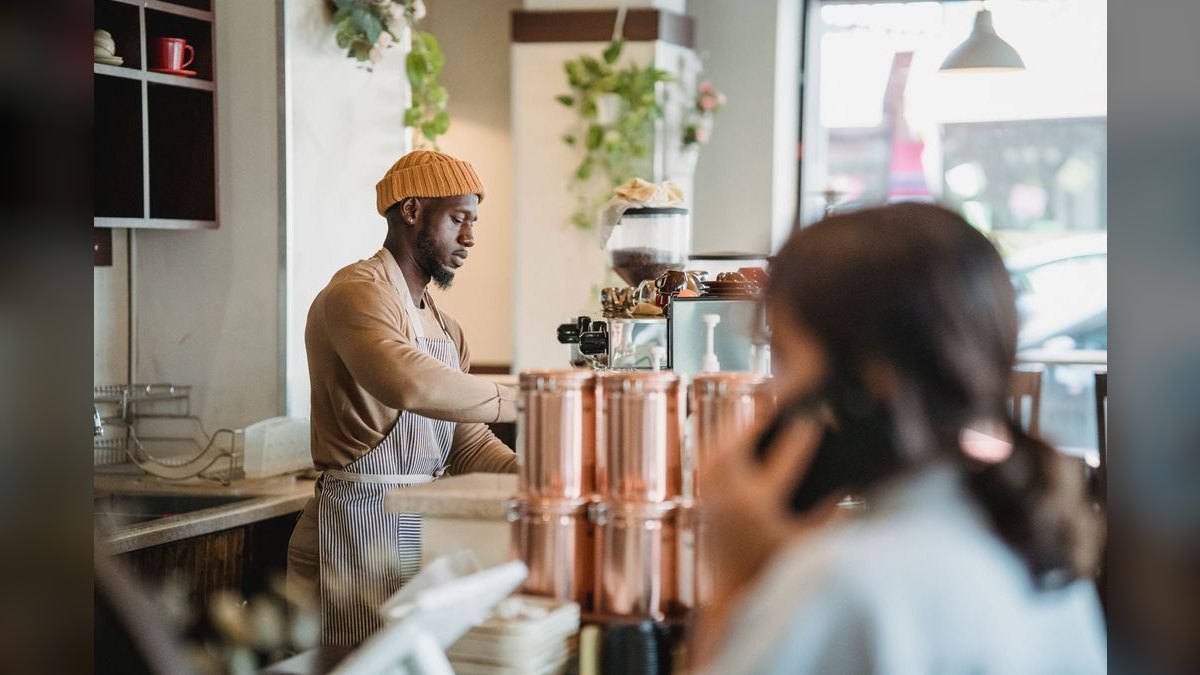
Labor cost percentage ranks third because hourly wages at $18-$24 in 2027 can blow up a P&L in one over-scheduled Saturday. Toast's 2026 payroll study put the full-service median at 36.5%, with profitable operators holding 34.2%. Healthy independents target 28-32% full-service and 20-25% quick service. Texas Roadhouse disclosed 33.4% in 2024.
This metric is for operators scheduling by forecasted covers rather than gut feel. It trades away the food side, so a 30% labor cost with 35% food cost still breaks the business. Compared to food cost above, labor is harder to cut mid-week because shift commitments and tip credits constrain rapid adjustment.
4. Independent Restaurant RevPASH
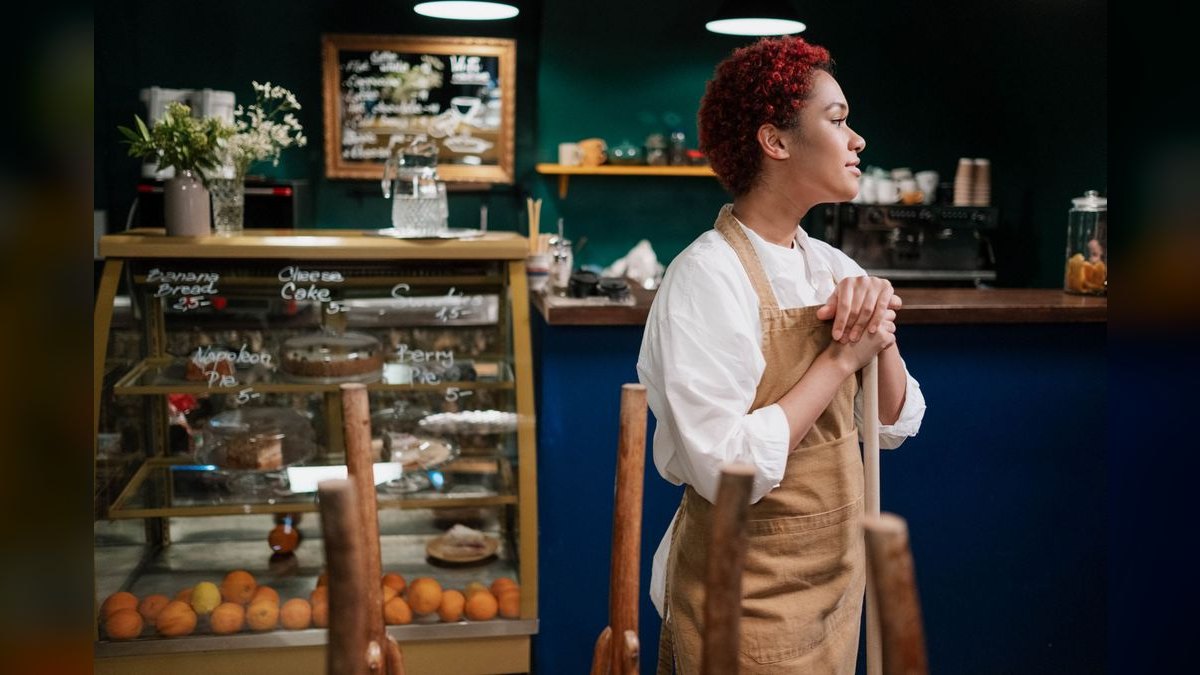
RevPASH ranks fourth because a 60-seat dining room open 8 hours has exactly 480 seat-hours of inventory that expire at midnight. Targets run $3-$6 for QSR, $7-$12 casual, and $15-$30+ fine dining. A 90-seat Manhattan bistro doing $12,000 in six service hours generates $22 RevPASH, top of the casual band.
This KPI is for operators who already track nightly revenue but cannot explain why two identical sales nights feel different. It trades away simplicity, since RevPASH requires accurate seat counts and effective service hours. Compared to labor cost above, RevPASH is the better composite for space efficiency but useless without reliable cover data.
5. Independent Restaurant Average Check

Average check ranks fifth because it drives revenue per cover and has risen 4-6% annually since 2023 per Black Box Intelligence. 2027 norms run $22-$35 casual, $40-$60 polished casual, and $95-$180+ fine dining. Cheesecake Factory disclosed roughly $28 in 2024, while Ruth's Chris runs $95-$110.
This metric is for operators who want a fast daily read on menu pricing and upsell performance. It trades away traffic context, since a rising check can mask declining covers. Compared to RevPASH above, average check is simpler but blind to seat utilization, making it a companion metric rather than a standalone one.
6. Independent Restaurant Table Turn Time
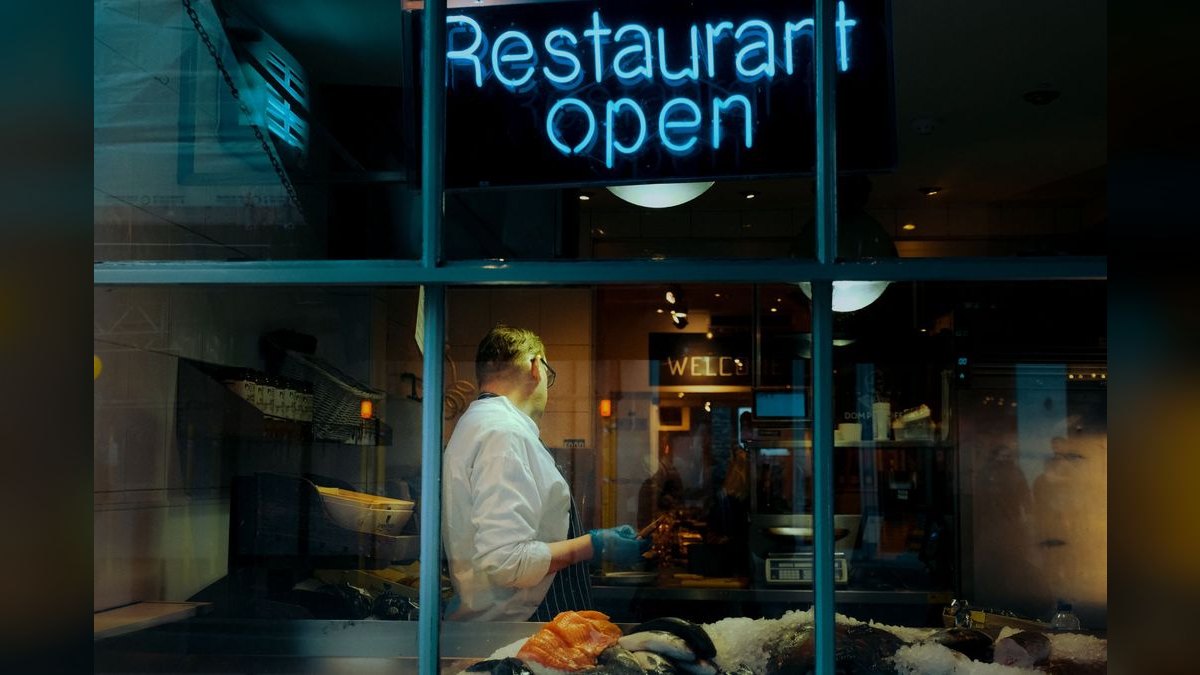
Table turn time ranks sixth because slow turns destroy RevPASH even when the check is healthy. The industry average is 3 turns per lunch and 2 per dinner, with fine dining at 1.5-2 and QSR effectively 6-10 through counter service. Chick-fil-A is cited at 120-130 cars per hour at peak drive-thru.
This KPI is for operators whose dining rooms feel full but whose nightly revenue underperforms. It trades away guest comfort, since aggressive turns can erode the experience regulars pay for. Compared to average check above, turn time is the throughput lever while check is the yield lever, and independents usually need both working together.
7. Independent Restaurant Customer Count
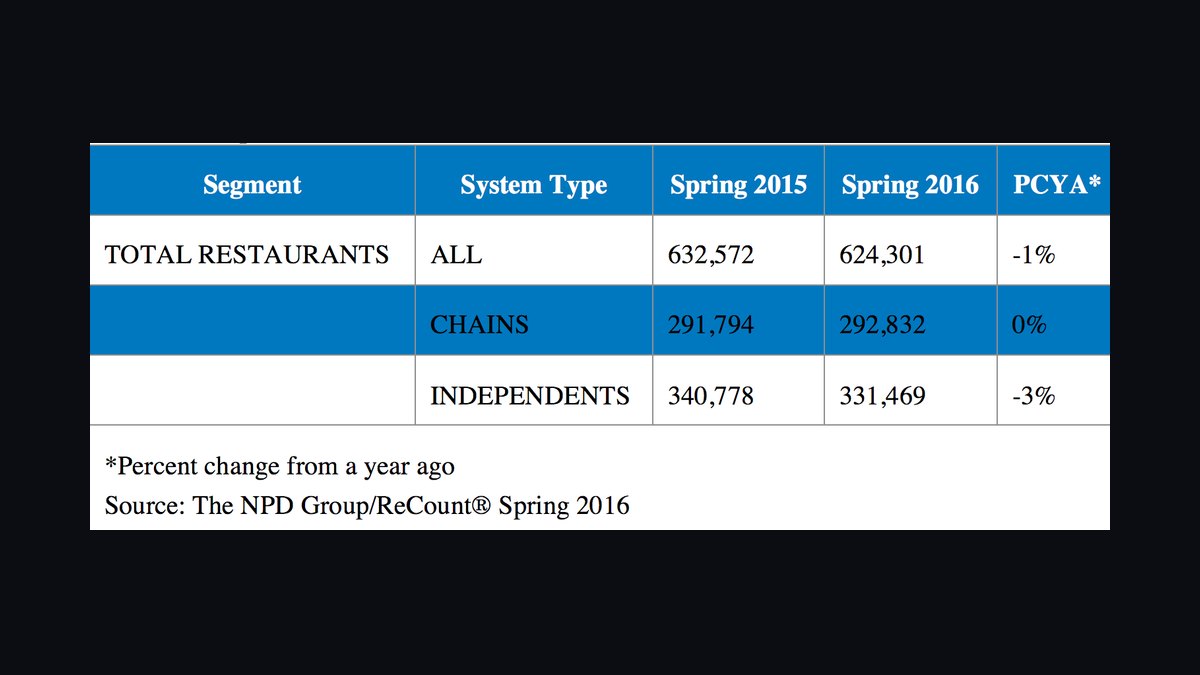
Customer count ranks seventh because it is the denominator behind almost every other KPI and the earliest warning of brand erosion. An 80-100 seat full-service casual independent needs 1,800-2,800 covers weekly, and below 1,500 the unit is structurally unprofitable. Olive Garden treats a 2-3% traffic decline as a recession signal.
This metric is for operators who chase average check while traffic quietly declines for six months. It trades away revenue context, since covers without check data say nothing about profitability. Compared to table turn time above, customer count is the demand measure while turns measure how efficiently that demand is served.
8. Independent Restaurant Delivery Mix
Third-party delivery mix ranks eighth because DoorDash, Uber Eats, and Grubhub take 15-30% commission and all-in costs reach 30-40% per order. The 2027 consensus cap is 15-20% of total sales per the Independent Restaurant Coalition. Wingstop kept third-party below 15% by pushing its own first-party app to roughly 70% digital.
This KPI is for operators who report gross delivery sales without netting platform fees. It trades away top-line vanity, since a $45 delivery ticket can carry 0-2% margin after packaging. Compared to customer count above, delivery mix is the margin-protection metric rather than the demand metric.
9. Independent Restaurant Repeat-Visit Rate

Repeat-visit rate ranks ninth because 65-80% of restaurant sales come from regulars and the healthy band is 30-40% per Restroworks retention studies. Below 20% is a red flag, and industry retention averages roughly 55% versus a 75% cross-industry benchmark. Starbucks Rewards drove about 60% of U.S. company-operated sales in 2024.
This KPI is for operators with POS-tied loyalty capturing phone, email, or card hash at every check. It trades away anonymity, since guests must be identified to be counted. Compared to delivery mix above, repeat-visit rate is the stability measure while delivery mix is the margin-leak measure.
10. Independent Restaurant Weekly P&L Close

Weekly P&L close ranks tenth because a 35-day monthly close means the bleeding already happened before anyone sees it. The 2027 minimum is a weekly close with true inventory bookends, since counting purchases as food cost understates the number by 2-4 points. Operators who close monthly are effectively flying blind through four weekends of losses.
This cadence suits owner-operators who can dedicate Monday mornings to reconciliation and vendor review. It trades away time, since weekly closes demand disciplined POS categories and consistent inventory counts. Compared to repeat-visit rate above, weekly P&L is the reporting discipline that makes every other KPI trustworthy.
How we ranked these
We ranked each KPI by how directly it moves cash margin for a single-unit independent in 2027, weighting weekly measurability, controllability by an owner-operator, and margin sensitivity. Prime cost, food cost %, labor cost %, and RevPASH carried the heaviest weight because they compress the entire P&L into numbers a 90-seat bistro can act on before month-end.
We deliberately ignored vanity metrics: social followers, app downloads, gross delivery sales, and generic SaaS-style dashboards. They are lagging, non-controllable, or mask negative-margin orders. We also excluded franchise-wide benchmarks that assume scale leverage, ad budgets, and commissary supply chains no independent has. Only metrics an operator can change within one scheduling cycle made the list.
What to look for
Choose KPIs by your concept's constraint, not by what a vendor dashboard displays. A 90-seat bistro with a 110-minute lunch turn should obsess over RevPASH and table turn time; a high-volume pizza shop should watch food cost % and third-party delivery mix. Match the metric to the bottleneck, then verify your POS can actually produce it weekly without manual spreadsheet surgery.
The mistake most buyers make is adopting nine KPIs at once and tracking none well. They buy a $300/month analytics tool, connect the POS, and never close the inventory bookend, so food cost reads 3 points low all year. Start with prime cost and covers, add RevPASH once inventory discipline holds, and only then layer loyalty and delivery mix.
Related questions
What is a good prime cost target for an independent restaurant?
Aim for 55-65% of sales, with full-service independents typically landing at 60-65% and quick service at 55-60%. Above 65%, there is essentially nothing left for rent, utilities, and profit. Track it weekly, not monthly, because a single over-scheduled Saturday can swing prime cost two points and quietly erase the month's margin.
How often should I count inventory to trust my food cost percentage?
Weekly, on a true bookend basis: beginning inventory plus purchases minus ending inventory, divided by food sales. Monthly counts let spoilage, over-portioning, and vendor price creep hide for 35 days. Operators who skip the bookend and count purchases as food cost understate the number by two to four points until year-end true-up wipes out reported profit.
What RevPASH should a casual independent target in 2027?
Casual dining typically targets $7-$12 per available seat hour, quick service $3-$6, and fine dining $15-$30 or higher. A 90-seat bistro open six effective service hours generating $12,000 nightly runs about $22 RevPASH, top of the casual band. Two restaurants with identical revenue can have radically different efficiency if seat counts differ.
Should I cap third-party delivery as a percentage of sales?
Yes, most operators cap DoorDash, Uber Eats, and Grubhub at 15-20% of total sales. Commissions run 15% basic, 25% standard, and 30% premium placement, with all-in cost often reaching 30-40% per order once marketing and processing stack. A $45 delivery ticket can leave zero to two percent margin, sometimes negative after packaging.
What repeat-visit rate signals a healthy independent restaurant?
A 30-40% repeat-visit rate is the healthy band, and below 20% is a red flag. Roughly 65-80% of restaurant sales come from regulars, so loyalty depth predicts top-line stability better than any single month's revenue. Without POS-tied identity capture, this metric stays dark, and you cannot tell whether Friday's dining room is regulars or one-time visitors.
How many table turns should lunch and dinner service produce?
Family restaurants average about three turns at lunch and two at dinner, fine dining targets 1.5-2 dinner turns, and quick service effectively runs 6-10 through counter service. A 110-minute casual lunch turn is not premium; it is a kitchen and front-of-house coordination failure that destroys RevPASH. Measure turns per shift, not just nightly revenue.
Why is average check a dangerous KPI to chase alone?
Pushing average check through menu price hikes without re-engineering menu architecture typically costs 3-4% of covers, making the move net-zero or net-negative. Black Box Intelligence data repeatedly shows operators who lose 2% or more in traffic rarely recover even with 5% menu price increases. Pair average check with customer count and repeat-visit rate before raising prices.
What reporting cadence should an independent restaurant run?
Daily at shift close: sales, covers, average check, labor hours versus forecast, voids, and delivery settlements. Weekly Monday: food cost %, labor cost %, prime cost, RevPASH by day-part, delivery mix, and cover trends. Monthly: full P&L, repeat-visit cohort, menu mix, and vendor price changes. Quarterly: menu engineering rebuild and staffing model reset.
FAQ
What is the most important single KPI for an independent restaurant?
Prime cost, the combined food and labor total, is the single most critical metric because it determines whether any margin remains for rent, utilities, and profit. Keep it at or below 65% of sales. Above that ceiling, no marketing campaign, loyalty program, or menu refresh can rescue the unit's economics.
How do I set realistic targets for food cost percentage?
Most independents should target 28-32% of sales, though fine dining with premium proteins runs 32-38% and pizza or pasta concepts can hold 22-28%. Track weekly on a true inventory basis, not monthly. Ingredient prices and waste shift fast, and a sloppy count hides two to four points of margin until the year-end true-up.
What is RevPASH and why does it matter?
RevPASH, revenue per available seat hour, divides total revenue by seats times operating hours. It combines occupancy and check size into one number, so a 60-seat room and a 120-seat room with identical nightly sales show radically different efficiency. Cornell's School of Hotel Administration originated it as the restaurant analog to hotel RevPAR.
How can I reduce third-party delivery mix without losing customers?
Cap delivery at 15-20% of sales, then push guests toward first-party ordering through your own website or app with a small direct-order incentive. Audit platform statements monthly to compute real all-in take rate, which often reaches 30-40% per order. Drop the lowest-margin tier or renegotiate before cutting the channel entirely.
What table turn time should a busy independent target?
Lunch should aim for about three turns and dinner for two in family and casual formats, while fine dining targets 1.5-2 dinner turns and quick service runs 6-10 through counter service. Benchmark against your own past performance by day-part, because a 110-minute casual lunch turn signals a kitchen and front-of-house coordination failure, not a premium experience.
How do I calculate repeat-visit rate and what should it be?
Divide guests who visited more than once in a 90-day window by total guests, then multiply by 100. Target 35% or higher. Repeat guests spend more per visit and cost less to acquire. Without POS-tied loyalty through Toast Rewards, Square Loyalty, or Thanx, the metric stays unmeasurable and the most predictive KPI goes dark.
Why do purchases-as-food-cost calculations fail?
Counting purchases as food cost skips the inventory bookend, so spoilage, over-portioning, and vendor price creep stay invisible until quarter-end. The number typically reads two to four points low, flattering the P&L. Weekly beginning inventory plus purchases minus ending inventory, divided by food sales, is the only figure an operator can trust for pricing and menu decisions.
How should tip-credit states report labor cost?
Book labor at the effective wage, not the direct cash wage. Operators in tip-credit states who use the direct wage convince themselves labor runs 22% when the true fully loaded figure is closer to 30%. Include payroll taxes, benefits, and workers' compensation. Toast's 2026 payroll study puts the full-service median at 36.5% of sales, with profitable operators at 34.2%.
What is the biggest mistake operators make with delivery revenue?
Treating third-party delivery revenue at dine-in margin. A $45 dine-in ticket and a $45 DoorDash ticket are not equivalent when the platform takes 30% and packaging adds cost, leaving zero to two percent margin, sometimes negative. Report delivery net of all-in platform cost, and never blend it into the same revenue line as dine-in sales.
How quickly should a new independent implement these KPIs?
Days 1-30: install a weekly P&L with true inventory bookend and clean POS categories. Days 31-60: build a RevPASH dashboard by day-part, audit delivery take rate, and launch POS-tied loyalty. Days 61-90: run menu engineering, adopt forecast-driven scheduling, and publish the first quarterly KPI scorecard with prime cost locked below 65%.
Sources
- https://restaurant.org/research-and-media/research/research-reports/state-of-the-industry/
- https://www.nrn.com/
- https://pos.toasttab.com/blog/on-the-line/restaurant-payroll-percentage
- https://www.restaurant365.com/blog/how-to-calculate-prime-cost-in-a-restaurant/
- https://www.7shifts.com/blog/restaurant-prime-cost/
- https://sha.cornell.edu/
- https://www.bakertilly.com/insights/prime-cost-target-tips
- https://www.touchbistro.com/blog/restaurant-benchmarks/
- https://www.blackboxintelligence.com/
- https://www.independentrestaurantcoalition.com/
Related on PULSE
This page will be disappearing soon. Save it to your device for $1 — or read it free while it is here.
@Kory-White- · if Venmo asks, the last 4 of my number are 2012
This page is gone.
This one is off the shelf now. $1 keeps it on your phone for good — the whole page, pictures and diagrams included.
 pulse-industry-kpisTop 10 Sales KPIs for Skincare DTC Brand in 2027
 pulse-industry-kpisTop 10 Sales KPIs for Wine and Spirits Distribution in 2027
 pulse-industry-kpisTop 10 Sales KPIs for Auto Insurance Carriers in 2027
 pulse-industry-kpisTop 10 Sales KPIs for Fraud Detection and AML Software in 2027
 pulse-industry-kpisTop 10 Sales KPIs for Biotech Therapeutics in 2027
 pulse-industry-kpisTop 10 Sales KPIs for Commercial Building Energy Management Systems in 2027
 pulse-industry-kpisTop 10 Sales KPIs for Specialty Animal Feed & Nutrition Distribution in 2027
 pulse-industry-kpisTop 10 Sales KPIs for AI Observability Platform in 2027
 pulse-industry-kpisTop 10 Sales KPIs for Architectural Curtain Wall Engineering & Fabrication in 2027
 pulse-industry-kpisTop 10 Sales KPIs for Commercial Trailer Dealership in 2027