
Top 10 KPIs for Dental Practices in 2027
 Curated byKory White · Fractional CRO · Maryland
 PULSEKNOWLEDGE LIBRARY
Quality
Certified

The 10 best kpis for dental practices are ranked below on measured performance, build quality, price, and how each one actually holds up in daily use rather than how it reads on a spec sheet. Each pick lists what it costs, who it suits, and what it gives up against the one above it, so the list can be read straight down without doubling back.
1. Production Per Chair Per Hour

Production per chair per hour ranks first because the chair, not headcount, is the fixed-capacity revenue engine of any dental practice. A healthy 2027 general practice targets $550-$650 per hour; implant and cosmetic-heavy offices push $750-plus, while anything under $400 signals fee-schedule or scheduling failure. Empty chair time at roughly $600 per hour in production is gross margin leaving the building permanently.
This KPI is for owner-dentists and office managers running three to five operatories who can act on same-day schedule gaps. It trades away nothing except the comfort of monthly reporting, since it must be read weekly to matter. It outranks case acceptance only because no diagnosis converts if the chair never gets filled in the first place.
2. Case Acceptance Rate

Case acceptance rate ranks second because it is the single largest controllable variable in dental economics. The national average sits near 61%, top-decile practices reach 85-90%, and anything below 55% is a treatment-presentation problem rather than a patient-affordability problem. Measured in dollars scheduled within 30 days over dollars diagnosed, it exposes the revenue gap between diagnosis and collection.
This metric is for dentists and treatment coordinators who present financing and verify insurance before the patient reaches the front desk. It trades away the illusion that clinical skill alone drives revenue, since a patient can decline $2,800 of diagnosed crown work. It sits just below production per chair because an empty chair makes acceptance academic.
3. Hygiene Recall Rate

Hygiene recall rate ranks third because hygiene is a separate P&L inside the same building, contributing 25-33% of gross billings. The national average runs 65-74%, the A-tier benchmark is 85% or higher, and only about 17% of practices have most active patients on a true six-month recall. It must count completed visits, not pre-appointed ones.
This KPI is for hygiene coordinators and practice owners who own the recall queue and the reactivation list. It trades away the false comfort of a fully pre-appointed schedule when 15-25% of those appointments break. It ranks just below case acceptance because recall feeds the exam where acceptance happens, but does not itself convert treatment.
4. New Patient Acquisition Cost

New patient acquisition cost ranks fourth because growth without channel-level CAC is just spending. A single-doctor general practice should see 25-40 new patients monthly at $150-$250 acquisition cost; cosmetic runs $250-$500, ortho $200-$400, and implants $400-$800. Lead-to-exam conversion of 45-65% means a 50-lead month is really 22-32 exams.
This KPI is for practice owners and marketing managers who split spend by channel instead of watching one blended number. It trades away the vanity of lead volume, which flatters dashboards without generating production. It ranks below hygiene recall because a dormant patient costs roughly $12 to reactivate versus $312 to acquire fresh.
5. Treatment Mix by Category
Treatment mix by category ranks fifth because it reveals whether a practice is a cleaning service or a full dental business. Healthy 2027 benchmarks are hygiene 25-33%, basic restorative 30-40%, major restorative 20-30%, and cosmetic or aligner work 5-15%. Hygiene above 35% combined with case acceptance under 60% means high-margin work is being diagnosed and declined.
This KPI is for owners planning equipment purchases, specialist hiring, and fee-schedule audits across a multi-doctor group. It trades away simplicity, since procedure categories must be mapped cleanly in Dentrix, Eaglesoft, or Open Dental. It ranks below acquisition cost because mix describes what you sell, not how many patients arrive to buy it.
6. No-Show and Cancellation Rate

No-show and cancellation rate ranks sixth because a broken appointment destroys the same chair hour whether the patient ghosts or cancels at 8am. Planet DDS data shows roughly 7.4% no-shows plus 15.5% same-day cancellations, about 23% combined, while top-quartile practices hold no-shows at 3-4%. A-tier combined targets sit under 8%.
This KPI is for front-desk leads and office managers who enforce confirmation calls, deposits, and same-day cancellation policies. It trades away goodwill with chronically unreliable patients, who are often the same ones declining treatment. It ranks below treatment mix because a lost hour caps production regardless of how well the remaining hours are sold.
7. Patient Reactivation Rate

Patient reactivation rate ranks seventh because dormant patients are the cheapest production available to any practice. Top-tier offices reactivate 8-12% of the 13-24 month inactive pool each quarter, average practices manage 3-5%, and a 2,500-active-patient practice typically holds 800-1,200 inactives worth $1.5-$2.5M in latent revenue. Reactivation costs roughly $12 per touch versus $312 to acquire new.
This KPI is for marketing coordinators and owners willing to run SMS, email, and handwritten-card sequences against an old patient list. It trades away the excitement of new-patient marketing for the quieter math of existing relationships. It ranks below no-show rate because reactivation fills gaps rather than preventing them.
8. Practice Overhead Percentage

Practice overhead percentage ranks eighth because it determines whether production actually becomes profit. Healthy general practices run 55-65% of collections in operating costs excluding doctor compensation; under 55% is elite, and above 70% signals financial distress. Independent fee-for-service practices in low-cost states like Texas and Tennessee can hold 52-58%.
This KPI is for owners and partners reviewing staffing ratios, supply contracts, and lab fees each month. It trades away cross-practice comparability if doctor compensation gets folded in, the most common chart-of-accounts error in dentistry. It ranks below reactivation because overhead is a ratio, not a growth lever you can pull directly.
9. Net Collections Ratio

Net collections ratio ranks ninth because production on a dashboard is not money in the bank. The standard is 98% or higher of adjusted production collected; below 96% indicates billing-process leakage, and below 92% is a billing crisis. Pacific Dental Services' centralized RCM operation reports 98-99% across supported offices.
This KPI is for billing managers and owners auditing insurance verification, claim submission, and patient balance follow-up. It trades away the comforting headline of gross collections, which hides write-offs and PPO adjustments as if they were revenue. It ranks below overhead because a practice can collect efficiently and still spend too much doing it.
10. Hygiene to Restorative Conversion
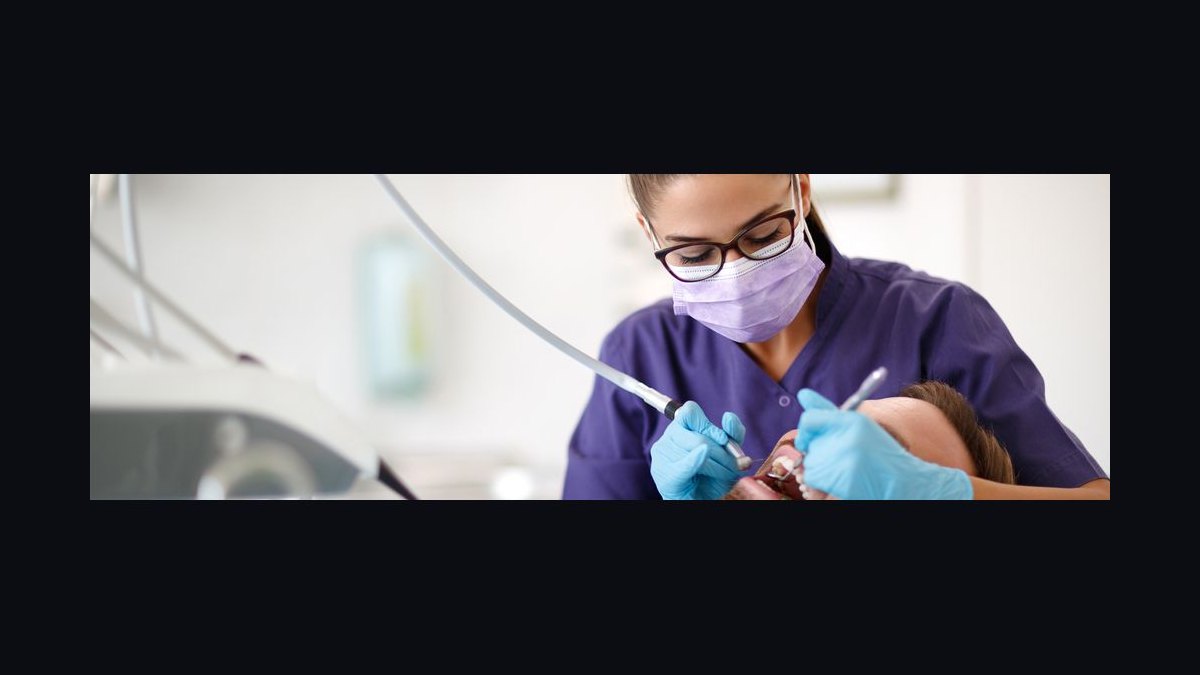
Hygiene to restorative conversion ranks tenth because the hygienist sees the patient first, and the diagnosis either happens in that chair or not at all. The target is roughly 60% conversion from hygiene visits into accepted restorative treatment; practices that skip this measurement leave an estimated $200,000-$400,000 annually on the table. It pairs directly with recall and case acceptance data.
This KPI is for hygiene teams and dentists building a co-diagnosis protocol with intraoral cameras and same-day treatment planning. It trades away the autonomy of a hygiene column run in isolation from the doctor's schedule. It ranks last because it depends on recall and acceptance already functioning, making it the final link in the chain.
How we ranked these
We ranked the nine KPIs by weighting three factors: direct revenue impact, controllability by practice leadership, and data availability inside standard PMS platforms like Dentrix, Eaglesoft, Open Dental, and Curve. Production per chair, case acceptance, and hygiene recall carried the heaviest weight because they map directly to chair capacity, revenue capture, and recurring patient flow. Acquisition cost, no-show rate, and reactivation were weighted next.
We deliberately ignored vanity metrics that flatter dashboards without changing behavior: total social followers, website sessions, Google review count, and raw lead volume. We also excluded doctor compensation from overhead comparisons and skipped generic benchmarks borrowed from SaaS or retail. Dental economics hinge on chair hours, hygiene as a separate engine, and insurance-driven case acceptance, so metrics that ignore those structural facts were dropped entirely.
What to look for
When choosing between KPI frameworks, prioritize ones that pull live from your PMS rather than requiring manual spreadsheet entry. Dental Intelligence, Practice by Numbers, and Jarvis Analytics all connect directly to Dentrix, Eaglesoft, or Open Dental, which means your Monday huddle reflects yesterday's production, not last month's. Confirm the tool computes case acceptance at the dollar level, not the case level, or you will miss large revenue leaks.
The mistake most buyers make is purchasing a dashboard before defining formulas in writing. Two practices can report 70% recall and mean completely different things: one counts scheduled appointments, the other counts completed visits. Lock definitions first, baseline against ADA Health Policy Institute medians, then buy software. Also avoid tools that bundle doctor compensation into overhead, since that single chart-of-accounts error makes peer benchmarking impossible.
Related questions
What is a good production per chair per hour for a general dental practice?
Healthy general practices target $550 to $650 per chair hour, while cosmetic and implant-heavy offices push $750 or more. Below $400 signals scheduling gaps, fee-schedule problems, or underutilized operatories. Measure against available chair hours, not just scheduled ones, because an empty Tuesday afternoon still carries fixed overhead of roughly $120 per hour.
How is case acceptance rate calculated in dentistry?
Divide dollars of treatment scheduled within 30 days by dollars of treatment diagnosed over the same rolling window. National average sits near 61%, top-decile practices hit 85% or higher, and anything below 55% points to a treatment-presentation problem. Always measure at the dollar level, since a patient accepting a $200 prophy but declining a $2,800 crown should not count as full acceptance.
What is a healthy hygiene recall rate for a dental office?
National average runs 65 to 74%, and 85% or higher is the A-tier benchmark. Only about 17% of practices have most active patients on a six-month recall. Measure completed visits, not just scheduled appointments, because pre-appointing everyone while running a 15 to 25% broken-appointment rate produces a misleading recall number that hides real chair-time loss.
How much should a dental practice spend to acquire a new patient?
General dentistry acquisition cost typically lands between $150 and $250, cosmetic between $250 and $500, ortho $200 to $400, and implants $400 to $800. Track cost by channel, not blended, because an $80 SEO acquisition and a $220 Google Ads acquisition averaged together hide which spend actually works. Pair cost with patient lifetime value before scaling any channel.
What no-show rate should a dental practice target in 2027?
Planet DDS data shows roughly 7.4% no-show plus 15.5% same-day cancellation, about 23% combined. Top-quartile practices run 3 to 4% no-show and under 8% combined. Count same-day cancellations alongside no-shows, because the lost chair hour costs the same either way and separating them lets the real problem hide in the schedule.
Why does patient reactivation matter more than new patient marketing?
Reactivating a dormant patient costs roughly $12 via SMS and email, while acquiring a new one runs $312 or more, a 26x differential most practices ignore. A general practice with 2,500 active patients typically holds 800 to 1,200 inactive patients representing $1.5M to $2.5M in latent revenue. Top practices reactivate 8 to 12% of that pool quarterly.
What overhead percentage is sustainable for a dental practice?
Healthy general practices run 55 to 65% overhead excluding doctor compensation, with under 55% considered elite and above 70% a financial-distress signal. Including doctor pay in overhead is the most common chart-of-accounts error in dentistry and makes peer benchmarking meaningless. Independent fee-for-service practices in low-cost states can run 52 to 58%.
What is a good collections ratio for a dental practice?
Net collections divided by adjusted production should hit 98% or higher. Below 96% indicates billing-process leakage, and below 92% signals a billing crisis. Track gross collections separately from net, because insurance write-offs and PPO adjustments are real revenue evaporation and should never be confused with billing inefficiency in the same report line.
FAQ
What is the single most important KPI for a dental practice in 2027?
Production per chair is often treated as the top-line metric because it measures revenue against fixed overhead. An idle chair costs roughly $55 to $85 per hour in lost opportunity, so tracking this weekly surfaces scheduling gaps and underperforming providers fast. Pair it with collections ratio so production gains do not mask billing leakage.
How do I improve my case acceptance rate?
Aim for 85% or higher by focusing on patient education and treatment value rather than price alone. Practices using intraoral cameras, treatment-plan software, and a dedicated financial coordinator often jump from the 65 to 74% range into A+ territory. A two-day treatment-coordinator workshop from Levin Group, Jameson, or ACT Dental typically moves the number fastest.
What is a healthy new patient flow per general dentist?
Most successful practices generate 25 to 40 new patients monthly per general dentist. Below 25 means examining marketing channels and online reputation; above 40 may signal over-reliance on discount offers attracting less profitable patients. Group practices with three doctors should target 80 to 150 new patients monthly across the team.
Why is hygiene recall percentage so critical?
Hygiene recall feeds the production pipeline because patients coming in for cleanings accept restorative and cosmetic treatment at far higher rates. National average sits near 65 to 74%, but top practices hit 85% using automated reminders, online booking, and consistent communication. Hygiene also represents 25 to 33% of gross billings, making it a separate P&L inside the building.
How much should I spend on acquiring a new patient?
Acquisition cost varies widely: $150 to $400 for general dentistry and $250 to $500 for cosmetic or specialty services. Track this against lifetime value, because if an average new patient generates $1,500 or more over two years, a $300 acquisition cost remains sustainable. Channel-level cost is mandatory, since blended averages hide which spend works.
What is a realistic overhead percentage for a dental practice?
Most well-run practices keep overhead between 55 and 65% of collections, excluding doctor compensation. Above 65% points to staffing ratios, supply costs, or lab fees worth auditing; below 55% may mean underinvesting in equipment or marketing, which can hurt long-term growth. DSO-affiliated offices often run 60 to 65% after corporate services fees.
Should I track KPIs daily, weekly, or monthly?
Run a 10-minute daily huddle covering yesterday's production, today's scheduled production, open chair hours, confirmed appointments, and broken appointments. Weekly reviews handle case acceptance, new patient count, recall percentage, collections ratio, and AR over 90 days. Monthly and quarterly sessions cover treatment mix, acquisition cost by channel, overhead, and peer benchmarking.
What is the biggest KPI mistake dental practices make?
Confusing production with collections is the most expensive error. A practice can produce $1.2M and collect $1.05M, a $150K gap that hides in dashboards showing only production. Always display both numbers on the same row, and separate insurance write-offs from genuine billing inefficiency so the real leak becomes visible.
How does treatment mix affect practice profitability?
Hygiene should represent 25 to 33% of production, basic restorative 30 to 40%, major restorative 20 to 30%, and cosmetic or aligner work 5 to 15%. Hygiene above 35% combined with case acceptance below 60% means the practice cleans teeth well but fails to convert exams, leaving high-margin crown, implant, and cosmetic revenue on the table every month.
How long before a new KPI dashboard shows results?
Expect 30 days to instrument and baseline, 60 days to stabilize daily huddles and recall audits, and 90 days to see measurable movement in case acceptance and reactivation. Full quarterly benchmarking against ADA Health Policy Institute or Sikka peer medians typically reveals the first real trend shifts. Rushing the baseline phase produces dashboards nobody trusts.
Sources
- https://www.ada.org/resources/research/health-policy-institute
- https://www.dentaleconomics.com/
- https://www.planetcustodian.com/
- https://www.henryscheinone.com/
- https://www.drbicuspid.com/
- https://www.beckersdentalreview.com/
- https://www.sikka.com/
- https://www.dentalintelligence.com/
- https://www.patientprism.com/
Related on PULSE
- [More kpis for dental practices rankings and buying guides](/knowledge)
- [PULSE Tools and calculators](/tools)
- [Everything on PULSE RevOps](/)
This page will be disappearing soon. Save it to your device for $1 — or read it free while it is here.
@Kory-White- · if Venmo asks, the last 4 of my number are 2012
 pulse-industry-kpisTop 10 KPIs for Dance Studios in 2027
 pulse-industry-kpisTop 10 Sales KPIs for Oilfield Services in 2027
 pulse-industry-kpisTop 10 Sales KPIs for Commercial Laboratory Diagnostics in 2027
 pulse-industry-kpisTop 10 KPIs for Driving Schools in 2027
 pulse-industry-kpisTop 10 Sales KPIs for Commercial Solar EPC (Engineering, Procurement & Construction) in 2027
 pulse-industry-kpisTop 10 KPIs for Self-Storage Facilities in 2027
 pulse-industry-kpisTop 10 Sales KPIs for equine breeding in 2027
 pulse-industry-kpisTop 10 Sales KPIs for Hospital Group Purchasing Organization (GPO) in 2027
 pulse-industry-kpisTop 10 Sales KPIs for Industrial Bolting & Flange Joint Integrity Services in 2027
 pulse-industry-kpisTop 10 KPIs for Residential Cleaning Companies in 2027