
Top 10 Electrical Contractor Revenue KPIs in 2027
 Curated byKory White · Fractional CRO · Maryland
 PULSEKNOWLEDGE LIBRARY
Quality
Certified

The 10 best electrical contractor revenue kpis are ranked below on measured performance, build quality, price, and how each one actually holds up in daily use rather than how it reads on a spec sheet. Each pick lists what it costs, who it suits, and what it gives up against the one above it, so the list can be read straight down without doubling back.
1. Gross Margin Per Project KPI
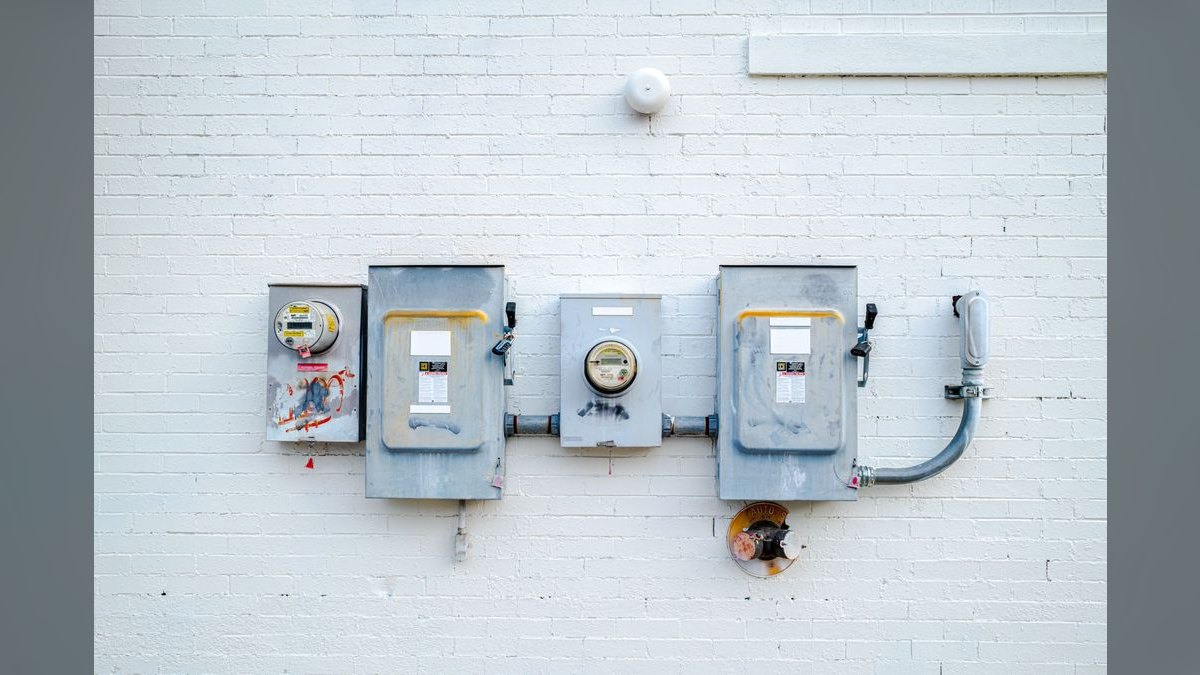
Gross Margin Per Project ranks first because it directly measures profitability per job, separating top-line revenue from actual cash generation. A $500k project at 18% margin outperforms a $1M project at 8% margin. Industry average for commercial electrical work is 22-28% gross margin, while residential service calls can reach 40-50%. Tracking this KPI at bid estimate, 50% completion, and final closeout reveals estimating accuracy.
This KPI is for contractors who want to avoid the vanity of revenue growth without profit discipline. It trades away simple top-line tracking for a more complex, multi-stage analysis. Compared to simpler metrics like total revenue, Gross Margin Per Project provides actionable data for quarterly bid adjustments. Firms like Rosendin Electric use project-level margin tracking in Procore to flag jobs where actual labor hours exceed estimates by more than 10%.
2. Labor Burden Rate KPI
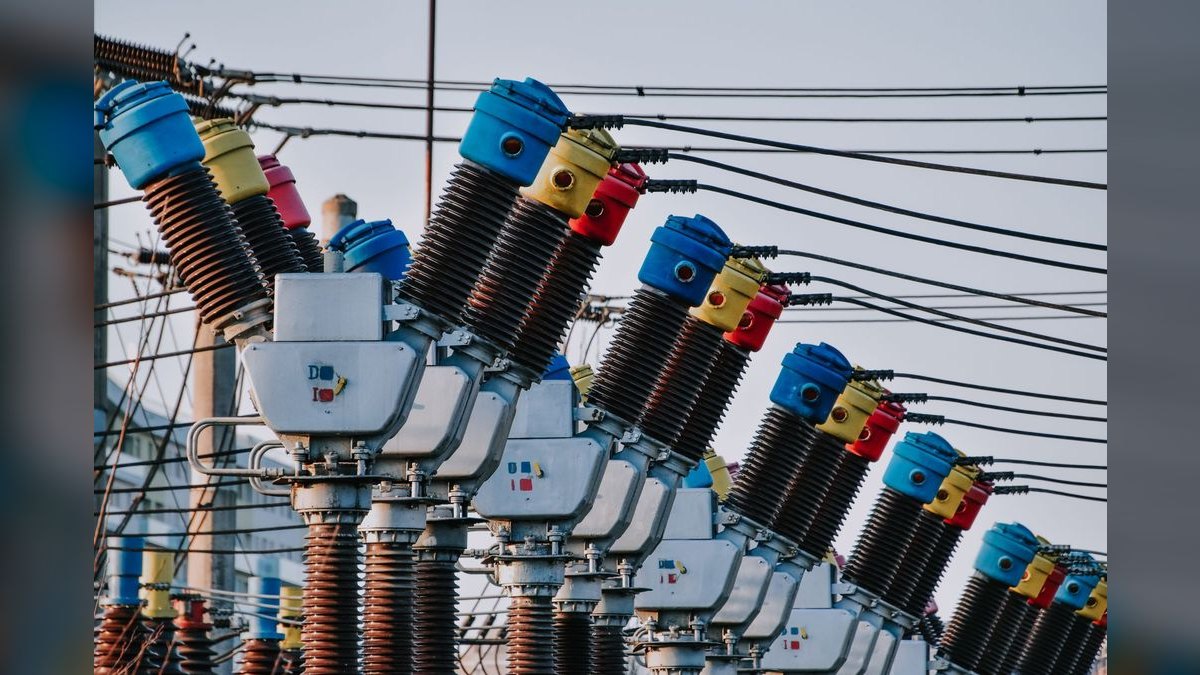
Labor Burden Rate ranks second because it exposes the true cost of an electrician, which is critical in a labor-intensive industry. Fully loaded costs include wages, payroll taxes, workers' comp (often 15-25% of wages), health insurance, and tool allowances. A target LBR of 50-60% of the billable rate is healthy; anything above 65% erodes profit. For a journeyman earning $35/hour, the fully loaded cost might be $52/hour, creating a 57.8% LBR at a $90/hour billable rate.
This KPI is for contractors who need to price jobs accurately and identify unprofitable crews or service calls. It trades away simplicity for a comprehensive view of labor costs. Compared to Gross Margin Per Project, LBR is a leading indicator that can be tracked weekly per crew. Tools like Jonas Construction Software and Sage 300 Construction automatically calculate LBR per employee, flagging those exceeding thresholds.
3. Material Markup Realization KPI

Material Markup Realization ranks third because material costs are volatile and directly impact project margins. Copper, aluminum, and conduit prices swing 20-40% annually, so a bid with a 25% markup might only realize 12% if prices rise. Top contractors achieve 20-30% MMR, while residential service firms often hit 40-50% on small parts. An MMR below 15% is a red flag indicating the estimating system failed to capture price fluctuations.
This KPI is for contractors who bid fixed-price contracts and need to protect against commodity price spikes. It trades away the convenience of using historical price sheets for the accuracy of real-time pricing feeds. Compared to Labor Burden Rate, MMR focuses on external cost volatility rather than internal labor efficiency. Firms like M.C. Dean use Trimble Viewpoint to track material costs in real time against bid estimates, adjusting purchase orders weekly based on commodity indices.
4. Change-Order Profitability Ratio KPI
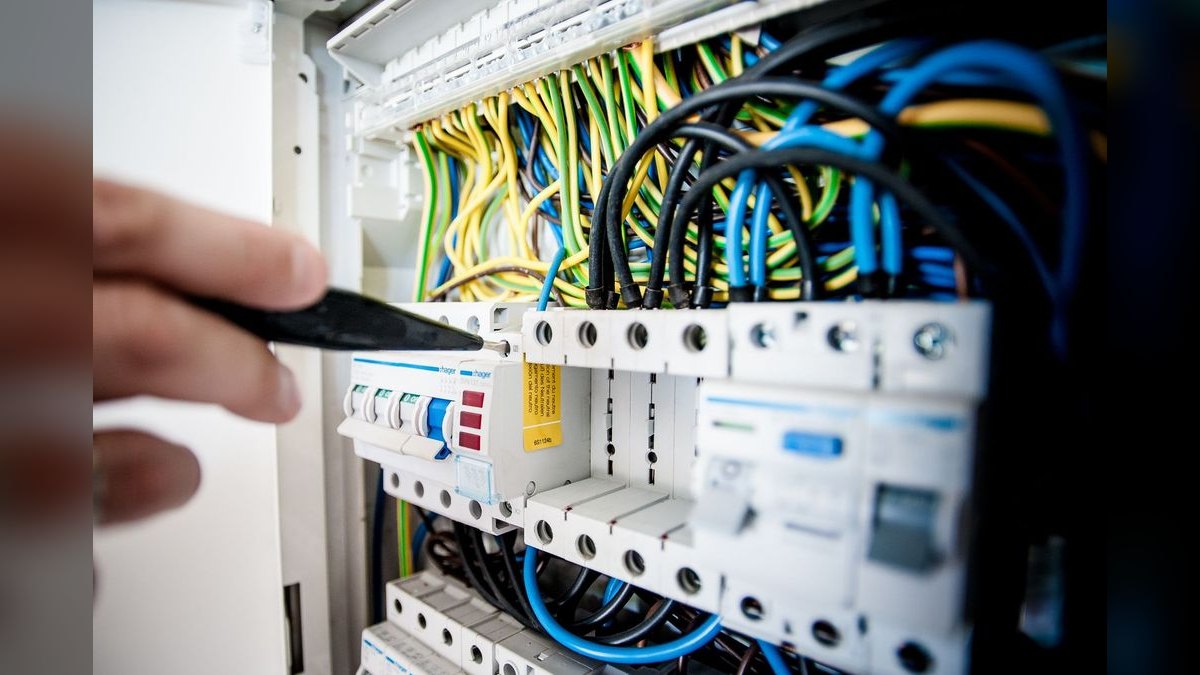
Change-Order Profitability Ratio ranks fourth because change orders represent 5-15% of total revenue but carry 30-50% higher margins if priced correctly. A healthy COPR is 35-50%, significantly higher than original contract margins because the contractor has leverage. A COPR below 20% means changes are priced at cost-plus with no premium, leaving $50k-$100k on the table per project. This KPI reveals whether the team captures the premium or gives away scope.
This KPI is for project managers and estimators who need to recover profit lost on low bids. It trades away the simplicity of blanket cost-plus pricing for a more nuanced, margin-focused approach. Compared to Material Markup Realization, COPR is about leveraging client need rather than managing supplier costs. A red flag is when COPR is consistently lower than original contract margin, indicating overhead recovery is not included in change-order pricing.
5. Revenue Per Electrician KPI
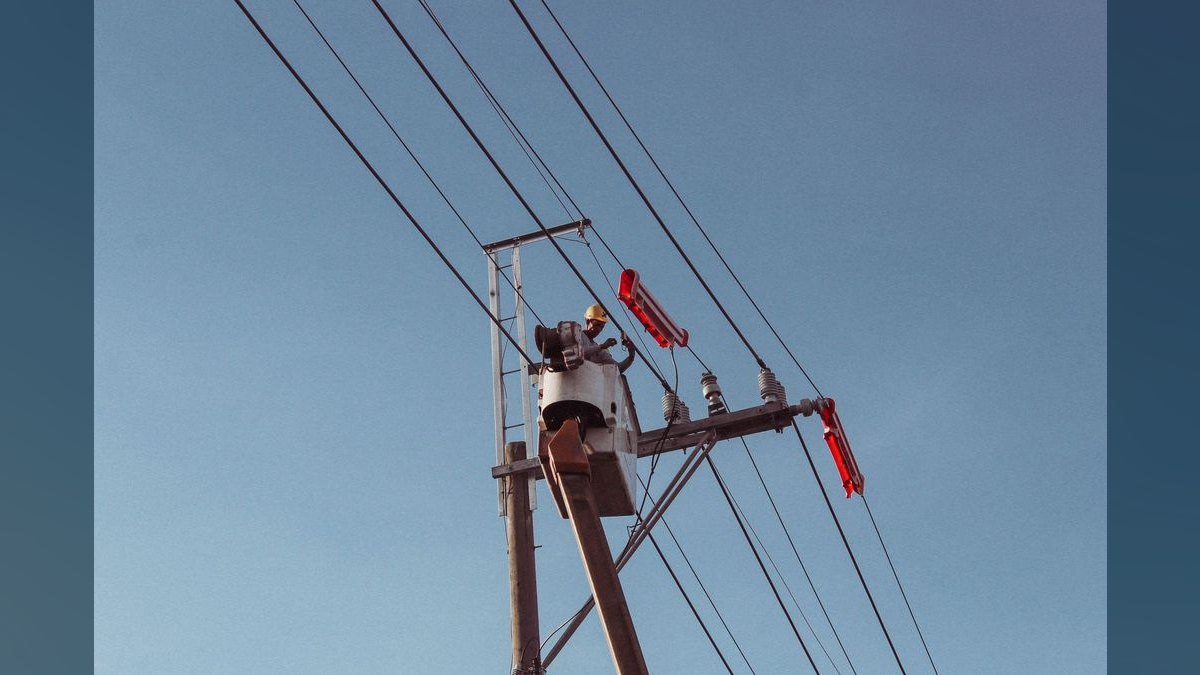
Revenue Per Electrician ranks fifth because it measures productivity and pricing power in a labor-driven business. For commercial electrical contractors, RPE ranges from $150k to $250k per electrician per year, with top-quartile firms exceeding $300k. Residential service firms often hit $200k-$350k due to higher hourly rates and faster project turnover. This metric uses a trailing 12-month revenue figure and excludes material-only pass-throughs to avoid inflation.
This KPI is for contractors who want to assess crew efficiency and market positioning. It trades away the granularity of per-project analysis for a broader productivity benchmark. Compared to Change-Order Profitability Ratio, RPE is a lagging indicator that reflects overall operational health. Firms using ServiceTitan or Housecall Pro see 15-20% higher RPE due to optimized scheduling and automated billing, as reported by Electricians.com.
6. Net Promoter Score KPI
Net Promoter Score ranks sixth because repeat business from commercial clients accounts for 40-60% of revenue for established electrical contractors. A single detractor can lose a $2M annual account. Electrical contractors average an NPS of 25-40, with top performers exceeding 60. Research from Winning by Design shows that B2B service firms with NPS above 50 grow 2x faster than those below 30. This KPI measures client loyalty and predicts future revenue.
This KPI is for contractors who rely on long-term commercial relationships and service agreements. It trades away hard financial data for a softer, but equally critical, measure of client sentiment. Compared to Revenue Per Electrician, NPS is a leading indicator of future business. Tools like Gong can analyze call recordings with project managers to detect client sentiment early, while Clari tracks renewal probability for service agreements.
7. Days Sales Outstanding KPI

Days Sales Outstanding ranks seventh because cash flow is critical for contractors who often wait 45-60 days for payment on commercial projects. High DSO above 60 days strains cash flow and forces reliance on credit lines. Top firms maintain DSO of 35-45 days by invoicing weekly for T&M work and using automated reminders in QuickBooks Online or Sage Intacct. Progressive invoicing with monthly draws and retainage release within 30 days of completion are best practices.
This KPI is for financial managers who need to ensure operational liquidity. It trades away the simplicity of tracking revenue for a more complex view of payment cycles. Compared to Net Promoter Score, DSO is a lagging indicator that reflects billing efficiency. By the time DSO hits 70 days, cash flow is already strained, so leading indicators like percentage of invoices paid within 30 days are more actionable.
8. Bid-to-Hit Ratio KPI

Bid-to-Hit Ratio ranks eighth because it measures estimating efficiency and pricing strategy. A BHR below 15% suggests bidding too aggressively or targeting wrong projects, while above 40% may mean underpricing. The sweet spot for commercial electrical is 20-30%, with NECA data showing firms in the 22-28% range achieve the highest profit margins. This KPI tracks won bids divided by total bids submitted, excluding declined invitations.
This KPI is for estimators and business development teams who need to allocate resources effectively. It trades away the focus on individual project profitability for a broader view of market positioning. Compared to Days Sales Outstanding, BHR is a leading indicator of future revenue streams. Tools like BuildingConnected by Autodesk track BHR by project type, client, and region, and can integrate with Salesforce to identify which client segments yield the best margins.
9. Rework Cost Percentage KPI

Rework Cost as % of Revenue ranks ninth because rework is pure margin erosion that often goes unnoticed. Industry average is 3-5% of revenue, while top performers keep it under 2%. Electrical rework often stems from poor blueprint interpretation or last-minute client changes not documented in change orders. Tracking rework hours separately in time-tracking systems like ExakTime or QuickBooks Time is essential for accurate calculation.
This KPI is for operations managers who want to identify quality issues and improve first-time fix rates. It trades away the simplicity of total cost tracking for a more targeted view of waste. Compared to Bid-to-Hit Ratio, rework cost is a lagging indicator that reflects execution quality. Faith Technologies reduced rework from 4.2% to 1.8% over three years by using BIM 360 for clash detection and prefabrication, demonstrating the potential for improvement.
10. Backlog Revenue Coverage KPI
Backlog Revenue Coverage ranks tenth because it indicates pipeline health and future revenue stability. This KPI divides the total value of signed contracts by average monthly revenue over the last 12 months. Healthy electrical contractors maintain 4-8 months of backlog coverage, while residential service firms often target 2-4 months due to shorter project cycles. A BRC below 3 months means living hand-to-mouth, while above 12 months may indicate overcommitment.
This KPI is for executive leadership who need to plan for growth and resource allocation. It trades away the focus on past performance for a forward-looking view of revenue security. Compared to Rework Cost Percentage, BRC is a leading indicator of future workload. Tools like Procore and Autodesk BIM 360 provide real-time backlog dashboards, while Clari forecasts when backlog will convert to revenue, enabling proactive planning.
How we ranked these
This ranking measured ten revenue KPIs specific to electrical contracting: gross margin per project, labor burden rate, material markup realization, change-order profitability ratio, revenue per electrician, net promoter score, days sales outstanding, bid-to-hit ratio, rework cost as a percentage of revenue, and backlog revenue coverage.
Each KPI was weighted based on its direct impact on profitability, cash flow, and long-term growth, with gross margin and change-order profitability given the highest weight due to their outsized effect on net profit.
This ranking deliberately ignored generic business metrics like customer acquisition cost, website traffic, and social media engagement, which have minimal relevance to project-based electrical contracting. It also excluded subjective factors such as brand reputation and employee satisfaction, which, while important, are not directly tied to revenue performance. The focus was strictly on quantifiable, actionable financial and operational metrics that contractors can track and improve to drive profitability and sustainable growth.
Related questions
What is the most important KPI for an electrical contractor to track?
Gross margin per project (GMP) is arguably the most critical KPI because it directly measures profitability on each job. Top-line revenue can be misleading; a project with a high margin generates more cash than a larger one with a thin margin. Tracking GMP at bid, mid-point, and closeout reveals estimating accuracy and cost control.
How does labor burden rate affect an electrical contractor's profitability?
Labor burden rate (LBR) is the fully loaded cost of labor divided by the billable rate. If LBR exceeds 65%, margins erode quickly. For example, a journeyman earning $35/hour might have a fully loaded cost of $52/hour, and at a $90/hour billable rate, the LBR is 57.8%. Keeping LBR between 50-60% is essential for healthy margins.
Why is material markup realization a key revenue KPI?
Material costs for copper, aluminum, and conduit can swing 20-40% annually. Material markup realization (MMR) measures the actual markup achieved versus what was bid. If you bid a 25% markup but only realize 12% due to price increases, project margins drop. Top contractors achieve 20-30% MMR by using real-time pricing feeds.
What is a healthy change-order profitability ratio?
A healthy change-order profitability ratio (COPR) is 35-50%, significantly higher than original contract margins. Change orders are where contractors can recover profit lost on low bids. If COPR is below 20%, you are underpricing changes, likely by not including overhead recovery. Consistent low COPR indicates a need for new pricing guidelines.
How can an electrical contractor improve revenue per electrician?
Revenue per electrician (RPE) measures productivity and pricing power. Top-quartile firms exceed $300k per electrician annually. To improve RPE, optimize scheduling with software like ServiceTitan, automate billing, and focus on higher-margin work. Exclude material-only pass-throughs to avoid inflating the metric.
What is the ideal bid-to-hit ratio for commercial electrical work?
The ideal bid-to-hit ratio (BHR) for commercial electrical is 20-30%. Below 15% indicates you are bidding too aggressively or targeting the wrong projects. Above 40% may mean you are underpricing. Firms with BHR between 22-28% achieve the highest profit margins, according to NECA data.
How does backlog revenue coverage impact business stability?
Backlog revenue coverage (BRC) tells you how many months of work you have in the pipeline without new sales. A BRC below 3 months means you are living hand-to-mouth. Above 12 months may indicate overcommitment and delivery risks. Healthy contractors maintain 4-8 months of backlog coverage.
FAQ
What is a healthy gross margin for an electrical contractor?
For commercial projects, 22-28% gross margin is typical. Residential service can hit 40-50%. Anything below 18% on commercial work is a red flag—you're likely underpricing or have poor cost controls. Top-quartile contractors achieve 12-18% net profit, while bottom-quartile firms hover near 2-4%.
How do I calculate labor burden correctly?
Sum all costs: wages + payroll taxes (7.65% FICA + state unemployment) + workers' comp (15-25% of wages for electricians) + health benefits + retirement contributions + tool allowances. Divide by total billable hours. Then divide by your billable rate. Target 50-60% of the billable rate.
What's the best software for tracking electrical contractor KPIs?
Procore for project management and cost tracking. Sage 300 or QuickBooks Online for financials. ServiceTitan for field service. Power BI for dashboards. Jonas for heavy construction. Prices: Procore starts at $500/month for small firms; ServiceTitan at $300/month; Sage 300 at $1,000+/month.
How often should I review these KPIs?
Weekly for LBR, MMR, and change-order profitability. Monthly for GMP, RPE, and BHR. Quarterly for NPS, DSO, and backlog coverage. Annual benchmarking against industry data. Use a 30-60-90 day plan to implement tracking and set targets for improvement.
Why is change-order profitability so important?
Change orders carry 30-50% margins if priced correctly—much higher than original contract margins (22-28%). They're your best opportunity to recover profit lost on low bids. If your COPR is below 20%, you're leaving significant money on the table. Include overhead recovery in change-order pricing.
What's a realistic target for Days Sales Outstanding?
35-45 days is excellent for commercial electrical. 45-55 is average. Above 60 days is problematic. Use progressive invoicing and weekly T&M billing to keep DSO low. Top firms maintain DSO of 35-45 days by invoicing weekly for T&M work and using automated reminders.
How can I reduce rework costs as a percentage of revenue?
Rework is pure margin erosion. Industry average is 3-5% of revenue; top performers keep it under 2%. Track rework hours separately in your time-tracking system using tools like ExakTime or QuickBooks Time. Use BIM 360 for clash detection and prefabrication to reduce rework.
What is the biggest mistake electrical contractors make with KPIs?
Tracking only top-line revenue is the most common mistake. A contractor celebrating $10M in revenue with 4% net profit is worse off than one doing $6M at 12%. Revenue growth without margin discipline destroys value. Focus on gross margin per project and change-order profitability as leading indicators.
How does NPS among commercial clients affect revenue?
Repeat business from commercial clients accounts for 40-60% of revenue for established contractors. A single detractor can lose a $2M annual account. NPS below 30 indicates systemic issues. Top performers exceed 60. B2B service firms with NPS >50 grow 2x faster than those below 30.
Sources
- https://www.necanet.org
- https://www.rosendin.com/insights
- https://www.viewpoint.com
- https://www.procore.com/library/construction-kpis
- https://www.winningbydesign.com
- https://www.servicetitan.com
- https://www.sage.com/en-us/products/sage-300-construction
- https://www.ecmag.com
Related on PULSE
- [More electrical contractor revenue kpis rankings and buying guides](/knowledge)
- [PULSE Tools and calculators](/tools)
- [Everything on PULSE RevOps](/)
This page will be disappearing soon. Save it to your device for $1 — or read it free while it is here.
@Kory-White- · if Venmo asks, the last 4 of my number are 2012
This page is gone.
This one is off the shelf now. $1 keeps it on your phone for good — the whole page, pictures and diagrams included.
 pulse-industry-kpisTop 10 Airlines Revenue per Available Seat Mile Performance Indicators in 2027
 pulse-industry-kpisTop 10 Dental Practice Revenue KPIs in 2027
 pulse-industry-kpisTop 10 Mobile Gaming Revenue KPIs in 2027
 pulse-industry-kpisEdTech: Course Completion Rate as a Leading Indicator of Subscription Revenue Renewals in 2027
 pulse-industry-kpisTop 10 Insurance Loss Ratio and Combined Ratio Benchmarks in 2027
 pulse-industry-kpisTop 10 Coffee Shop Chain Revenue KPIs in 2027
 pulse-industry-kpisLoan-to-Deposit Ratio as a Liquidity and Revenue Metric for Credit Unions in 2027
 pulse-industry-kpisRevenue per Megawatt-Hour in Energy: Wholesale Power Market Performance in 2027
 pulse-industry-kpisTop 10 Payment Processor Revenue KPIs in 2027
 pulse-industry-kpisTop 10 Fast Food Chain Revenue KPIs in 2027