


What are the top 10 NIL deals signed by college basketball players in 2027?
Quality
Certified

No verified list of the top 10 NIL deals signed by college basketball players in 2027 exists publicly. Basketball NIL contracts are private, and the figures that circulate are valuation estimates, not signed terms. Realistically, the top tier is a handful of guards and forwards earning roughly $2M–$5M+ annually through school revenue share plus collective and brand money.
The request that never has a clean answer
Picture the version of this that shows up in a real inbox. A brand-side marketing lead is building a college basketball activation budget for the 2027 season and asks a simple-sounding question: give me the top ten deals so I know what the ceiling looks like. Or it's an athletic department wanting to know whether the number a recruit's agent just quoted is anywhere near market. Or a journalist trying to write the "richest players in college hoops" piece that gets a million clicks every March.
Every one of those requests assumes a document that does not exist. There is no league office publishing a salary table. There is no players' association filing contract terms. There is no equivalent of the NBA's collective bargaining agreement making compensation a matter of public record. A college basketball player's total 2027 pay is assembled from at least three separate contracts — a revenue-sharing agreement with the school, one or more NIL agreements with a collective or the school's in-house marketing arm, and whatever independent brand deals an agent has closed — and none of those three are required to be disclosed to the public. Several states have gone further and written statutory confidentiality into their NIL laws specifically so that these numbers stay out of open-records requests.
So what actually circulates instead? Three things, and it's worth being precise about the difference, because conflating them is how almost every "top 10 NIL deals" article goes wrong.
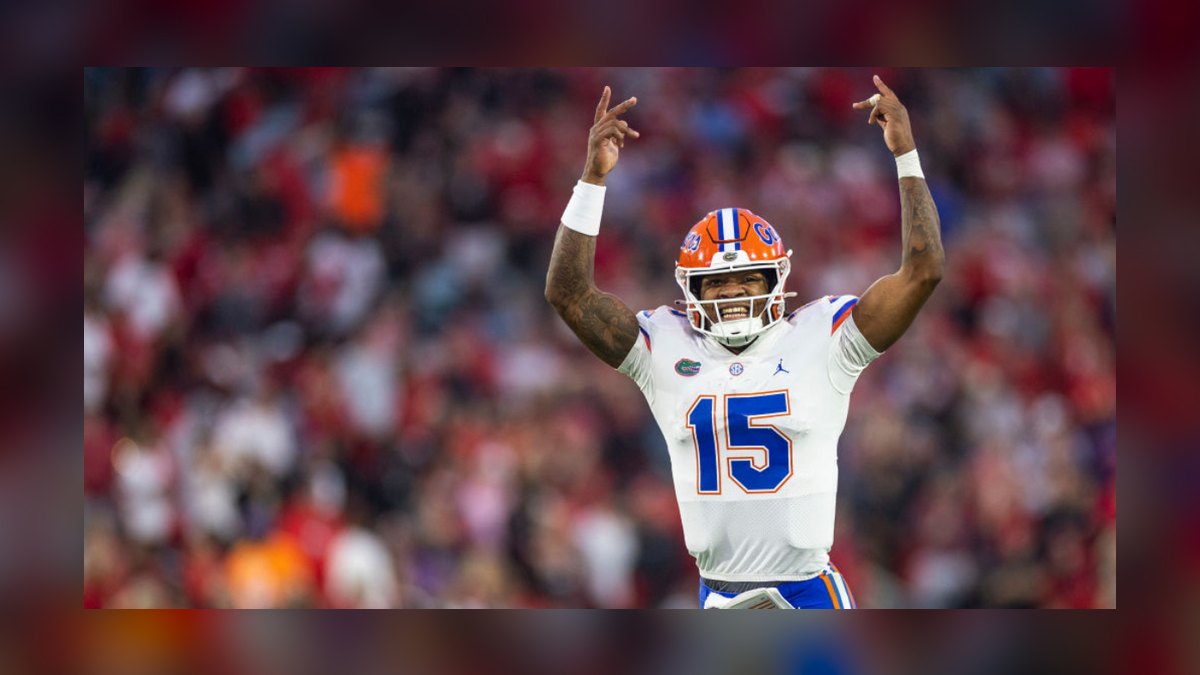
The first is a valuation estimate. Outlets like On3 publish an NIL valuation for individual athletes. That number is an algorithmic projection of what a player's name, image, and likeness *could* be worth based on social following, engagement, performance, and market — it is explicitly a model output, not a contract. A player can carry a $3M valuation and have signed for $1.4M, or vice versa.
The second is a reported figure, meaning a number a reporter got from a source with an interest in the number being known. Agents leak high figures to set the market for their next client. Rival programs leak high figures to imply a school is overspending. Schools leak low figures to manage donor expectations. Every reported NIL number arrives with a motive attached, and the reporting rarely specifies whether it covers one year or three, whether it includes incentives that may never vest, or whether it counts the school's revenue share, the collective money, or both.
The third is an aggregate that's actually solid — total revenue-share pools, conference-level allocation frameworks, roster limits, tournament payouts. These come from court filings, settlement documents, and institutional budgets. They're the only inputs in the whole ecosystem that hold up to scrutiny, and they're what a serious answer has to be built from.
The honest deliverable for the brand lead, then, isn't a ranked list of ten names. It's a defensible estimate of what the top of the market looks like, built from the parts of the system that are knowable, with explicit error bars. That's a less satisfying answer and a far more useful one — and it's what the rest of this page constructs. It's also the same discipline that applies one layer out, to football, to the transfer portal market, and to any compensation benchmarking exercise where the underlying contracts are private: you model the ceiling from structural constraints rather than from leaked anecdotes.
How a top-tier basketball package actually gets built

Since the House v. NCAA settlement took effect on July 1, 2025, elite college basketball compensation stopped being a single pile of collective money and became a stack of distinct instruments. Understanding the stack is what lets you estimate the top of the market without a leaked contract.
Layer one: the revenue-sharing agreement. Schools that opted into the settlement may share a capped pool directly with athletes — roughly $20.5 million per school in the first year, with an escalator in the low single digits annually, meaning the 2026-27 and 2027-28 pools sit modestly above that. This is a hard cap per institution across *all* sports, not per sport, which is the single most important constraint on any top-10 estimate. Widely discussed planning splits at power-conference schools put the large majority of the pool into football, with men's basketball commonly modeled somewhere in the mid-teens percentage range and women's basketball and Olympic sports dividing a smaller remainder. Apply that to a $21M-ish pool and a men's basketball roster's *entire* revenue-share allocation lands in the low millions — for fifteen scholarship spots. That math alone tells you a single player cannot be pulling $8M from revenue share at a school also fielding a football team.

Layer two: third-party NIL. Anything above the revenue-share allocation has to come from outside the cap — collectives, boosters, brands, apparel, local businesses. Under the post-settlement enforcement structure, third-party deals above a low dollar threshold have to be submitted for clearance to a review platform, where they're assessed for a legitimate business purpose and for whether the compensation falls within a defensible range for comparable services. The intent is to stop a booster from labeling a $2M payment as an autograph session. The practical effect is that collective money didn't disappear — it got restructured into arrangements with actual deliverables attached, and the biggest packages now require an actual commercial rationale.
Layer three: genuine brand equity. This is the layer where the very top of the market separates. A player with national name recognition signs shoe, beverage, gaming, trading card, and apparel deals that would exist regardless of which school they attend. This layer is uncapped and it's the reason the highest-paid athletes in college basketball are not necessarily on the highest-spending rosters. It's also why the women's game produces outliers: several of the most commercially valuable basketball players in the country over recent seasons have been women whose earnings skewed heavily toward national brand partnerships rather than school-side payments.
Layer four: incentives and structure. Modern agreements increasingly include performance escalators — conference honors, tournament advancement, minutes or usage thresholds — plus liquidated-damages or buyout provisions if a player enters the transfer portal before the term ends. Payments are typically monthly across a twelve-month term rather than a lump sum. All of this means the headline number in a report and the money that actually lands in an account can differ substantially.
The numbers that are actually knowable

Here is what can be stated with reasonable confidence, versus what is guesswork dressed as reporting.
Institution-level cap. The first-year revenue-share pool was approximately $20.5 million per participating school, escalating annually under the settlement's terms and projected to grow substantially over the ten-year window. That figure is documented in settlement materials, not sourced from an agent. Any estimate of top-10 basketball deals has to fit inside it.
Roster economics. Men's basketball roster limits sit at fifteen under the post-settlement framework. If a school allocates a mid-teens share of a roughly $21M pool to men's basketball, that's on the order of $3M spread across fifteen players. Real distributions are steeply top-loaded — it's common for a roster's top two or three players to absorb well over half the allocation — but even an aggressive top-load puts a single player's *revenue-share* component in the high six figures to low seven figures at most schools. Everything above that is third-party money.
Reported top-of-market totals. Across the 2025-26 and 2026-27 recruiting cycles, the most widely reported packages for the very best incoming freshmen and top transfers clustered in the $2M–$5M range in total annual value across all layers. Those are reported figures, not verified contracts, and they should be read as a range rather than a point estimate. What's consistent across the reporting is the shape: a small number of players — realistically fewer than fifteen nationally in the men's game — sit above the $2M line in any given year, with a much larger group of high-quality starters in the $300K–$1M band and rotation players well below that.
Valuation estimates as a ceiling indicator. Published NIL valuations for the top handful of college basketball players have generally topped out in the $4M–$5M neighborhood in recent cycles. Treat that as a soft ceiling signal for what the market believes a college player's total commercial worth is, not as a contract value.

Positional and archetype premiums. Lead guards and versatile forwards who project as top-five NBA picks command the largest packages; the premium tracks draft projection almost linearly. A consensus top-three recruit is worth multiples of a consensus top-twenty recruit. Proven high-usage transfers with two years of production often outbid incoming freshmen at the same projected draft slot, because the risk is lower.
Term length. Most agreements run one year, matching the portal cycle. Multi-year deals exist and are becoming more common at the very top, usually with escalating annual values and stiffer buyouts. A "$6M deal" reported without a term is frequently a multi-year total being compared against someone else's single-season figure — the most common apples-to-oranges error in these lists.
Costs against the headline. NIL income is generally taxed as self-employment income, reported on a 1099, which means the athlete owes both halves of payroll tax plus federal and state income tax and should be making quarterly estimated payments. Agent and marketing representation fees apply on top, commonly reported in the mid-single-digit percentages for contract representation and materially higher for marketing deals the agency actually sources. A widely reported $3M package is meaningfully less than $3M in the athlete's hands.
One structural exclusion worth knowing. International athletes on F-1 student visas face real restrictions on earning NIL income for activity performed inside the United States. Given how many high-major rosters carry international players, this is a genuine and underdiscussed factor in who can appear near the top of any earnings list at all.
Ranking methods, and what each one gets wrong
If you're going to build or evaluate a top-10 list, the method determines the answer. There are four viable approaches and each fails differently.

Method one: valuation-model ranking. Sort by published NIL valuation. Advantages: consistent, transparent methodology, available for essentially every notable player, updated continuously. Failure mode: it measures projected market worth, not money actually signed. It over-indexes on social following, which systematically inflates players with large personal audiences and understates quiet stars at blue-blood programs whose money is real but private. Best used for relative ordering, not absolute dollars.
Method two: aggregated reporting. Compile figures from credible beat reporters and national outlets and rank the reported totals. Advantages: closest to actual contract terms. Failure modes: severe selection bias — you only rank players whose agents wanted a number published; inconsistent definitions of what's included; and no way to verify. Two "reported" numbers on the same list frequently aren't measuring the same thing.
Method three: structural modeling. Start from the institutional cap, apply reported allocation splits, apply an observed top-loading distribution, then add an estimated third-party layer based on the player's national profile. Advantages: internally consistent, defensible, produces ranges rather than false precision, and it can't produce impossible numbers. Failure mode: it will miss genuine outliers — the player whose shoe deal dwarfs everything institutional.
Method four: commercial-activity ranking. Rank by observable brand partnerships — actual campaigns, actual shoe deals, actual national spots. Advantages: fully verifiable; you can see the ad. Failure modes: it captures only the endorsement layer and completely ignores school-side pay, so it produces a very different list, one that in recent years has skewed toward the most commercially visible women's basketball players.
The practical answer is to blend three and four and report a range: use structural modeling to bound the school-side money, use observable commercial activity to bound the brand layer, and present the result as "estimated $2.5M–$4M total 2027 value" rather than a fabricated exact figure. Then say plainly which players you couldn't assess.
Where these lists go wrong, and how to sanity-check one

Pitfall: the number exceeds the cap. If a list claims a player is earning $6M from a school that also funds football inside a roughly $21M institution-wide pool, either the figure includes uncapped third-party money — which should be stated — or it's wrong. Run the arithmetic against the cap first. It disqualifies bad numbers faster than anything else.
Pitfall: mixing terms. Always ask whether a figure is annual or total-contract. A three-year deal quoted as one number will sit artificially high next to single-season figures. Normalize everything to annual value before ranking.
Pitfall: counting unvested incentives. Reported packages often include the maximum achievable value with every escalator hit. Rank on guaranteed money and note the upside separately, the way any sane compensation analysis handles variable pay.
Pitfall: treating valuation as contract. This is the single most common error and it's usually unintentional — a writer grabs a published valuation, drops the word "valuation," and it becomes a "deal." Whenever you cite a valuation, keep the word attached.
Pitfall: a men's-only list presented as the whole sport. The women's game generates some of the largest genuine endorsement portfolios in college athletics, driven by national audience rather than institutional spend. A list of top NIL deals in college basketball that contains no women isn't a list of the top deals; it's a list of the top *school-side* payments in the men's game, and it should say so.
Pitfall: stale data mid-cycle. The portal reshuffles the entire market twice a year. A list built in November describes a roster landscape that may be substantially different by April. Date-stamp everything.

Pitfall: ignoring pending legal and regulatory change. The enforcement structure around third-party deals, ongoing antitrust litigation, state-law variation, and unresolved questions about whether athletes are employees can all move the ceiling within a single season. Any 2027 estimate should carry an explicit note that the regulatory environment is unsettled.
The sanity-check sequence, in order. One: does the total fit inside the institutional cap once you separate school money from third-party money? Two: is it annual or multi-year? Three: is it guaranteed or maximum-with-incentives? Four: is the source a contract, a valuation model, or an interested party? Five: is it dated within the current portal cycle? Six: does the list acknowledge what it excluded? A ranking that survives all six is worth publishing. Most don't, and the ones that don't are exactly why this question keeps getting asked without ever getting answered.
Related questions
Why can't anyone just publish the actual contracts?
They're private commercial agreements between athletes and schools, collectives, or brands. Several states have written confidentiality directly into their NIL statutes, and no governing body publishes terms. Public-records requests at state schools have been resisted successfully on trade-secret and privacy grounds.
Does revenue sharing count as an NIL deal?
Not strictly. Revenue sharing is a capped payment from the institution under the House settlement framework; NIL deals are third-party commercial agreements. Most reported "NIL packages" now blend both, which is why totals are hard to compare across sources without knowing the composition.
Who earns more, men's or women's college basketball players?

School-side money overwhelmingly favors the men's game. Endorsement money is far closer — several women's players have carried among the largest publicly reported valuations in all of college athletics, driven by national audience and social reach rather than institutional allocation.
How much of an NIL package does a player actually keep?
Less than the headline. Income is generally self-employment income subject to both halves of payroll tax plus income tax, with representation fees on top. Athletes should be filing quarterly estimated payments; the effective take-home is materially below the reported number.
Do these deals include buyouts if a player transfers?
Increasingly, yes. Liquidated-damages and repayment clauses tied to entering the transfer portal before the term ends are now common at the top of the market, and multi-year agreements almost always include them.
FAQ
Is there an official source for the top 10 NIL deals in college basketball?
No. There is no governing body, players' association, or regulator that publishes signed NIL contract values for college basketball players. The clearance process for third-party deals creates internal records, but those are not public. Every published ranking is either an estimate produced by a valuation model or a compilation of figures leaked by parties with an interest in the number.
What does the very top of the college basketball market look like in dollar terms?
Reported packages for the highest-profile players in recent cycles have clustered in the roughly $2M–$5M annual range across all compensation layers combined, with published valuation estimates topping out in a similar neighborhood. Fewer than fifteen men's players nationally are plausibly above $2M in any single year, with a much deeper band of quality starters between roughly $300K and $1M.

How does the House settlement cap affect what a single player can be paid?
The cap — approximately $20.5M per school in its first year, rising annually — applies across an entire athletic department, not per sport. With men's basketball commonly modeled at a mid-teens share, a full roster's institutional allocation is in the low millions. That structurally limits the school-paid portion of any individual deal; anything dramatically above it must be uncapped third-party money.
Why do reported figures vary so much for the same player?
Because different sources measure different things: annual versus multi-year totals, guaranteed versus maximum-with-incentives, school money only versus school plus collective plus brand. Add the incentives agents and rival programs have to shade numbers in opposite directions and two credible outlets can publish figures that differ by a factor of two for the same athlete.
Are these deals actually contracts a player can enforce?
Generally yes — they're standard commercial agreements with defined deliverables, payment schedules, and termination provisions. That cuts both ways: players have enforceable claims to payment, and schools and collectives have enforceable claims under buyout and liquidated-damages clauses. Disputes over unpaid collective money and contested transfers have already produced litigation.
What's the fastest way to tell a credible ranking from a fabricated one?
Check whether it distinguishes valuation from signed value, states whether figures are annual or total, separates guaranteed from incentive money, and names what it excluded. A ranking that does all four is doing real work. One that presents ten precise dollar figures with no methodology note is repackaging estimates as facts.
Sources
- https://www.ncaa.org/sports/2021/2/8/name-image-likeness-policy-question-and-answer.aspx
- https://www.ncaa.org/
- https://on3.com/nil/
- https://www.opendorse.com/
- https://businessofcollegesports.com/
- https://www.espn.com/mens-college-basketball/
- https://www.cbssports.com/college-basketball/
- https://www.si.com/college
- https://www.knightcommission.org/
- https://www.congress.gov/
Related on PULSE
- How the House v. NCAA revenue-sharing cap is split across sports
- What the NIL clearance process actually checks in a third-party deal
- Transfer portal buyouts: how liquidated damages clauses are written
- Why women's college basketball produces the biggest endorsement portfolios
- Benchmarking compensation when the underlying contracts are private
This page will be disappearing soon. Save it to your device for $1 — or read it free while it is here.
@Kory-White- · if Venmo asks, the last 4 of my number are 2012
This page is gone.
This one is off the shelf now. $1 keeps it on your phone for good — the whole page, pictures and diagrams included.
 pulse-recentHow do universities prevent NIL deals from violating Title IX in 2027?
 pulse-recentHow do NIL sneaker deals for Air Jordan and Yeezy athletes differ in 2027?
 pulse-recentWhat percentage commission do NIL agents typically charge student-athletes in 2027?
 pulse-recentWhat are the top 10 NIL deals signed by female college athletes in 2027?
 pulse-recentWhat are the top 10 NIL deals signed by college field hockey players in 2027?
 pulse-recentHow do NIL deals for sneaker endorsements differ from traditional apparel sponsorships in 2027?
 pulse-recentWhat are the top 10 NIL deals signed by gymnasts in 2027?
 pulse-recentHow do student-athletes report NIL income on their federal tax returns in 2027?
 pulse-recentCan international student-athletes on F-1 visas legally accept NIL payments in 2027?
 pulse-recentHow do state laws on NIL differ across the country in 2027?